50 posts tagged “observable”
2025
How I automate my Substack newsletter with content from my blog

I sent out my weekly-ish Substack newsletter this morning and took the opportunity to record a YouTube video demonstrating my process and describing the different components that make it work. There’s a lot of digital duct tape involved, taking the content from Django+Heroku+PostgreSQL to GitHub Actions to SQLite+Datasette+Fly.io to JavaScript+Observable and finally to Substack.
[... 1,345 words]Tom MacWright: Observable Notebooks 2.0. Observable announced Observable Notebooks 2.0 last week - the latest take on their JavaScript notebook technology, this time with an open file format and a brand new macOS desktop app.
Tom MacWright worked at Observable during their first iteration and here provides thoughtful commentary from an insider-to-outsider perspective on how their platform has evolved over time.
I particularly appreciated this aside on the downsides of evolving your own not-quite-standard language syntax:
Notebook Kit and Desktop support vanilla JavaScript, which is excellent and cool. The Observable changes to JavaScript were always tricky and meant that we struggled to use off-the-shelf parsers, and users couldn't use standard JavaScript tooling like eslint. This is stuff like the
viewofoperator which meant that Observable was not JavaScript. [...] Sidenote: I now work on Val Town, which is also a platform based on writing JavaScript, and when I joined it also had a tweaked version of JavaScript. We used the@character to let you 'mention' other vals and implicitly import them. This was, like it was in Observable, not worth it and we switched to standard syntax: don't mess with language standards folks!
2024
Share Claude conversations by converting their JSON to Markdown. Anthropic's Claude is missing one key feature that I really appreciate in ChatGPT: the ability to create a public link to a full conversation transcript. You can publish individual artifacts from Claude, but I often find myself wanting to publish the whole conversation.
Before ChatGPT added that feature I solved it myself with this ChatGPT JSON transcript to Markdown Observable notebook. Today I built the same thing for Claude.
Here's how to use it:
The key is to load a Claude conversation on their website with your browser DevTools network panel open and then filter URLs for chat_. You can use the Copy -> Response right click menu option to get the JSON for that conversation, then paste it into that new Observable notebook to get a Markdown transcript.
I like sharing these by pasting them into a "secret" Gist - that way they won't be indexed by search engines (adding more AI generated slop to the world) but can still be shared with people who have the link.
Here's an example transcript from this morning. I started by asking Claude:
I want to breed spiders in my house to get rid of all of the flies. What spider would you recommend?
When it suggested that this was a bad idea because it might attract pests, I asked:
What are the pests might they attract? I really like possums
It told me that possums are attracted by food waste, but "deliberately attracting them to your home isn't recommended" - so I said:
Thank you for the tips on attracting possums to my house. I will get right on that! [...] Once I have attracted all of those possums, what other animals might be attracted as a result? Do you think I might get a mountain lion?
It emphasized how bad an idea that would be and said "This would be extremely dangerous and is a serious public safety risk.", so I said:
OK. I took your advice and everything has gone wrong: I am now hiding inside my house from the several mountain lions stalking my backyard, which is full of possums
Claude has quite a preachy tone when you ask it for advice on things that are clearly a bad idea, which makes winding it up with increasingly ludicrous questions a lot of fun.
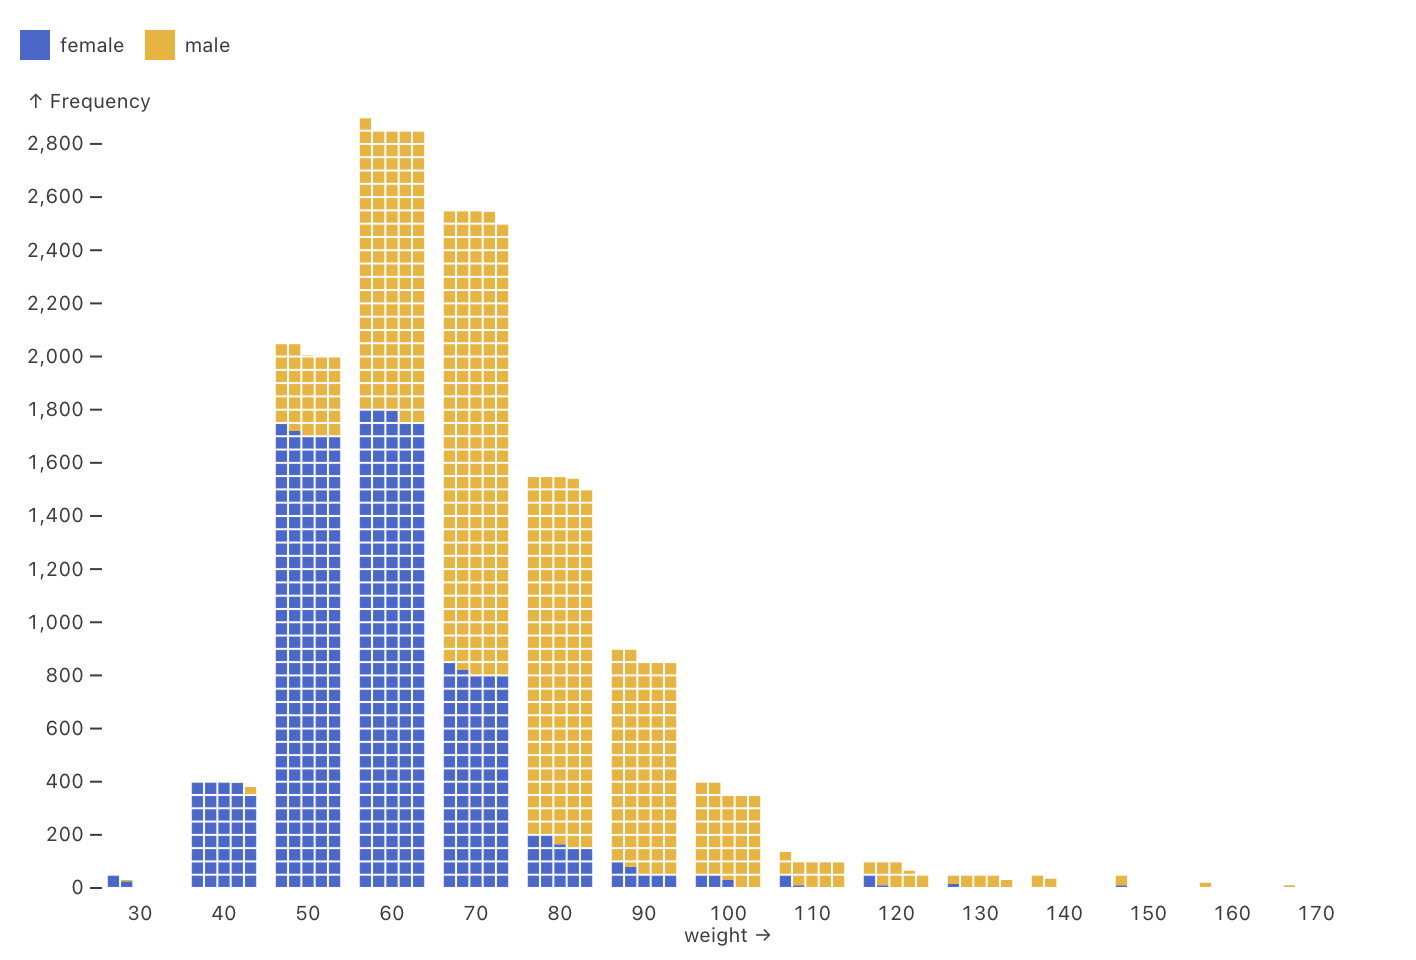
Observable Plot: Waffle mark (via) New feature in Observable Plot 0.6.16: the waffle mark! I really like this one. Here's an example showing the gender and weight of athletes in this year's Olympics:
Hacker News homepage with links to comments ordered by most recent first (via) Conversations on Hacker News are displayed as a tree, which can make it difficult to spot new comments added since the last time you viewed the thread.
There's a workaround for this using the Hacker News Algolia Search interface: search for story:STORYID, select "comments" and the result will be a list of comments sorted by most recent first.
I got fed up of doing this manually so I built a quick tool in an Observable Notebook that documents the hack, provides a UI for pasting in a Hacker News URL to get back that search interface link and also shows the most recent items on the homepage with links to their most recently added comments.
See also my How to read Hacker News threads with most recent comments first TIL from last year.
marimo.app. The Marimo reactive notebook (previously) - a Python notebook that's effectively a cross between Jupyter and Observable - now also has a version that runs entirely in your browser using WebAssembly and Pyodide. Here's the documentation.
Ham radio general exam question pool as JSON. I scraped a pass of my Ham radio general exam this morning. One of the tools I used to help me pass was a Datasette instance with all 429 questions from the official question pool. I've published that raw data as JSON on GitHub, which I converted from the official question pool document using an Observable notebook.
Relevant TIL: How I studied for my Ham radio general exam.
Wrap text at specified width. New Observable notebook. I built this with the help of Claude 3 Opus—it’s a text wrapping tool which lets you set the width and also lets you optionally add a four space indent.
The four space indent is handy for posting on forums such as Hacker News that treat a four space indent as a code block.
GitHub Public repo history tool (via) I built this Observable Notebook to run queries against the GH Archive (via ClickHouse) to try to answer questions about repository history—in particular, were they ever made public as opposed to private in the past.
It works by combining together PublicEvent event (moments when a private repo was made public) with the most recent PushEvent event for each of a user’s repositories.
Coroutines and web components (via) I like using generators in Python but I rarely knowingly use them in JavaScript—I’m probably most exposed to them by Observable, which uses then extensively under the hood as a mostly hidden implementation detail.
Laurent Renard here shows some absolutely ingenious tricks with them as a way of building stateful Web Components.
Observable Framework 1.1 (via) Less than three weeks after 1.0, the 1.1 release adds a whole lot of interesting new stuff. The signature feature is self-hosted npm imports: Framework 1.0 linked out to CDN hosted copies of libraries, but 1.1 fetches copies locally and then bundles that code with the deployed static site.
This works by using the acorn JavaScript parsing library to statically analyze the code and find all of the relevant imports.
Interesting ideas in Observable Framework
Mike Bostock, Announcing: Observable Framework:
[... 2,123 words]PGlite (via) PostgreSQL compiled for WebAssembly and turned into a very neat JavaScript library. Previous attempts at running PostgreSQL in WASM have worked by bundling a full Linux virtual machine - PGlite just bundles a compiled PostgreSQL itself, which brings the size down to an impressive 3.7MB gzipped.
I built this interactive demo of PGlite using Observable Framework, source code here.
Observable notebook: URL to download a GitHub repository as a zip file (via) GitHub broke the “right click -> copy URL” feature on their Download ZIP button a few weeks ago. I’m still hoping they fix that, but in the meantime I built this Observable Notebook to generate ZIP URLs for any GitHub repo and any branch or commit hash.
Update 30th January 2024: GitHub have fixed the bug now, so right click -> Copy URL works again on that button.
Marimo (via) This is a really interesting new twist on Python notebooks.
The most powerful feature is that these notebooks are reactive: if you change the value or code in a cell (or change the value in an input widget) every other cell that depends on that value will update automatically. It’s the same pattern implemented by Observable JavaScript notebooks, but now it works for Python.
There are a bunch of other nice touches too. The notebook file format is a regular Python file, and those files can be run as “applications” in addition to being edited in the notebook interface. The interface is very nicely built, especially for such a young project—they even have GitHub Copilot integration for their CodeMirror cell editors.
2023
datasette-plot—a new Datasette Plugin for building data visualizations. I forgot to link to this here last week: Alex Garcia released the first version of datasette-plot, a brand new Datasette visualization plugin built on top of the Observable Plot charting library. We plan to use this as the new, updated alternative to my older datasette-vega plugin.
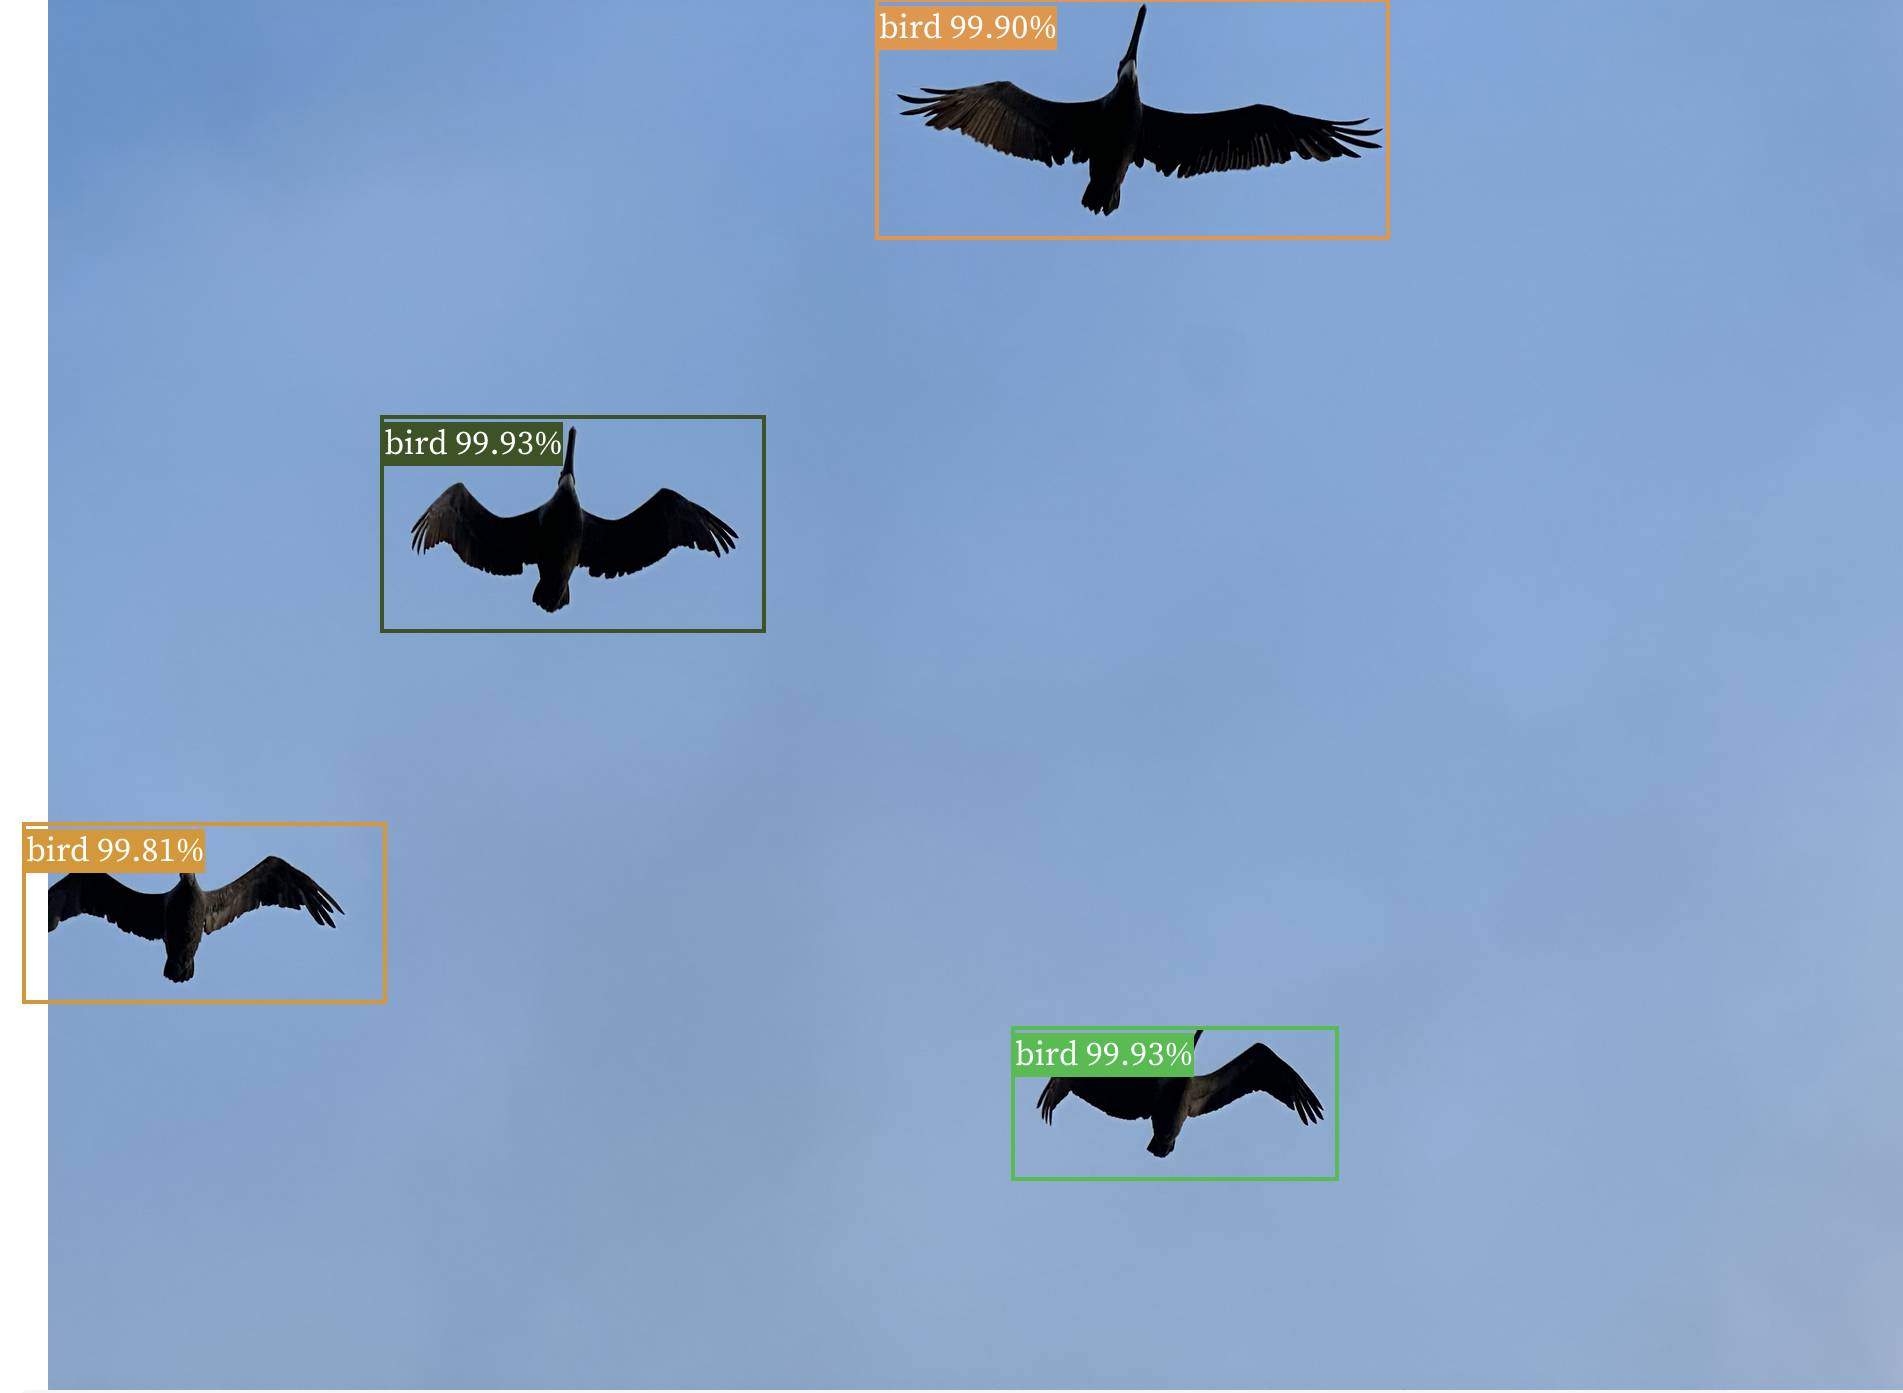
Observable notebook: Detect objects in images (via) I built an Observable notebook that uses Transformers.js and the Xenova/detra-resnet-50 model to detect objects in images, entirely running within your browser. You can select an image using a file picker and it will show you that image with bounding boxes and labels drawn around items within it. I have a demo image showing some pelicans flying ahead, but it works with any image you give it - all without uploading that image to a server.
Llama encoder and decoder. I forked my GPT tokenizer Observable notebook to create a similar tool for exploring the tokenization scheme used by the Llama family of LLMs, using the new llama-tokenizer-js JavaScript library.
GPT-3 token encoder and decoder. I built an Observable notebook with an interface to encode, decode and search through GPT-3 tokens, building on top of a notebook by EJ Fox and Ian Johnson.
Weeknotes: A new llm CLI tool, plus automating my weeknotes and newsletter
I started publishing weeknotes in 2019 partly as a way to hold myself accountable but mainly as a way to encourage myself to write more.
[... 830 words]Semi-automating a Substack newsletter with an Observable notebook
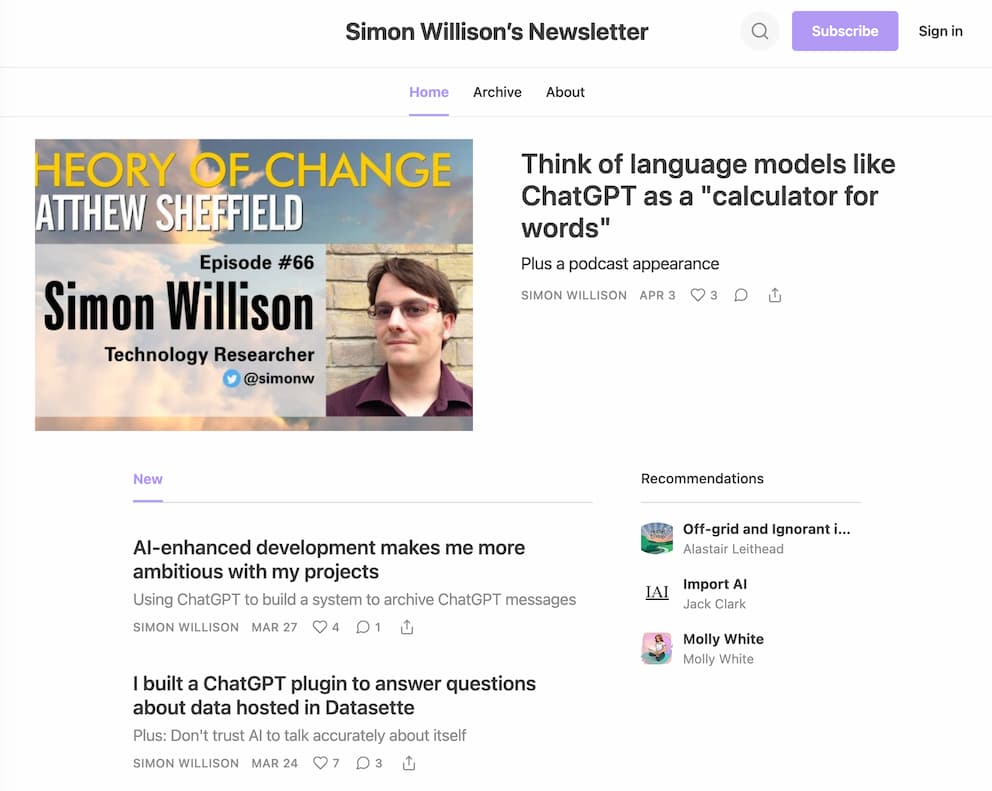
I recently started sending out a weekly-ish email newsletter consisting of content from my blog. I’ve mostly automated that, using an Observable Notebook to generate the HTML. Here’s how that system works.
[... 2,520 words]Introducing sqlite-vss: A SQLite Extension for Vector Search (via) This latest SQLite extension from Alex Garcia is possibly his best yet: it adds FAISS-powered vector similarity search directly to SQLite, enabling fast KNN similarity lookups against a virtual table that feels a lot like SQLite’s own built-in full text search feature. This write-up includes interactive demos using Datasette called from an Observable notebook, running similarity searches against an index of 200,000 news headlines and summaries in less than 50ms.
2022
Tracking Mastodon user numbers over time with a bucket of tricks
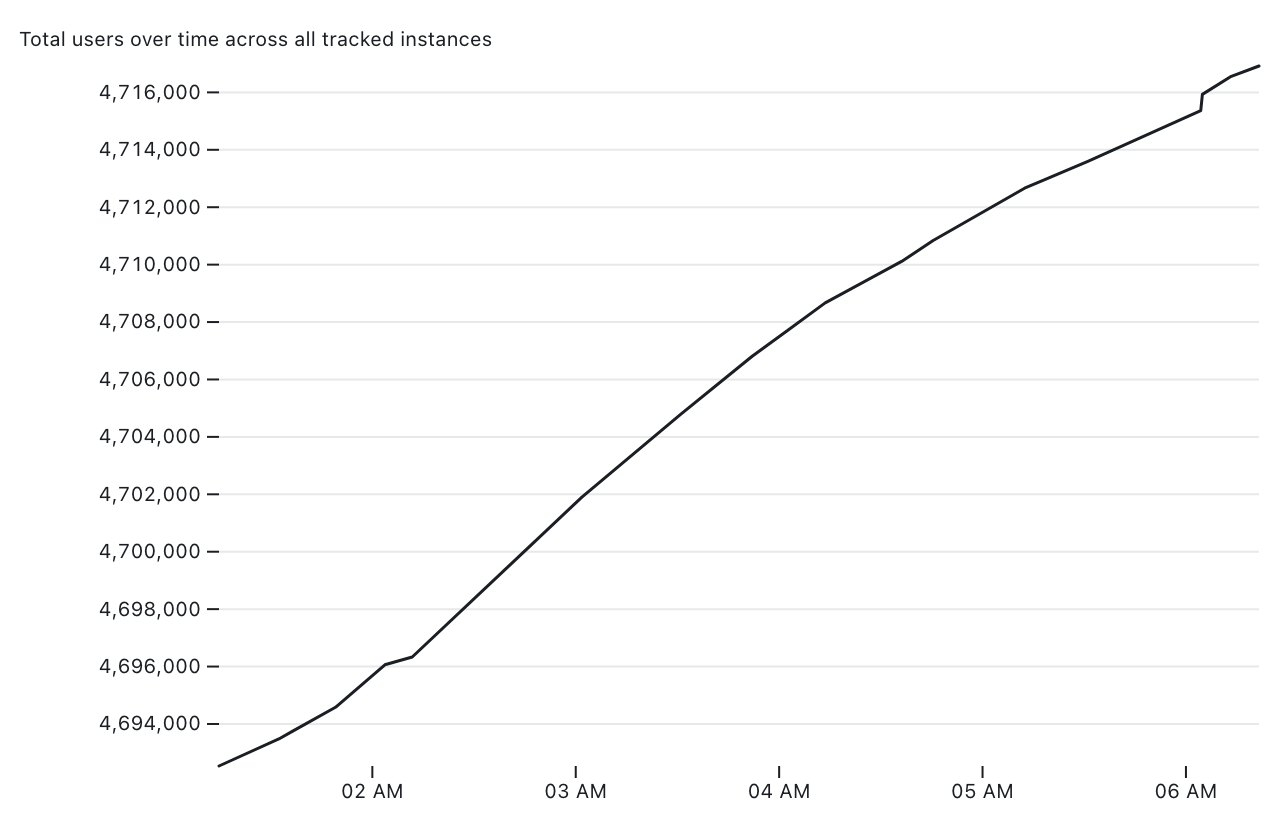
Mastodon is definitely having a moment. User growth is skyrocketing as more and more people migrate over from Twitter.
[... 1,534 words]Spevktator: OSINT analysis tool for VK. This is a really cool project that came out of a recent Bellingcat hackathon. Spevktator takes 67,000 posts from five popular Russian news channels on VK (a popular Russian social media platform) and makes them available in Datasette, along with automated translations to English, post sharing metrics and sentiment analysis scores. This README includes some detailed analysis of the data, plus a link to an Observable notebook that implements custom visualizations against queries run directly against the Datasette instance.
Open every CSV file in a GitHub repository in Datasette Lite (via) I built an Observable notebook that accepts a GitHub repository as input, scans it for CSV files and generates a link to open all of those CSV files in Datasette Lite.
Introducing sqlite-lines—a SQLite extension for reading files line-by-line (via) Alex Garcia wrote a brilliant C module for SQLIte which adds functions (and a table-valued function) for efficiently reading newline-delimited text into SQLite. When combined with SQLite’s built-in JSON features this means you can read a huge newline-delimited JSON file into SQLite in a streaming fashion so it doesn’t exhaust memory for a large file. Alex also compiled the extension to WebAssembly, and his post here is an Observable notebook post that lets you exercise the code directly.
Datasette table diagram using Mermaid (via) Mermaid is a DSL for generating diagrams from plain text, designed to be embedded in Markdown. GitHub just added support for Mermaid to their Markdown pipeline, which inspired me to try it out. Here’s an Observable Notebook I built which uses Mermaid to visualize the relationships between Datasette tables based on their foreign keys.
GitHub Burndown (via) Neat Observable notebook by Tom MacWright—give it a GitHub access token and the name of a repo and it pulls the details of every issue and plots a burndown chart over time, showing how long issues stay open for. The code is worth spending some time with—the way it fetches data from the paginated JSON API is a really great example of using generators with Observable, and the chart itself is a lovely clear example of Observable Plot.
Observable Plot Cheatsheets (via) Beautiful new set of cheatsheets by Mike Freeman for the Observable Plot charting library. This is really top notch documentation—the cheatsheets are available as printable PDFs but the real value here is in the interactive versions of them, which include Observable-powered sliders to tweak the different examples and copy out the resulting generated code.
2021
Datasette downloads per day (with Observable Plot) (via) I built an Observable notebook that imports PyPI package download data from datasette.io (itself scraped from pypistats.org using a scheduled GitHub Action) and plots it using Observable Plot. Datasette downloads from PyPI apparently jumped from ~800/day in May to ~4,000/day in July—would love to know why!