50 posts tagged “observable”
2021
Plot & Vega-Lite. Useful documentation comparing the brand new Observable Plot to Vega-Lite, complete with examples of how to achieve the same thing in both libraries.
Observable Plot (via) This is huge: a brand new high-level JavaScript visualization library from Mike Bostock, the author of D3—partially inspired by Vega-Lite which I’ve used enthusiastically in the past. First impressions are that this is a big step forward for quickly building high-quality visualizations. It’s released under the ISC license which is “functionally equivalent to the BSD 2-Clause and MIT licenses”.
Render single selected county on a map (via) Another experiment at the intersection of Datasette and Observable notebooks. This one imports a full Datasette table (3,200 US counties) using streaming CSV and loads that into Observable’s new Search and Table filter widgets. Once you select a single county a second Datasette SQL query (this time retuning JSON) fetches a GeoJSON representation of that county which is then rendered as SVG using D3.
Animated choropleth of vaccinations by US county
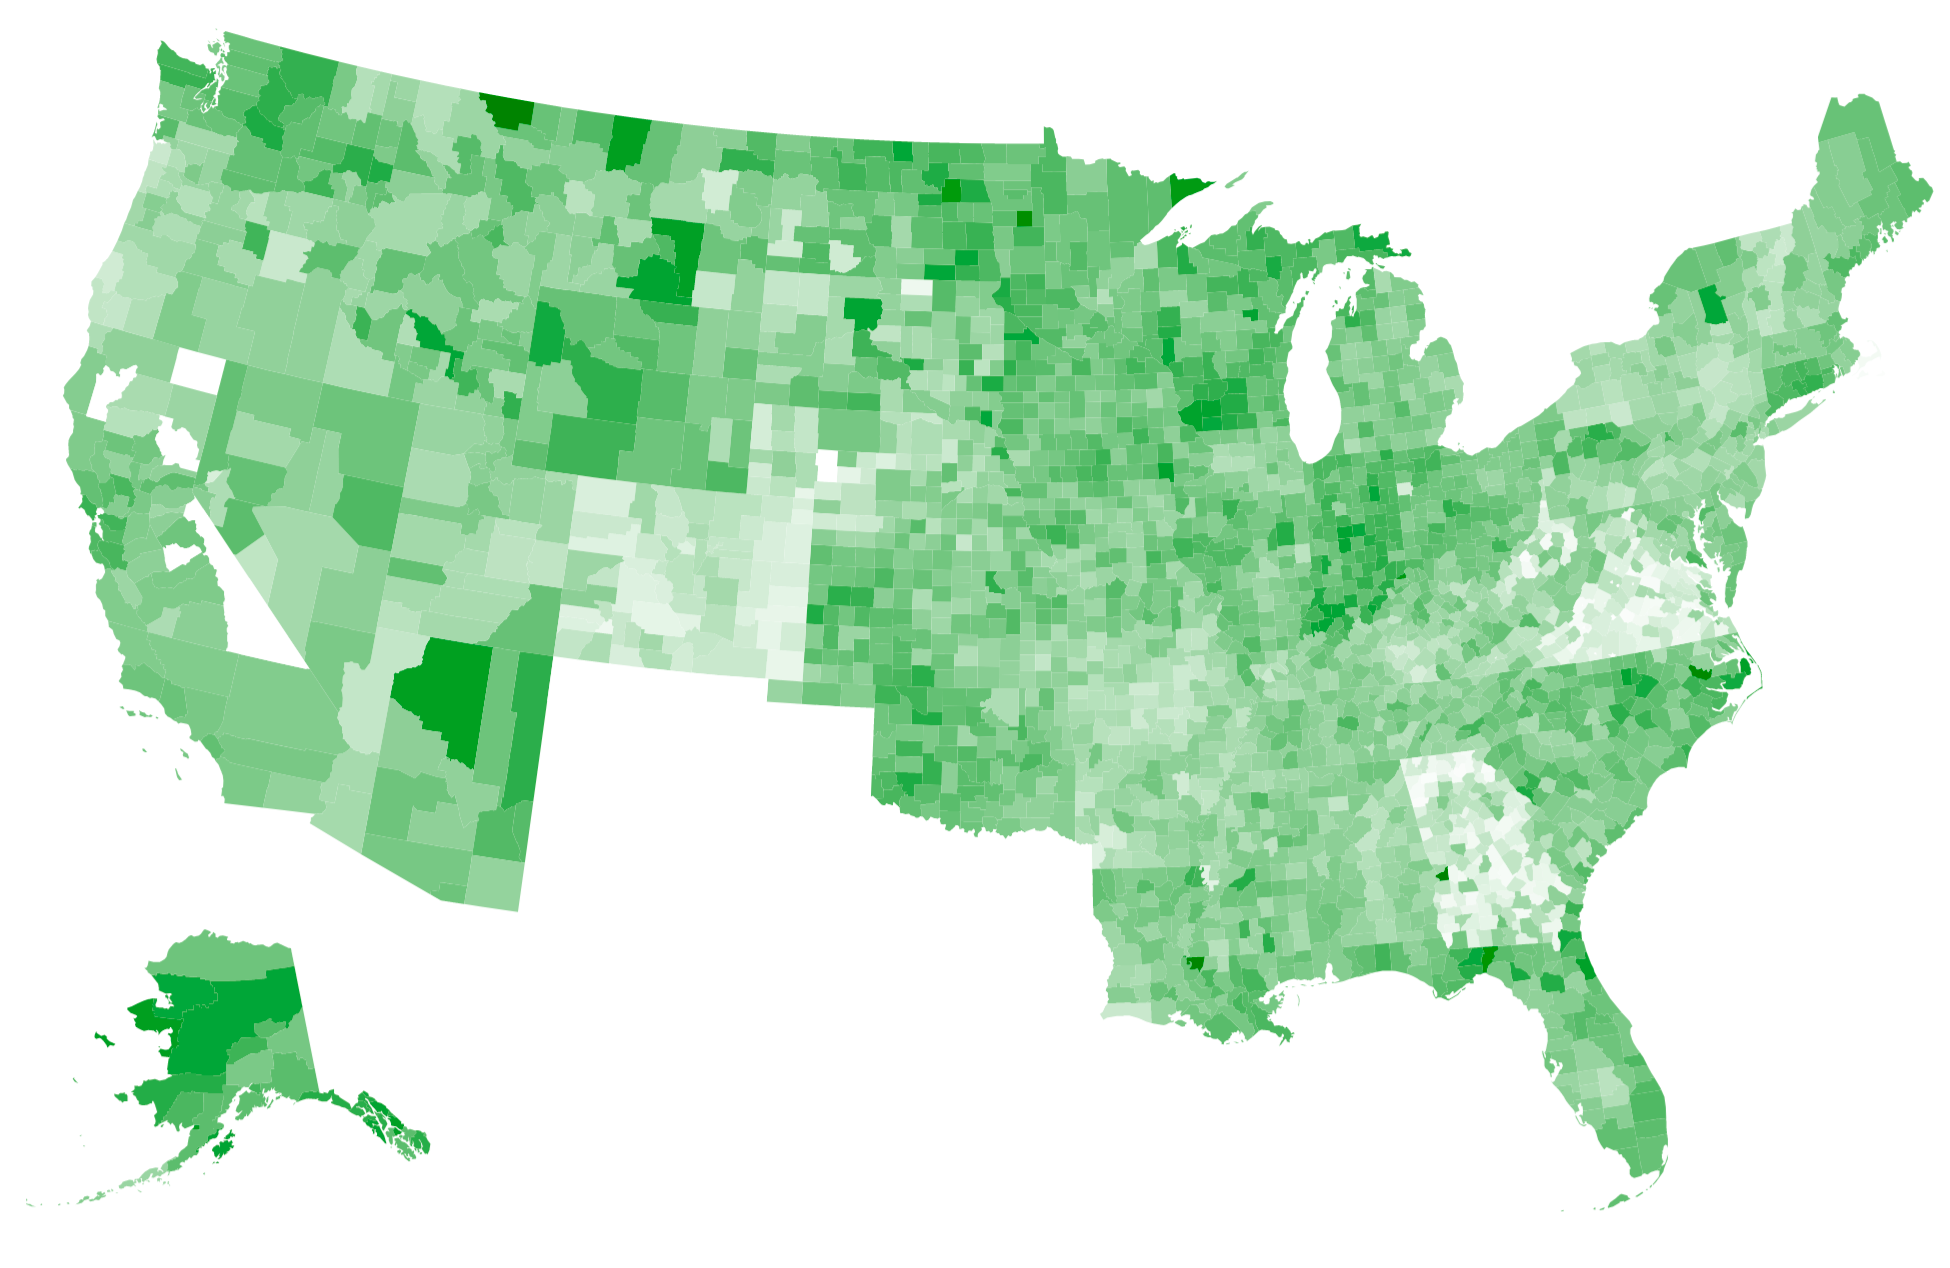
Last week I mentioned that I’ve recently started scraping and storing the CDC’s per-county vaccination numbers in my cdc-vaccination-history GitHub repository. This week I used an Observable notebook and d3’s TopoJSON support to render those numbers on an animated choropleth map.
[... 1,138 words]2020
Datasette Client for Observable (via) Really elegant piece of code design from Alex Garcia: DatasetteClient is a client library he built designed to work in Observable notebooks, which uses JavaScript tagged template literals to allow SQL query results to be executed against a Datasette instance and displayed as inline tables in a notebook, or used to return JSON data for further processing. His example notebook includes a neat d3 stacked area chart example built against a Datasette of congresspeople, plus examples using interactive widgets to update the Notebook.
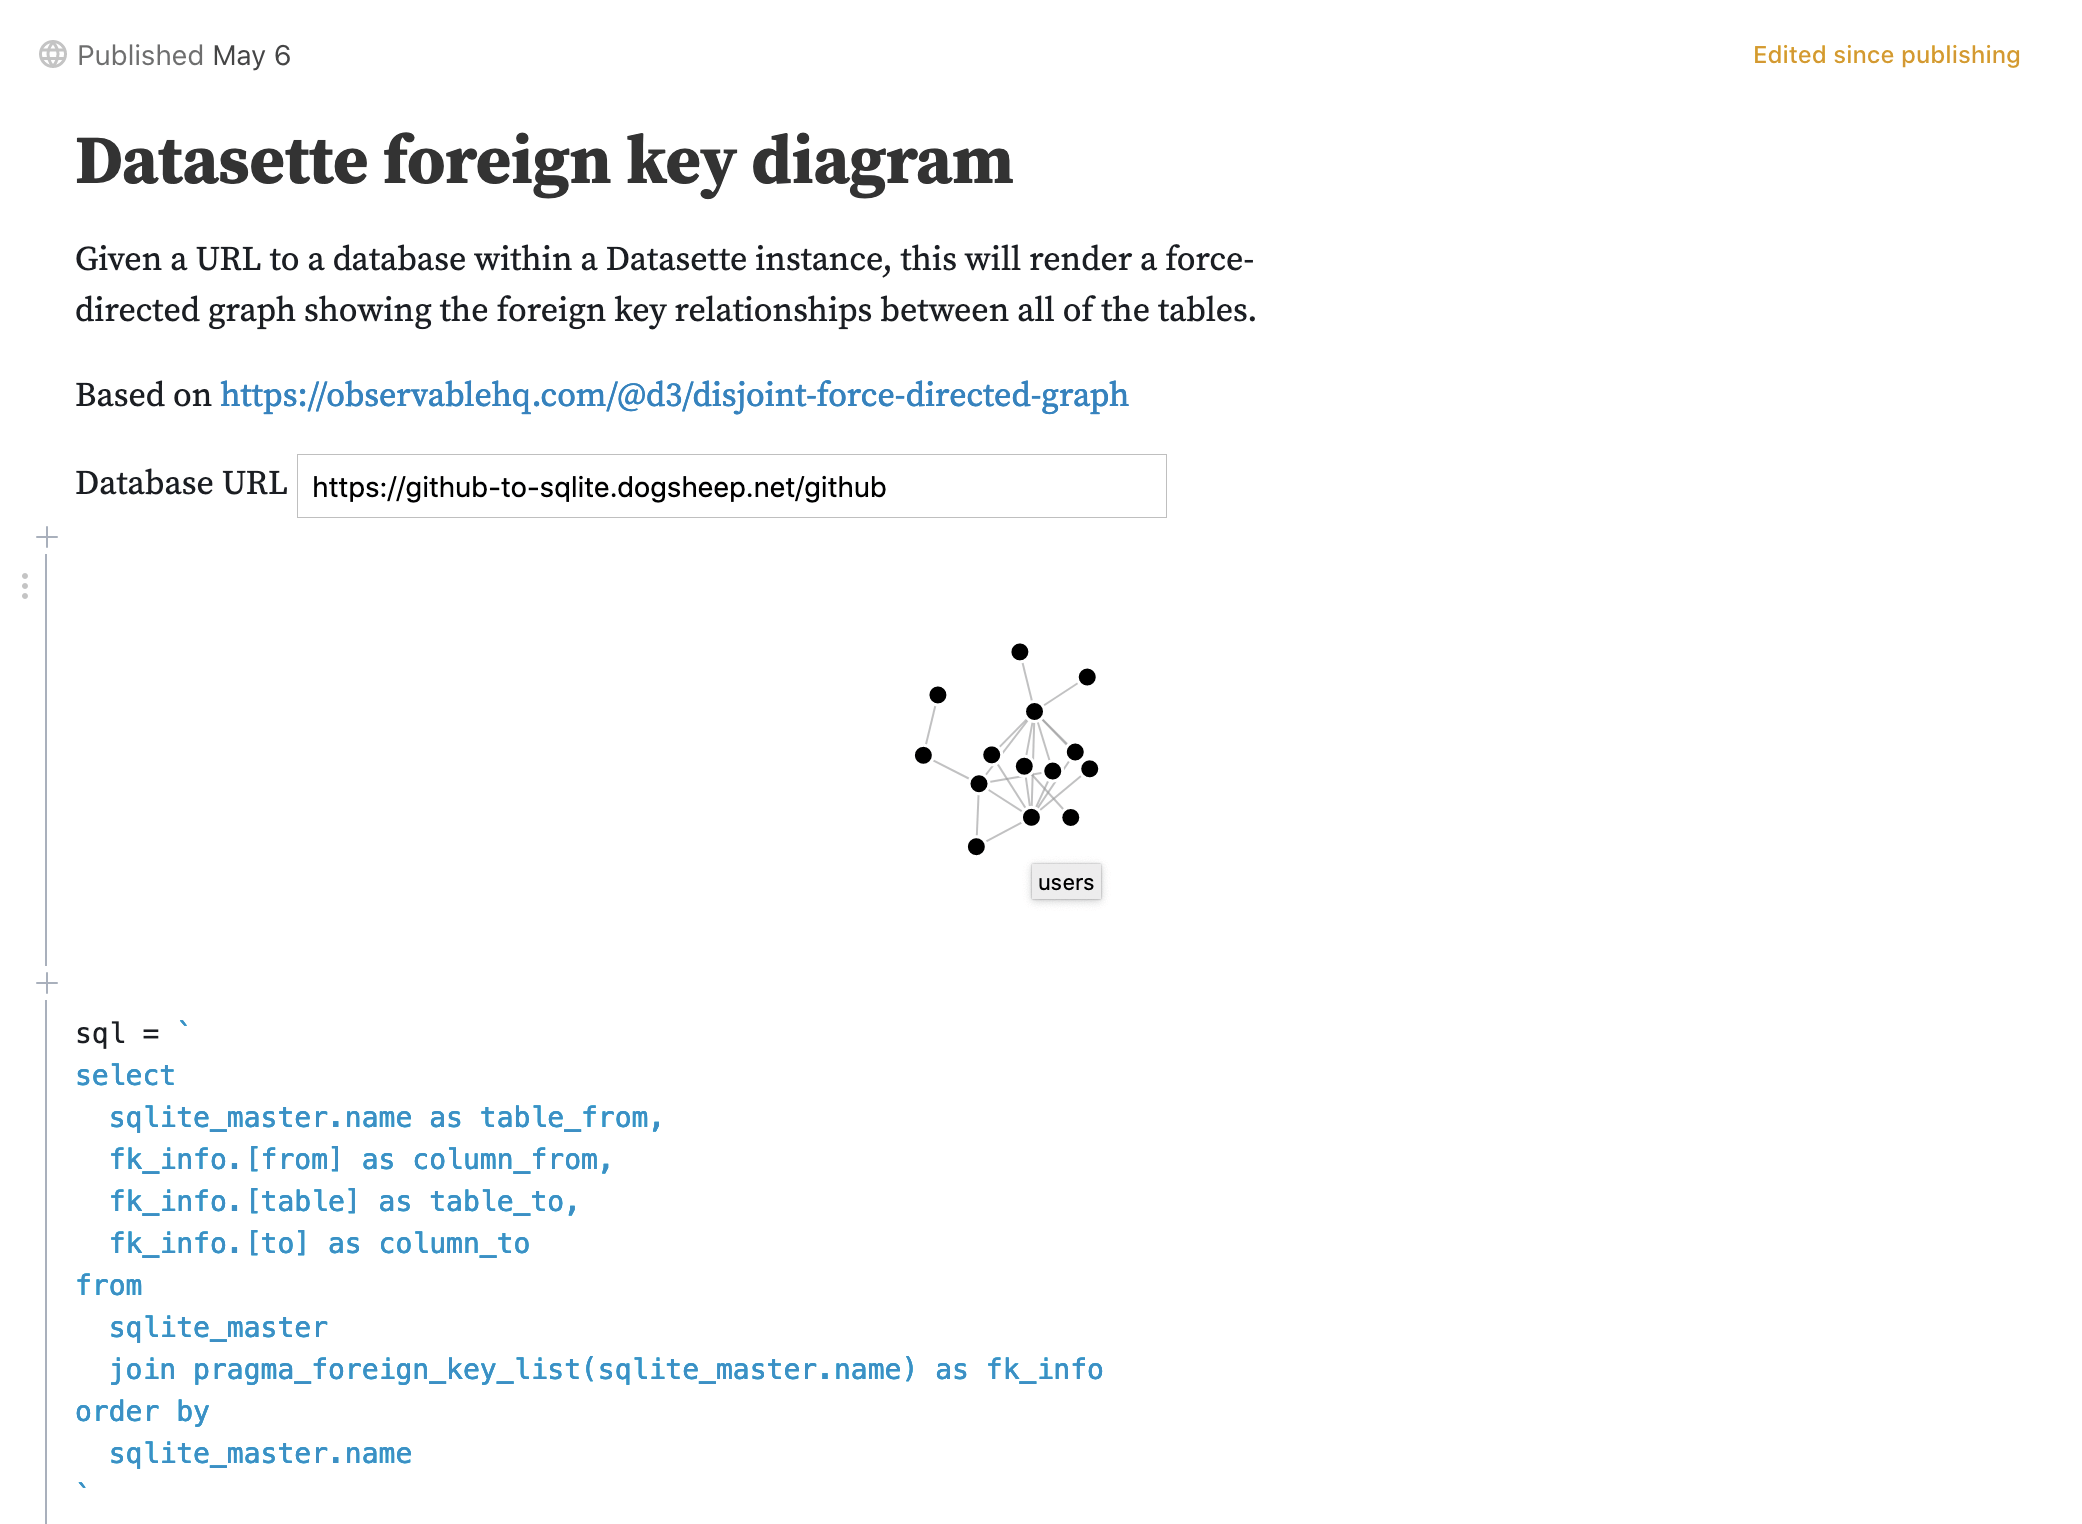
Datasette table diagram, now with a DOT graph (via) Thomas Ballinger shared a huge improvement to my Observable notebook for rendering a diagram of a collection of Datasette tables. He showed how to use the DOT language to render a full schema digram with arrows joining together the different tables. I’ve applied his changes to my notebook.
Weeknotes: Datasette 0.41, photos breakthroughs
Shorter weeknotes this week, because my main project for the week warrants a detailed write-up on its own (coming soon... update 21st May here it is).
[... 867 words]2019
D3 Projection Comparison (via) Fun Observable notebook that lets you compare any two out of D3’s 96 (!) geographical projections of the world.
2018
Develop Your Naturalist Superpowers with Observable Notebooks and iNaturalist (via) Natalie’s article for this year’s 24 ways advent calendar shows how you can use Observable notebooks to quickly build interactive visualizations against web APIs. She uses the iNaturalist API to show species of Nudibranchs that you might see in a given month, plus a Vega-powered graph of sightings over the course of the year. This really inspired me to think harder about how I can use Observable to solve some of my API debugging needs, and I’ve already spun up a couple of private Notebooks to exercise new APIs that I’m building at work. It’s a huge productivity boost.
I don’t like Jupyter Notebooks—a presentation by Joel Grus (via) Fascinating talk by Joel Grus at the Jupyter conference in New York. He highlights some of the drawbacks of he Jupyter way of working, including the huge confusion that can come from the ability to execute cells out of order (something Observable notebooks solve brilliantly using spreadsheet-style reactive cell associations). He also makes strong arguments that notebooks encourage a way of working that discourages people from producing stable, repeatable and well tested code.
Observable Tutorial 2: Dog pictures (via) Observable have a neat new set of tutorials on how to get started with their reactive notebooks. You don’t even need to sign up for the service: they have a “Scratchpad” link in their navigation bar now which lets you spin up a test notebook with one click.
Notebook: How to build a Teachable Machine with TensorFlow.js (via) This is a really cool Observable notebook. It explains how to build image classification that runs in the browser on top of Tensorflow.js, and includes interactive demos that hook into your webcam and let you hold up items and use them to train a classifier. Since it’s built on Observable every single underlying line of source code is available to browse as part of the essay.
Changelog 2018-06-12 / Observable. The ability to download an Observable notebook as a stand-alone ES module and run it anywhere using their open source runtime is fascinating, but it’s also worth reading the changelog for some of the new clever tricks they are pulling using await—“await visibility();” in a notebook cell will cause execution to pause until the cell scrolls into view for example.
Observable: Downloading and Embedding Notebooks (via) Big news from the Observable team: firstly, they’ve released the open source runtime for their notebooks which means you can now execute the code from a notebook independently of their hosted service. On top of that they’ve constructed an elegant way of exporting and executing notebooks (or specific notebook cells) as ES6 modules and as installable npm package tarballs.
Iodide Notebook: Project Examples (via) Iodide is a very promising looking open source JavaScript notebook project, and these examples do a great job of showing what it can do. It’s not as slick (yet) as Observable but it does run completely independently using just a browser.
What do you mean “average”? (via) Lovely example of an interactive explorable demonstrating mode/mean/median, built as an Observable notebook using D3.
Observable notebook: San Francisco trees from Datasette. I used an Observable notebook to rebuild my San Francisco tree search demo against a Datasette API of a CSV of trees published by the SF Department of Public Works. The map updates live as you type a query, and every cell can be toggled to view the underlying source code.
USGS World Earthquake Map (observable notebook). Here’s an extended version of the notebook constructed by Jeremy Ashkenas in that Observable YouTube demo. You really need to check this thing out—the notebook itself has sliders in that you can manipulate (even on a mobile browser) or you can click to edit the code and see your changes reflected in real-time. If you sign in with GitHub you can fork the project to your own account and save your changes.
Observable: An Earthquake Globe in Ten Minutes. Well worth your time. Jeremy Ashkenas uses Observable to live-code an interactive visualization of recent earthquakes around the world, using USGS data (fetched as JSON), d3, topoJSON and an Observable notebook. I’m sold—this is truly ground-breaking new technology.
Observable Beta (via) Observable just released their beta, and it’s quite something. It’s by Mike Bostock (d3), Jeremy Ashkenas (Backbone, CoffeeScript) and Tom MacWright (Mapbox Studio). The easiest way to describe it is Jupyter notebooks for JavaScript supporting reactive programming—so code is evaluated as you type and you can add interactive widgets (like sliders and canvas views) to construct explorable visualizations on the fly.