30 posts tagged “explorables”
2026
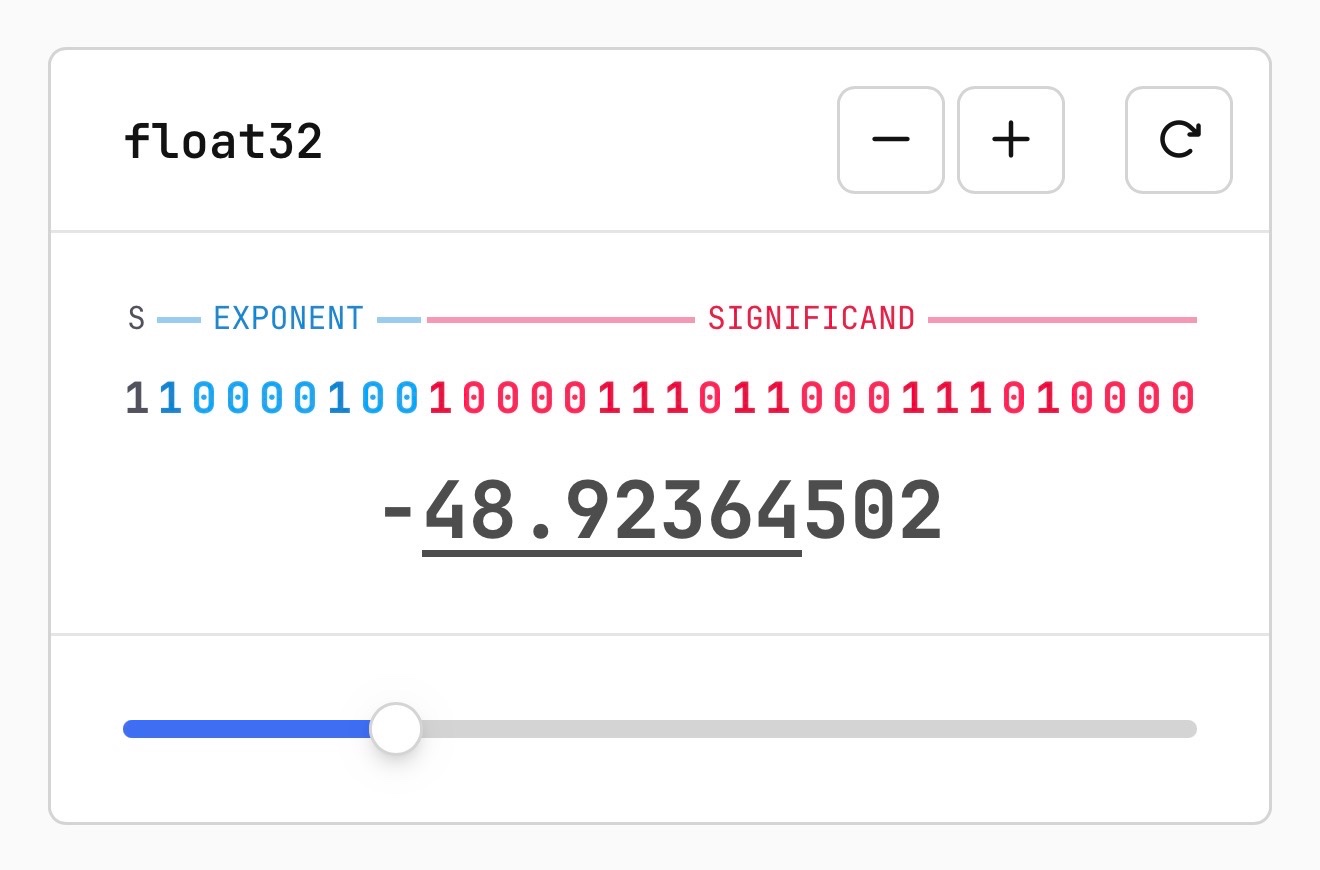
Quantization from the ground up. Sam Rose continues his streak of publishing spectacularly informative interactive essays, this time explaining how quantization of Large Language Models works (which he says might be "the best post I've ever made".)
Also included is the best visual explanation I've ever seen of how floating point numbers are represented using binary digits.
I hadn't heard about outlier values in quantization - rare float values that exist outside of the normal tiny-value distribution - but apparently they're very important:
Why do these outliers exist? [...] tl;dr: no one conclusively knows, but a small fraction of these outliers are very important to model quality. Removing even a single "super weight," as Apple calls them, can cause the model to output complete gibberish.
Given their importance, real-world quantization schemes sometimes do extra work to preserve these outliers. They might do this by not quantizing them at all, or by saving their location and value into a separate table, then removing them so that their block isn't destroyed.
Plus there's a section on How much does quantization affect model accuracy?. Sam explains the concepts of perplexity and ** KL divergence ** and then uses the llama.cpp perplexity tool and a run of the GPQA benchmark to show how different quantization levels affect Qwen 3.5 9B.
His conclusion:
It looks like 16-bit to 8-bit carries almost no quality penalty. 16-bit to 4-bit is more noticeable, but it's certainly not a quarter as good as the original. Closer to 90%, depending on how you want to measure it.
Sorting algorithms. Today in animated explanations built using Claude: I've always been a fan of animated demonstrations of sorting algorithms so I decided to spin some up on my phone using Claude Artifacts, then added Python's timsort algorithm, then a feature to run them all at once. Here's the full sequence of prompts:
Interactive animated demos of the most common sorting algorithms
This gave me bubble sort, selection sort, insertion sort, merge sort, quick sort, and heap sort.
Add timsort, look up details in a clone of python/cpython from GitHub
Let's add Python's Timsort! Regular Claude chat can clone repos from GitHub these days. In the transcript you can see it clone the repo and then consult Objects/listsort.txt and Objects/listobject.c. (I should note that when I asked GPT-5.4 Thinking to review Claude's implementation it picked holes in it and said the code "is a simplified, Timsort-inspired adaptive mergesort".)
I don't like the dark color scheme on the buttons, do better
Also add a "run all" button which shows smaller animated charts for every algorithm at once in a grid and runs them all at the same time
It came up with a color scheme I liked better, "do better" is a fun prompt, and now the "Run all" button produces this effect:
Interactive explanations
When we lose track of how code written by our agents works we take on cognitive debt.
For a lot of things this doesn't matter: if the code fetches some data from a database and outputs it as JSON the implementation details are likely simple enough that we don't need to care. We can try out the new feature and make a very solid guess at how it works, then glance over the code to be sure.
Often though the details really do matter. If the core of our application becomes a black box that we don't fully understand we can no longer confidently reason about it, which makes planning new features harder and eventually slows our progress in the same way that accumulated technical debt does. [... 672 words]
2025
Sam Rose explains how LLMs work with a visual essay. Sam Rose is one of my favorite authors of explorable interactive explanations - here's his previous collection.
Sam joined ngrok in September as a developer educator. Here's his first big visual explainer for them, ostensibly about how prompt caching works but it quickly expands to cover tokenization, embeddings, and the basics of the transformer architecture.
The result is one of the clearest and most accessible introductions to LLM internals I've seen anywhere.
A Friendly Introduction to SVG (via) This SVG tutorial by Josh Comeau is fantastic. It's filled with neat interactive illustrations - with a pleasing subtly "click" audio effect as you adjust their sliders - and provides a useful introduction to a bunch of well chosen SVG fundamentals.
I finally understand what all four numbers in the viewport="..." attribute are for!
Reservoir Sampling (via) Yet another outstanding interactive essay by Sam Rose (previously), this time explaining how reservoir sampling can be used to select a "fair" random sample when you don't know how many options there are and don't want to accumulate them before making a selection.
Reservoir sampling is one of my favourite algorithms, and I've been wanting to write about it for years now. It allows you to solve a problem that at first seems impossible, in a way that is both elegant and efficient.
I appreciate that Sam starts the article with "No math notation, I promise." Lots of delightful widgets to interact with here, all of which help build an intuitive understanding of the underlying algorithm.
Sam shows how this algorithm can be applied to the real-world problem of sampling log files when incoming logs threaten to overwhelm a log aggregator.
The dog illustration is commissioned art and the MIT-licensed code is available on GitHub.
2024
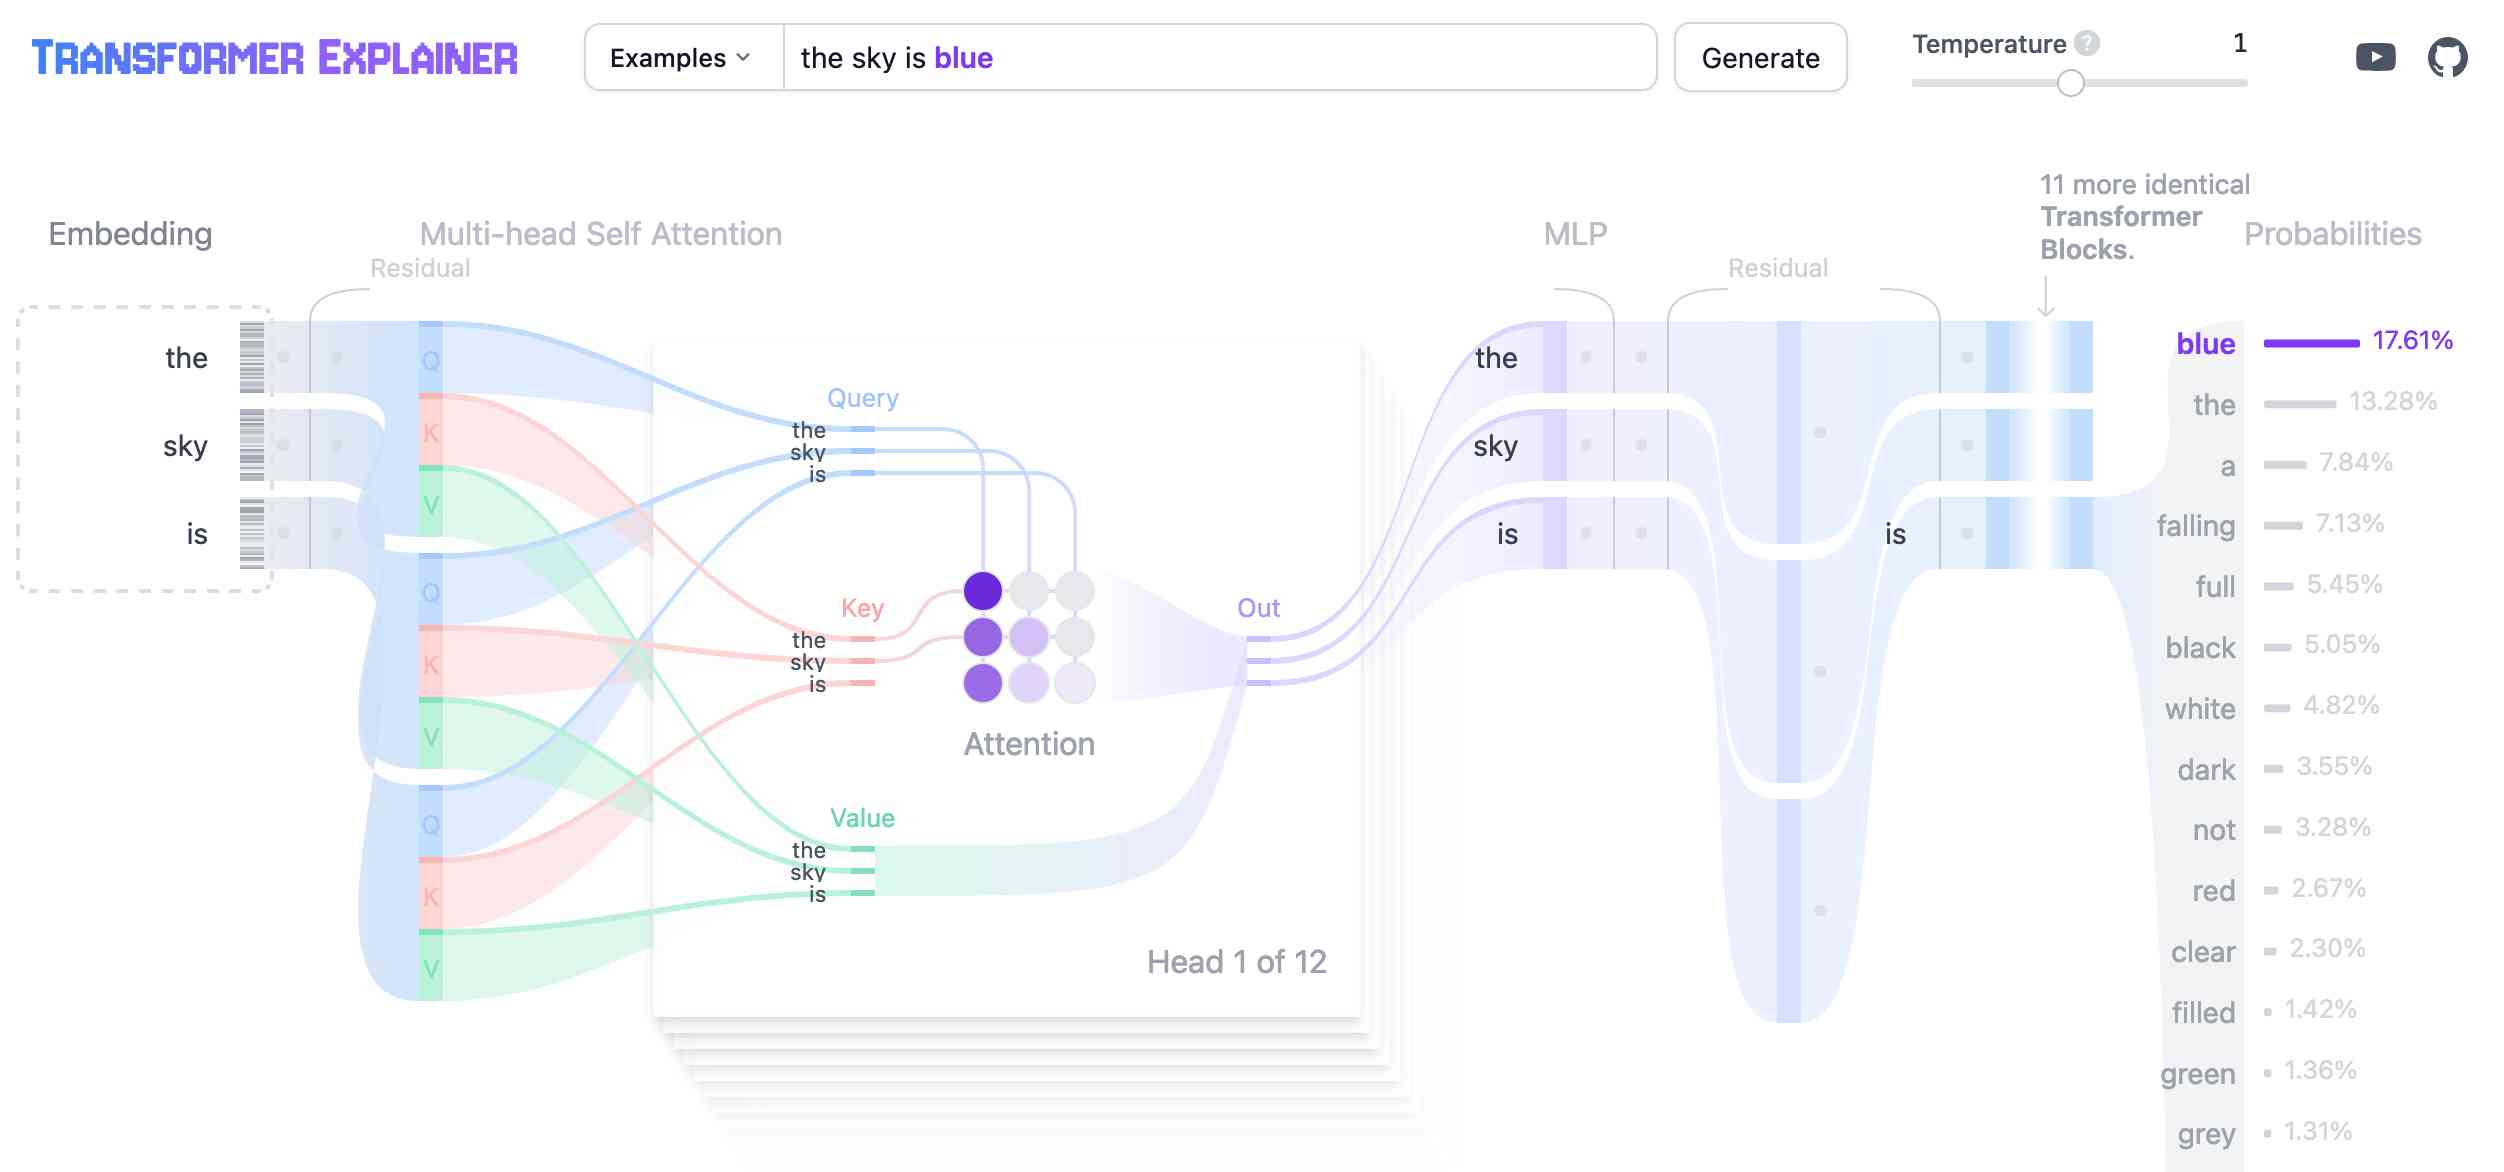
Transformer Explainer. This is a very neat interactive visualization (with accompanying essay and video - scroll down for those) that explains the Transformer architecture for LLMs, using a GPT-2 model running directly in the browser using the ONNX runtime and Andrej Karpathy's nanoGPT project.
Load Balancing. Sam Rose built this interactive essay explaining how different load balancing strategies work. It's part of a series that includes memory allocation, bloom filters and more.
An animated introduction to Fourier Series (via) Outstanding essay and collection of animated explanations (created using p5.js) by Andrei Ciobanu explaining Fourier transforms, starting with circles, pi, radians and building up from there.
I found Fourier stuff only really clicked for me when it was accompanied by clear animated visuals, and these are a beautiful example of those done really well.
CRDT: Text Buffer (via) Delightfully short and clear explanation of the CRDT approach to collaborative text editing by Evan Wallace (of Figma and esbuild fame), including a neat interactive demonstration of how the algorithm works even when the network connection between peers is temporarily paused.
Bloom Filters, explained by Sam Rose. Beautifully designed explanation of bloom filters, complete with interactive demos that illustrate exactly how they work.
Okay, Color Spaces (via) Fantastic interactive explanation of how color spaces work by Eric Portis.
2023
LLM Visualization. Brendan Bycroft’s beautifully crafted interactive explanation of the transformers architecture—that universal but confusing model diagram, only here you can step through and see a representation of the flurry of matrix algebra that occurs every time you get a Large Language Model to generate the next token.
An Interactive Intro to CRDTs (via) Superb interactive essay by Jake Lazaroff, providing a very clear explanation of how the fundamental mechanisms behind CRDTs (Conflict-free Replicated Data Types) work. The interactive explanatory demos are very neatly designed and a lot of fun to play with.
See this page fetch itself, byte by byte, over TLS (via) George MacKerron built a TLS 1.3 library in TypeScript and used it to construct this amazing educational demo, which performs a full HTTPS request for its own source code over a WebSocket and displays an annotated byte-by-byte representation of the entire exchange. This is the most useful illustration of how HTTPS actually works that I’ve ever seen.
Language models can explain neurons in language models (via) Fascinating interactive paper by OpenAI, describing how they used GPT-4 to analyze the concepts tracked by individual neurons in their much older GPT-2 model. “We generated cluster labels by embedding each neuron explanation using the OpenAI Embeddings API, then clustering them and asking GPT-4 to label each cluster.”
2022
Draw SVG rope using JavaScript (via) Delightful interactive tutorial by Stanko Tadić showing how to render an illustration of a rope using SVG, starting with a path. The way the tutorial is presented is outstanding.
Sha256 Algorithm Explained (via) Absolutely beautiful interactive animated explanation by Domingo Martin of the SHA256 hashing algorithm.
2020
Cameras and Lenses (via) Fabulous explotable interactive essay by Bartosz Ciechanowski explaining how cameras and lenses work.
A visual introduction to machine learning. Beautiful interactive essay explaining how a decision tree machine learning module is constructed, and using that to illustrate the concept of overfitting. This is one of the best explanations of machine learning fundamentals I’ve seen anywhere.
2019
An Interactive Introduction to Fourier Transforms (via) I love interactive exploitable explanations and this is the best I’ve seen in a while: Jez Swanson breaks down exactly what a Fourier transform does, first by letting you interactively draw and deconstruct wave patterns and then by showing Epicycles andcexplsining JPEG compression. All with not a formula in sight!
2018
Notebook: How to build a Teachable Machine with TensorFlow.js (via) This is a really cool Observable notebook. It explains how to build image classification that runs in the browser on top of Tensorflow.js, and includes interactive demos that hook into your webcam and let you hold up items and use them to train a classifier. Since it’s built on Observable every single underlying line of source code is available to browse as part of the essay.
What do you mean “average”? (via) Lovely example of an interactive explorable demonstrating mode/mean/median, built as an Observable notebook using D3.
USGS World Earthquake Map (observable notebook). Here’s an extended version of the notebook constructed by Jeremy Ashkenas in that Observable YouTube demo. You really need to check this thing out—the notebook itself has sliders in that you can manipulate (even on a mobile browser) or you can click to edit the code and see your changes reflected in real-time. If you sign in with GitHub you can fork the project to your own account and save your changes.
Observable: An Earthquake Globe in Ten Minutes. Well worth your time. Jeremy Ashkenas uses Observable to live-code an interactive visualization of recent earthquakes around the world, using USGS data (fetched as JSON), d3, topoJSON and an Observable notebook. I’m sold—this is truly ground-breaking new technology.
2017
JOY.js (via) Delightful new exploratory programming environment from Nicky Case. Try the Turtle demo, which takes Logo and updates it for the modern web.
Pink Trombone (via) Explorable explanation of the human vocal system by Neil Thapen. View source for some pleasantly readable JavaScript / canvas / window.AudioContext code.
Feature Visualization (via) Another gorgeous paper published on Distill, the journal that prides itself on including interactive visualizations to help provide clear explanations of machine learning.
An interactive explanation of quadtrees (via) Neat explorable explanation of quadtrees, using interactives built on top of D3.
Explorable Explanations. I’m fascinated by web articles and essays that embed interactive visualizations—taking advantage of the unique capabilities of the medium to help explain complex concepts. Explorable Explanations collects exactly these, under the banner of “learning through play”. They also gather tools and tutorials to help build more of them.