12 posts tagged “d3”
2024
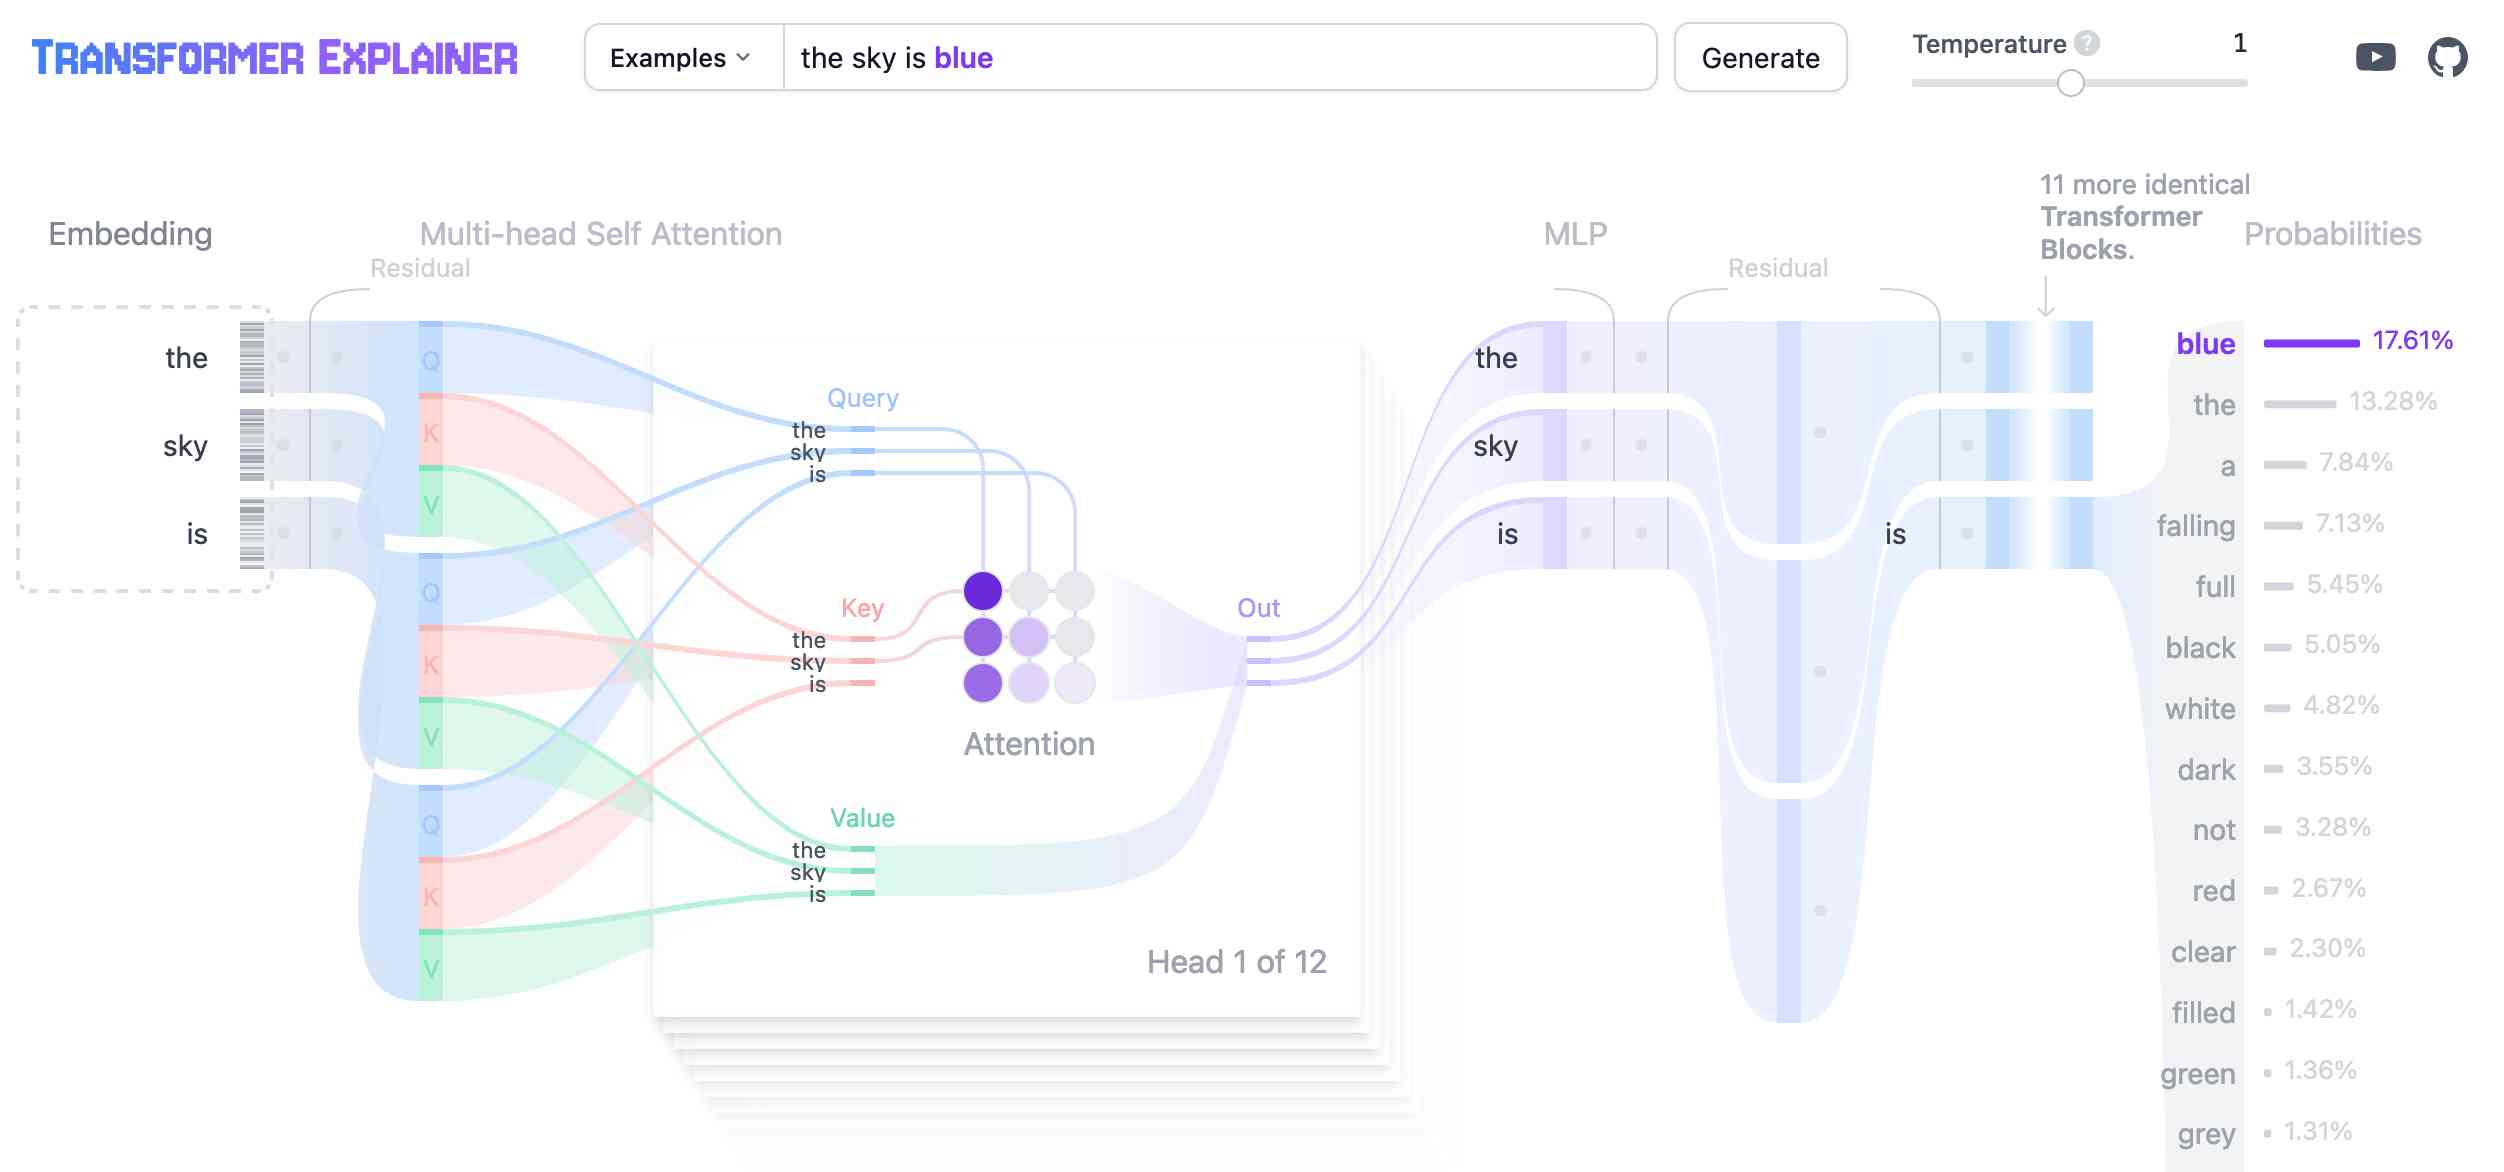
Transformer Explainer. This is a very neat interactive visualization (with accompanying essay and video - scroll down for those) that explains the Transformer architecture for LLMs, using a GPT-2 model running directly in the browser using the ONNX runtime and Andrej Karpathy's nanoGPT project.
Interesting ideas in Observable Framework
Mike Bostock, Announcing: Observable Framework:
[... 2,123 words]2021
Plot & Vega-Lite. Useful documentation comparing the brand new Observable Plot to Vega-Lite, complete with examples of how to achieve the same thing in both libraries.
Observable Plot (via) This is huge: a brand new high-level JavaScript visualization library from Mike Bostock, the author of D3—partially inspired by Vega-Lite which I’ve used enthusiastically in the past. First impressions are that this is a big step forward for quickly building high-quality visualizations. It’s released under the ISC license which is “functionally equivalent to the BSD 2-Clause and MIT licenses”.
Render single selected county on a map (via) Another experiment at the intersection of Datasette and Observable notebooks. This one imports a full Datasette table (3,200 US counties) using streaming CSV and loads that into Observable’s new Search and Table filter widgets. Once you select a single county a second Datasette SQL query (this time retuning JSON) fetches a GeoJSON representation of that county which is then rendered as SVG using D3.
Animated choropleth of vaccinations by US county
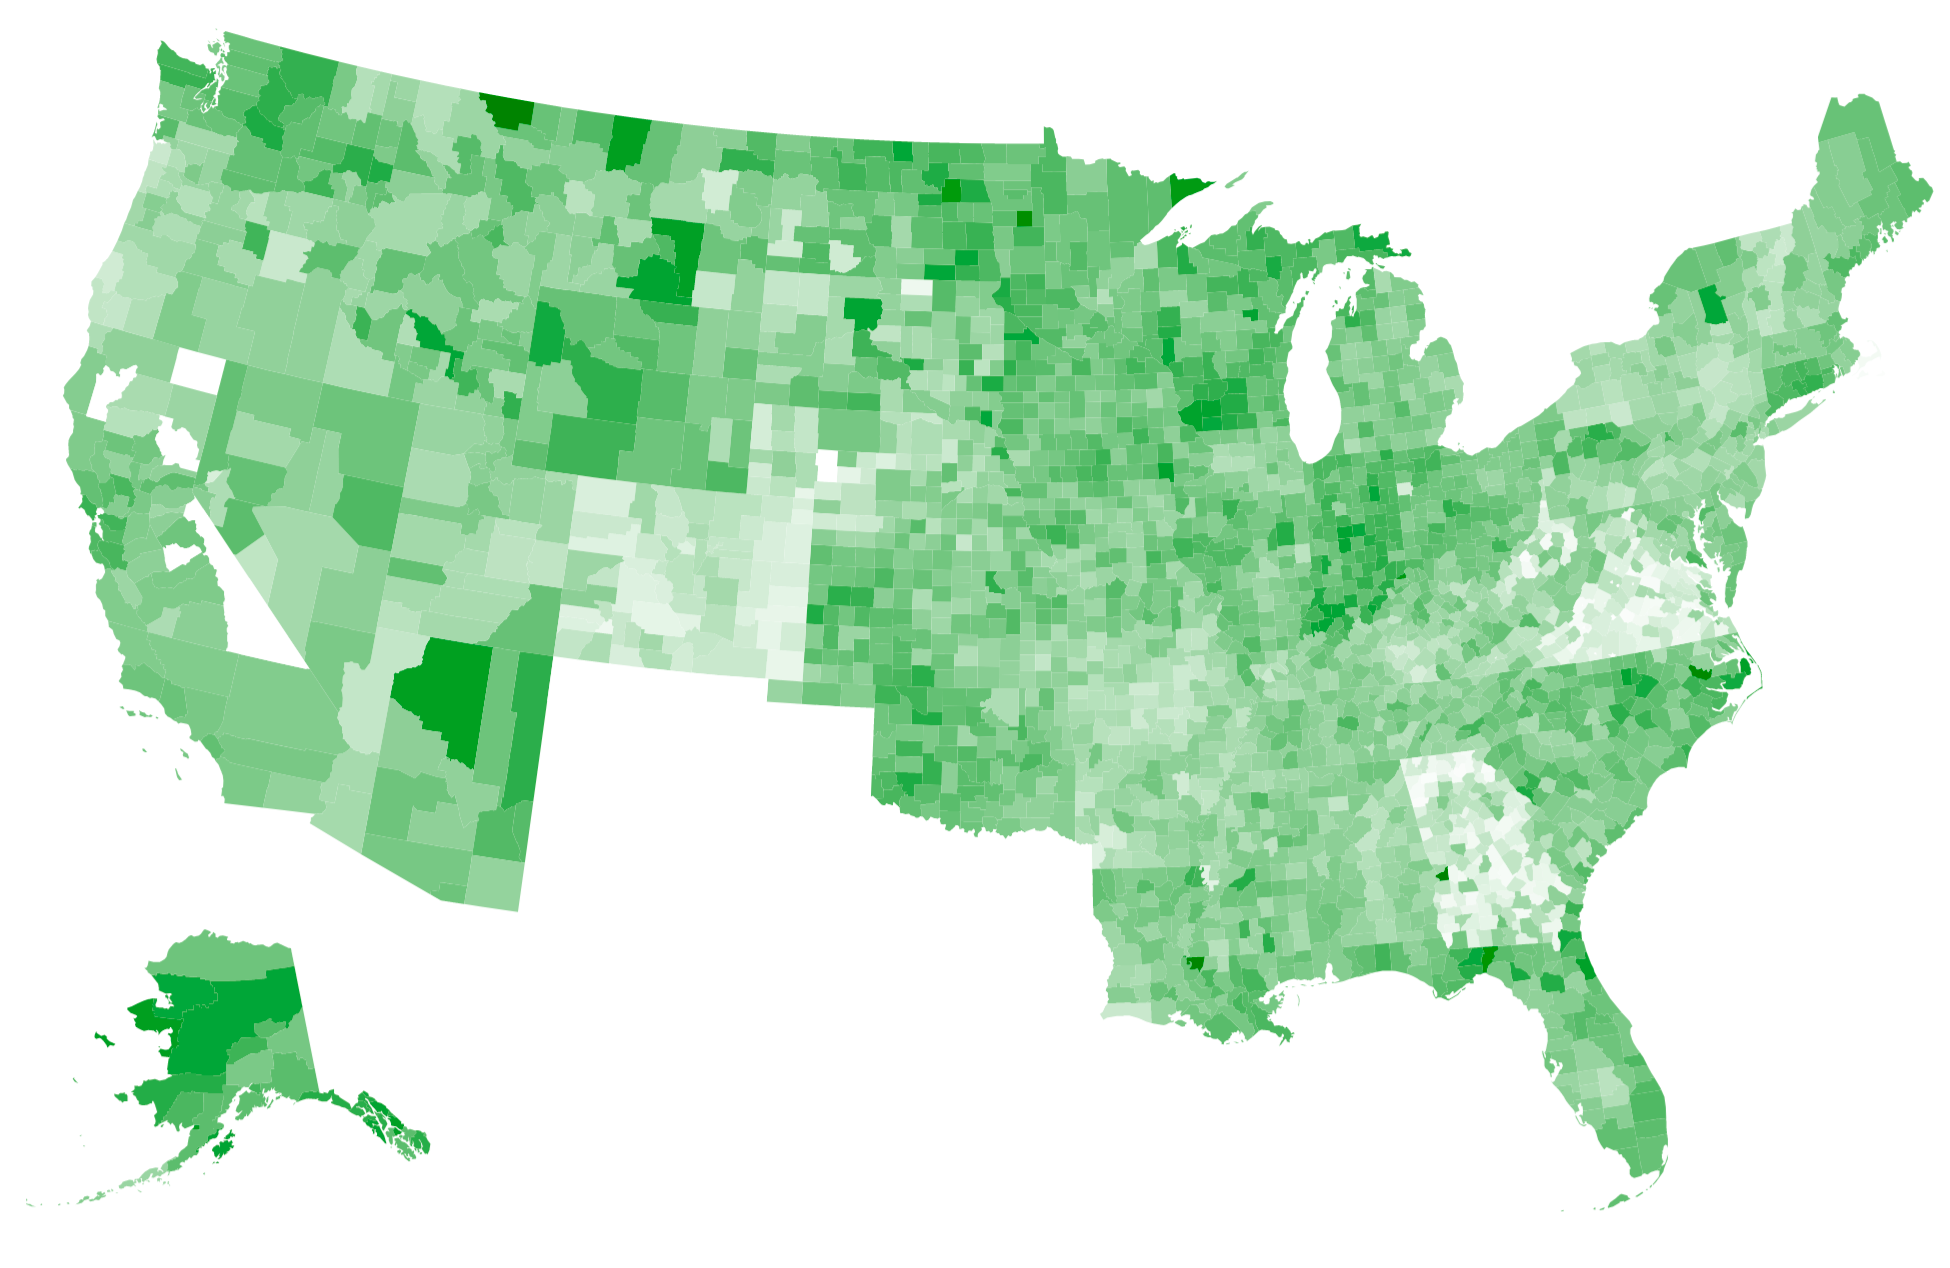
Last week I mentioned that I’ve recently started scraping and storing the CDC’s per-county vaccination numbers in my cdc-vaccination-history GitHub repository. This week I used an Observable notebook and d3’s TopoJSON support to render those numbers on an animated choropleth map.
[... 1,138 words]When building a tool, it’s easy to forget how much you’ve internalized: how much knowledge and context you’ve assumed. Your tool can feel familiar or even obvious to you while being utterly foreign to everyone else. If your goal is for other people to use the darn thing — meaning you’re not just building for yourself, or tinkering for its own sake (which are totally valid reasons) — you gotta help people use it! It doesn’t matter what’s possible or what you intended; all that matters is whether people actually succeed in practice.
2019
D3 Projection Comparison (via) Fun Observable notebook that lets you compare any two out of D3’s 96 (!) geographical projections of the world.
2018
What do you mean “average”? (via) Lovely example of an interactive explorable demonstrating mode/mean/median, built as an Observable notebook using D3.
Observable: An Earthquake Globe in Ten Minutes. Well worth your time. Jeremy Ashkenas uses Observable to live-code an interactive visualization of recent earthquakes around the world, using USGS data (fetched as JSON), d3, topoJSON and an Observable notebook. I’m sold—this is truly ground-breaking new technology.
Observable Beta (via) Observable just released their beta, and it’s quite something. It’s by Mike Bostock (d3), Jeremy Ashkenas (Backbone, CoffeeScript) and Tom MacWright (Mapbox Studio). The easiest way to describe it is Jupyter notebooks for JavaScript supporting reactive programming—so code is evaluated as you type and you can add interactive widgets (like sliders and canvas views) to construct explorable visualizations on the fly.
2017
An interactive explanation of quadtrees (via) Neat explorable explanation of quadtrees, using interactives built on top of D3.