2 posts tagged “choropleths”
2021
Animated choropleth of vaccinations by US county
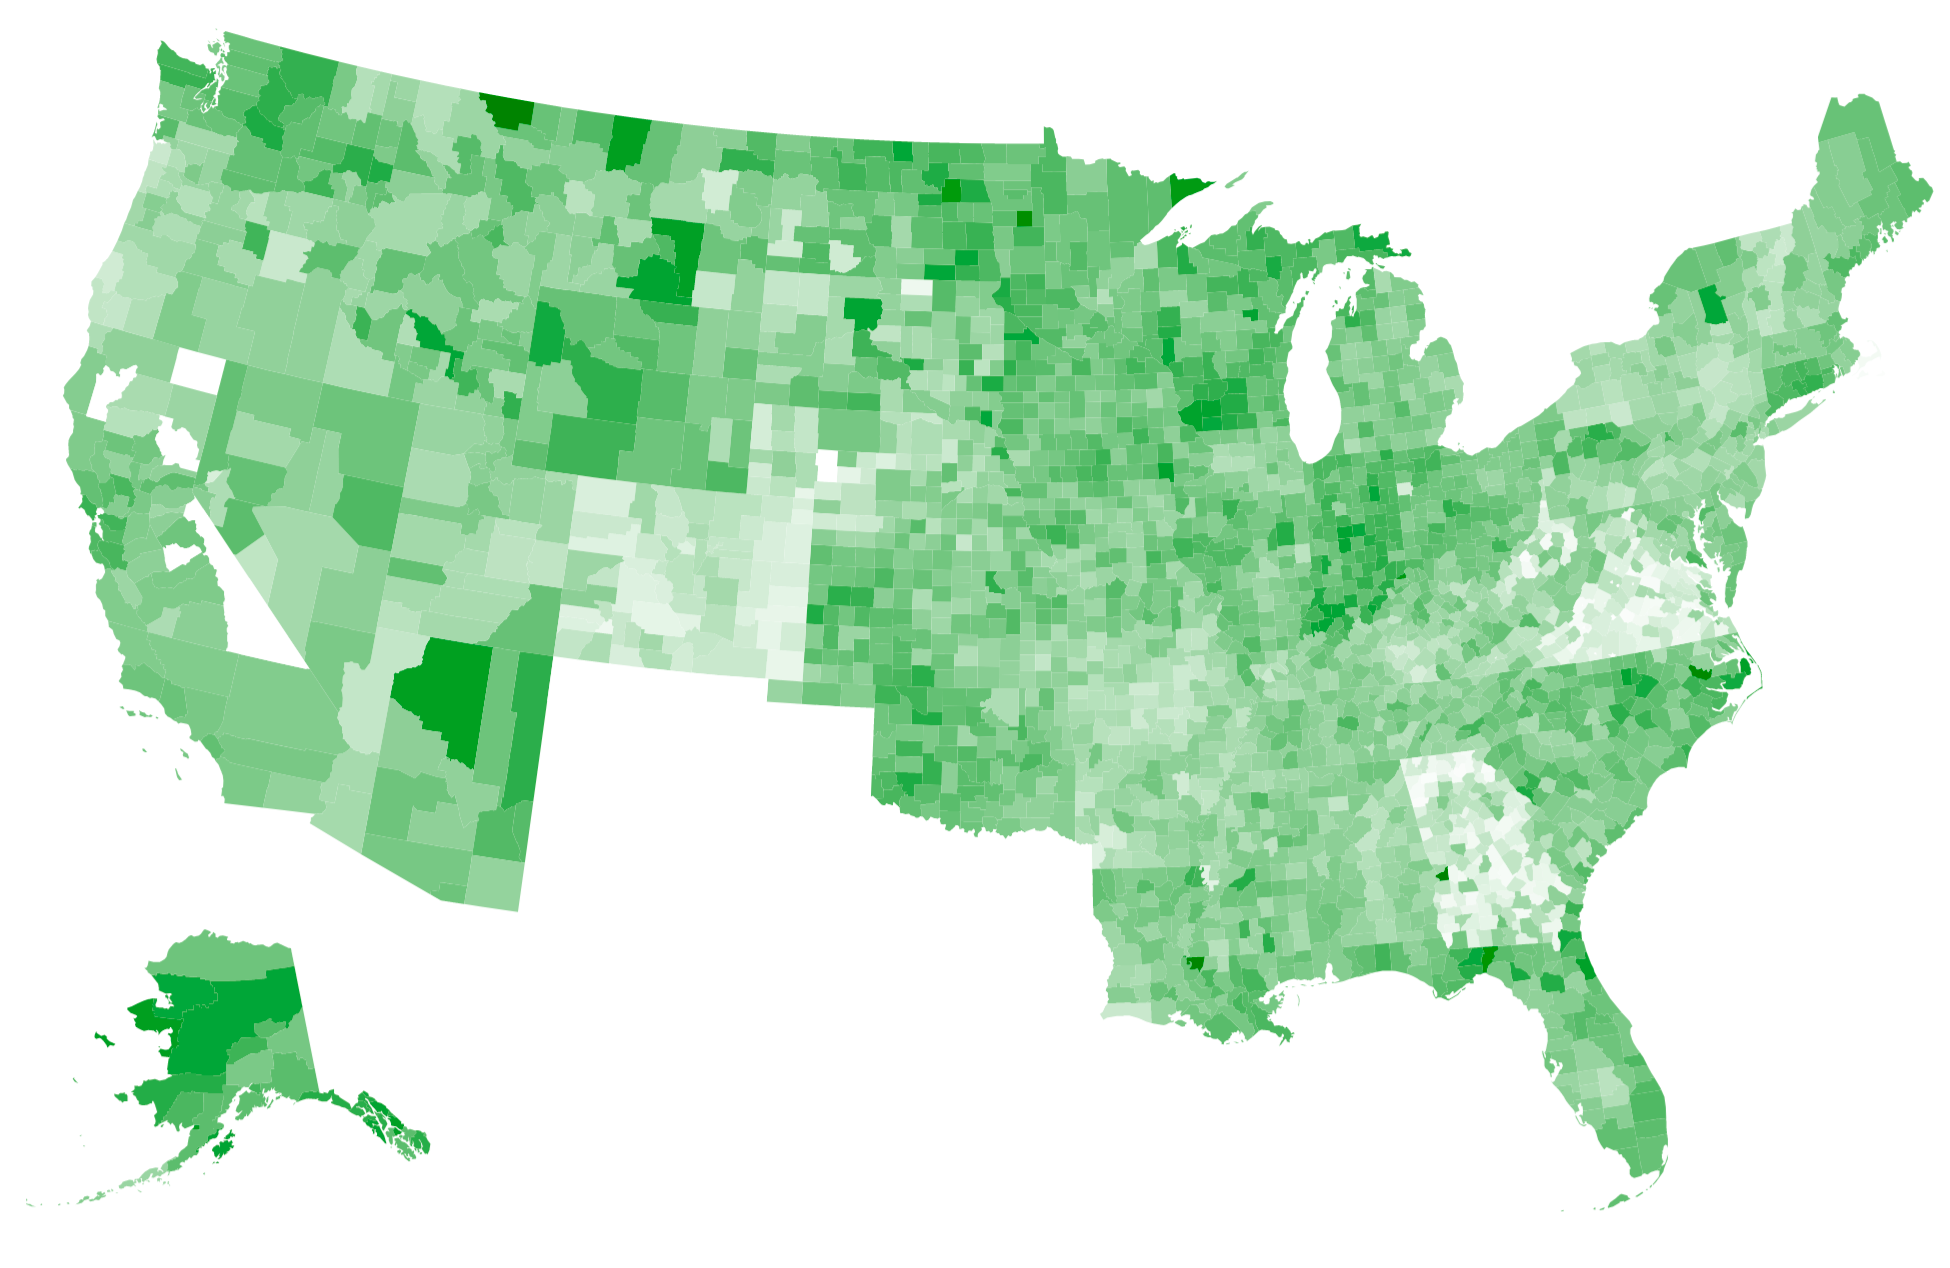
Last week I mentioned that I’ve recently started scraping and storing the CDC’s per-county vaccination numbers in my cdc-vaccination-history GitHub repository. This week I used an Observable notebook and d3’s TopoJSON support to render those numbers on an animated choropleth map.
[... 1,138 words]2009
How to Make a US County Thematic Map Using Free Tools. This is the trick I’ve been using to generate choropleths at the Guardian for the past year: figure out the preferred colours for a set of data in a Python script and then rewrite an SVG file to colour in the areas. I use ElementTree rather than BeautifulSoup but the technique is exactly the same. The best thing about SVG is that our graphics department can export them directly out of Illustrator, with named layers and paths automatically becoming SVG ID attributes. Bonus tip: sometimes you don’t have to rewrite the SVG XML at all, instead you can generate CSS to colour areas by ID selector and inject it in to the top of the file.