19 posts tagged “covid19”
2024
Providing validation, strength, and stability to people who feel gaslit and dismissed and forgotten can help them feel stronger and surer in their decisions. These pieces made me understand that journalism can be a caretaking profession, even if it is never really thought about in those terms. It is often framed in terms of antagonism. Speaking truth to power turns into being hard-nosed and removed from our subject matter, which so easily turns into be an asshole and do whatever you like.
This is a viewpoint that I reject. My pillars are empathy, curiosity, and kindness. And much else flows from that. For people who feel lost and alone, we get to say through our work, you are not. For people who feel like society has abandoned them and their lives do not matter, we get to say, actually, they fucking do. We are one of the only professions that can do that through our work and that can do that at scale.
My @covidsewage bot now includes useful alt text. I've been running a @covidsewage Mastodon bot for a while now, posting daily screenshots (taken with shot-scraper) of the Santa Clara County COVID in wastewater dashboard.
Prior to today the screenshot was accompanied by the decidedly unhelpful alt text "Screenshot of the latest Covid charts".
I finally fixed that today, closing issue #2 more than two years after I first opened it.
The screenshot is of a Microsoft Power BI dashboard. I hoped I could scrape the key information out of it using JavaScript, but the weirdness of their DOM proved insurmountable.
Instead, I'm using GPT-4o - specifically, this Python code (run using a python -c block in the GitHub Actions YAML file):
import base64, openai
client = openai.OpenAI()
with open('/tmp/covid.png', 'rb') as image_file:
    encoded_image = base64.b64encode(image_file.read()).decode('utf-8')
messages = [
    {'role': 'system',
     'content': 'Return the concentration levels in the sewersheds - single paragraph, no markdown'},
    {'role': 'user', 'content': [
        {'type': 'image_url', 'image_url': {
            'url': 'data:image/png;base64,' + encoded_image
        }}
    ]}
]
completion = client.chat.completions.create(model='gpt-4o', messages=messages)
print(completion.choices[0].message.content)
I'm base64 encoding the screenshot and sending it with this system prompt:
Return the concentration levels in the sewersheds - single paragraph, no markdown
Given this input image:
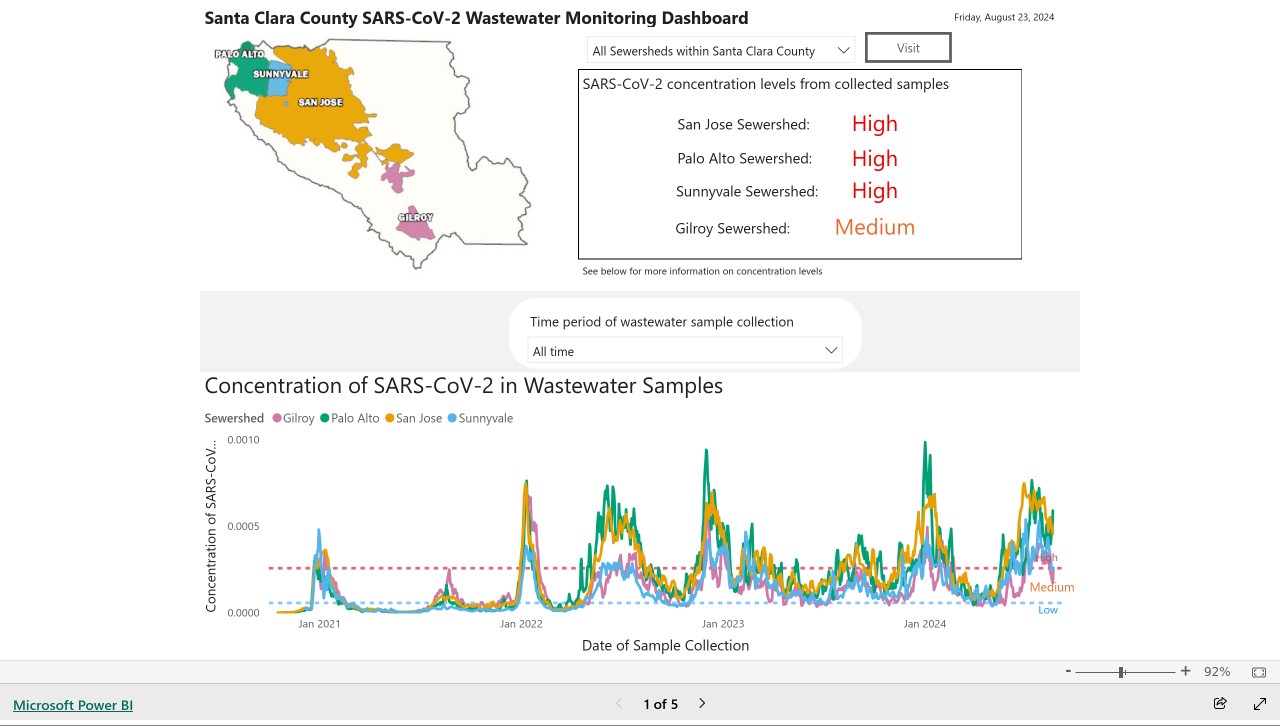
Here's the text that comes back:
The concentration levels of SARS-CoV-2 in the sewersheds from collected samples are as follows: San Jose Sewershed has a high concentration, Palo Alto Sewershed has a high concentration, Sunnyvale Sewershed has a high concentration, and Gilroy Sewershed has a medium concentration.
The full implementation can be found in the GitHub Actions workflow, which runs on a schedule at 7am Pacific time every day.
Fix @covidsewage bot to handle a change to the underlying website. I've been running @covidsewage on Mastodon since February last year tweeting a daily screenshot of the Santa Clara County charts showing Covid levels in wastewater.
A few days ago the county changed their website, breaking the bot. The chart now lives on their new COVID in wastewater page.
It's still a Microsoft Power BI dashboard in an <iframe>, but my initial attempts to scrape it didn't quite work. Eventually I realized that Cloudflare protection was blocking my attempts to access the page, but thankfully sending a Firefox user-agent fixed that problem.
The new recipe I'm using to screenshot the chart involves a delightfully messy nested set of calls to shot-scraper - first using shot-scraper javascript to extract the URL attribute for that <iframe>, then feeding that URL to a separate shot-scraper call to generate the screenshot:
shot-scraper -o /tmp/covid.png $(
  shot-scraper javascript \
    'https://publichealth.santaclaracounty.gov/health-information/health-data/disease-data/covid-19/covid-19-wastewater' \
    'document.querySelector("iframe").src' \
    -b firefox \
    --user-agent 'Mozilla/5.0 (Macintosh; Intel Mac OS X 10.15; rv:128.0) Gecko/20100101 Firefox/128.0' \
    --raw
) --wait 5000 -b firefox --retina
2022
Building a Covid sewage Twitter bot (and other weeknotes)
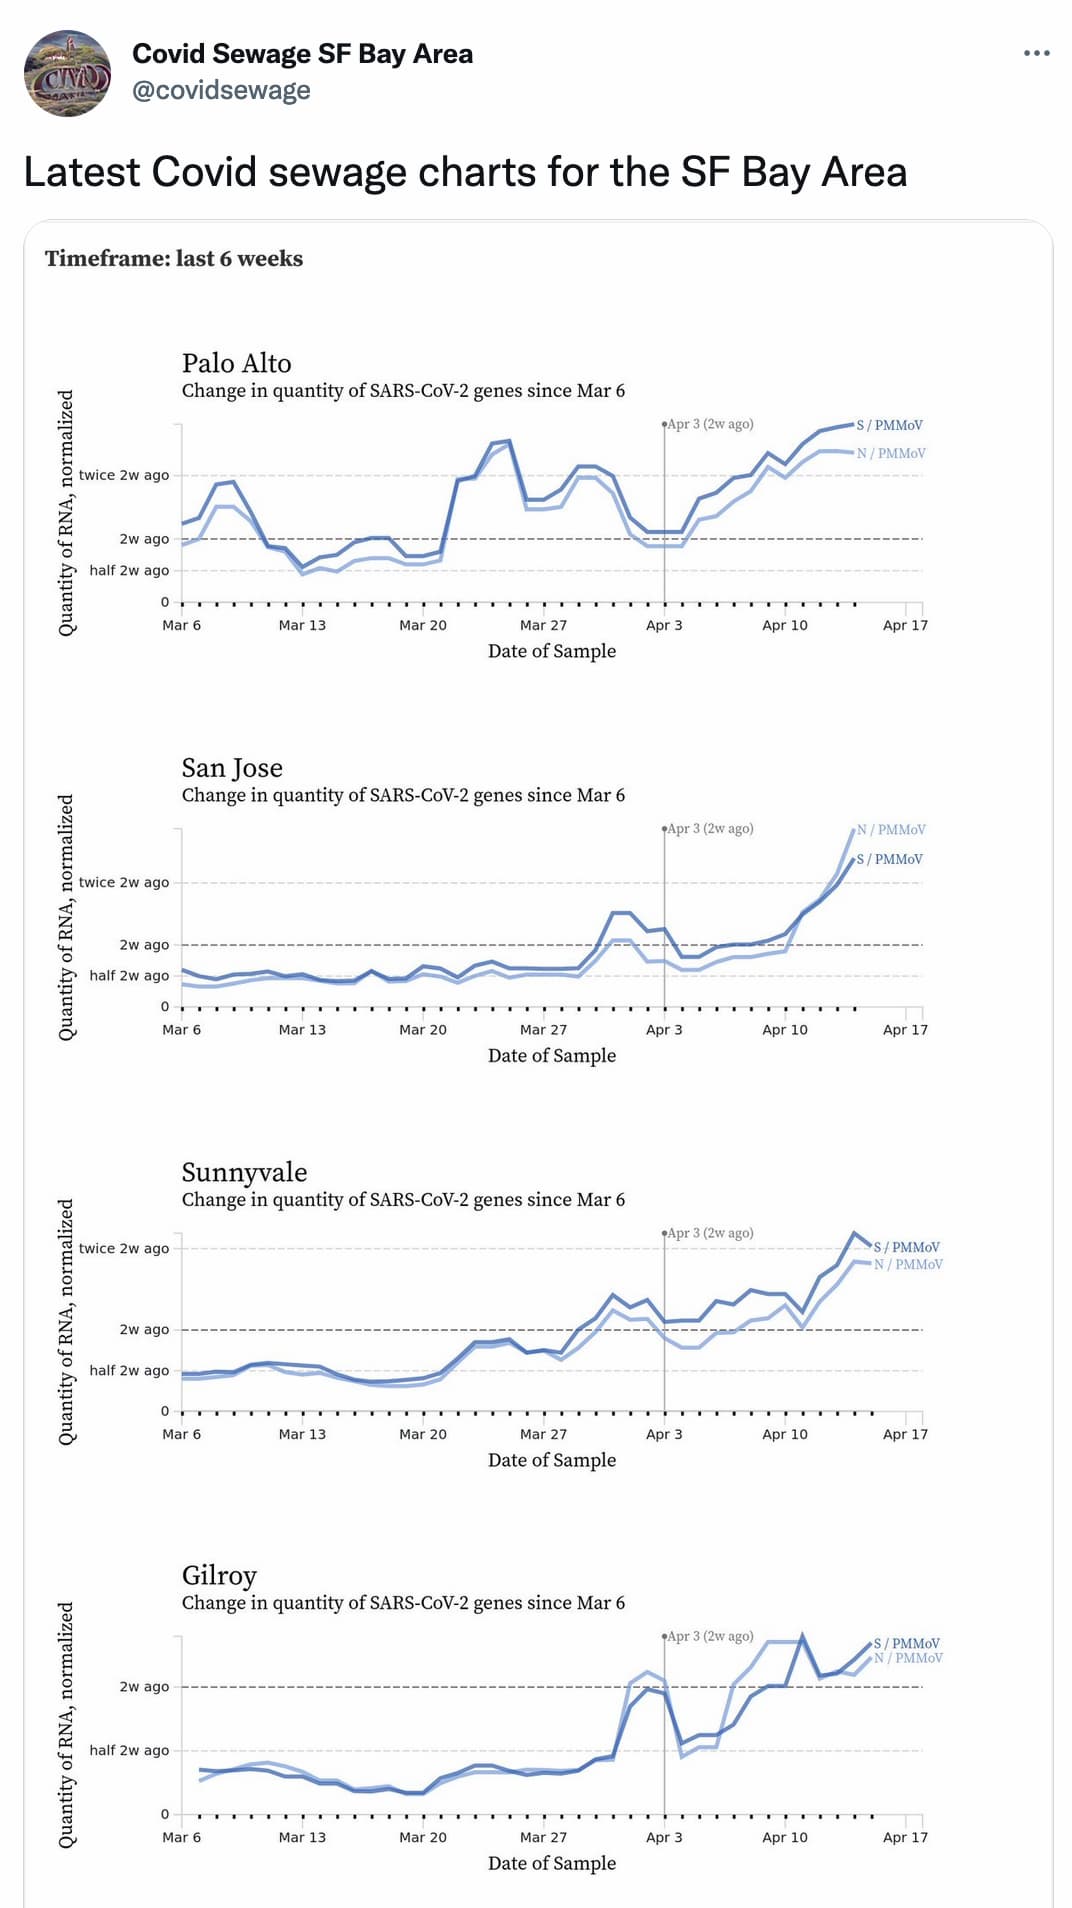
I built a new Twitter bot today: @covidsewage. It tweets a daily screenshot of the latest Covid sewage monitoring data published by Santa Clara county.
[... 1,079 words]2021
Weeknotes: CDC vaccination history fixes, developing in GitHub Codespaces
I spent the last week mostly surrounded by boxes: we’re completing our move to the new place and life is mostly unpacking now. I did find some time to fix some issues with my CDC vaccination history Datasette instance though.
[... 514 words]The rapid increase of COVID-19 cases among kids has shattered last year’s oft-repeated falsehood that kids don’t get COVID-19, and if they do, it’s not that bad. It was a convenient lie that was easy to believe in part because we kept most of our kids home. With remote learning not an option now, this year we’ll find out how dangerous this virus is for children in the worst way possible.
The Tyranny of Spreadsheets (via) In discussing the notorious Excel incident last year when the UK lost track of 16,000 Covid cases due to a .xls row limit, Tim Harford presents a history of the spreadsheet, dating all the way back to Francesco di Marco Datini and double-entry bookkeeping in 1396. A delightful piece of writing.
Trying to end the pandemic a little earlier with VaccinateCA
This week I got involved with the VaccinateCA effort. We are trying to end the pandemic a little earlier, by building the most accurate database possible of vaccination locations and availability in California.
[... 1,154 words]2020
CoronaFaceImpact (via) Variable fonts are fonts that can be customized by passing in additional parameters, which is done in CSS using the font-variation-settings property. Here’s a variable font that shows multiple effects of Covid-19 lockdown on a bearded face, created by Friedrich Althausen.
COVID-19 attacks our physical bodies, but also the cultural foundations of our lives, the toolbox of community and connectivity that is for the human what claws and teeth represent to the tiger.
Weeknotes: datasette-auth-passwords, a Datasette logo and a whole lot more
All sorts of project updates this week.
[... 913 words]Weeknotes: SBA Covid-19 PPP loans, Datasette talks, Datasette plugin upgrades
This week I’ve mainly been exploring Small Business Administration Covid-19 loans data, pitching some talks and upgrading some plugins for compatibility with Datasette 0.44+.
[... 524 words]sba-loans-covid-19-datasette (via) The treasury department released a bunch of data on the Covid-19 SBA Paycheck Protection Program Loan recipients today—I’ve loaded the most interesting data (the $150,000+ loans) into a Datasette instance.
The future will not be like the past. The comfortable Victorian and Georgian world complete with grand country houses, a globe-spanning British empire, and lords and commoners each knowing their place, was swept away by the events that began in the summer of 1914 (and that with Britain on the “winning” side of both world wars.) So too, our comfortable “American century” of conspicuous consumer consumption, global tourism, and ever-increasing stock and home prices may be gone forever.
Weeknotes: Archiving coronavirus.data.gov.uk, custom pages and directory configuration in Datasette, photos-to-sqlite
I mainly made progress on three projects this week: Datasette, photos-to-sqlite and a cleaner way of archiving data to a git repository.
[... 1,132 words]Bill Gates’s vision for life beyond the coronavirus. Fascinating interview with Bill Gates—the most interesting and informative article I’ve read about Covid-19 in quite a while.
Estimating COVID-19’s Rt in Real-Time. I’m not qualified to comment on the mathematical approach, but this is a really nice example of a Jupyter Notebook explanatory essay by Kevin Systrom.
Weeknotes: Covid-19, First Python Notebook, more Dogsheep, Tailscale
My covid-19.datasettes.com project publishes information on COVID-19 cases around the world. The project started out using data from Johns Hopkins CSSE, but last week the New York Times started publishing high quality USA county- and state-level daily numbers to their own repository. Here’s the change that added the NY Times data.
[... 993 words]Weeknotes: COVID-19 numbers in Datasette
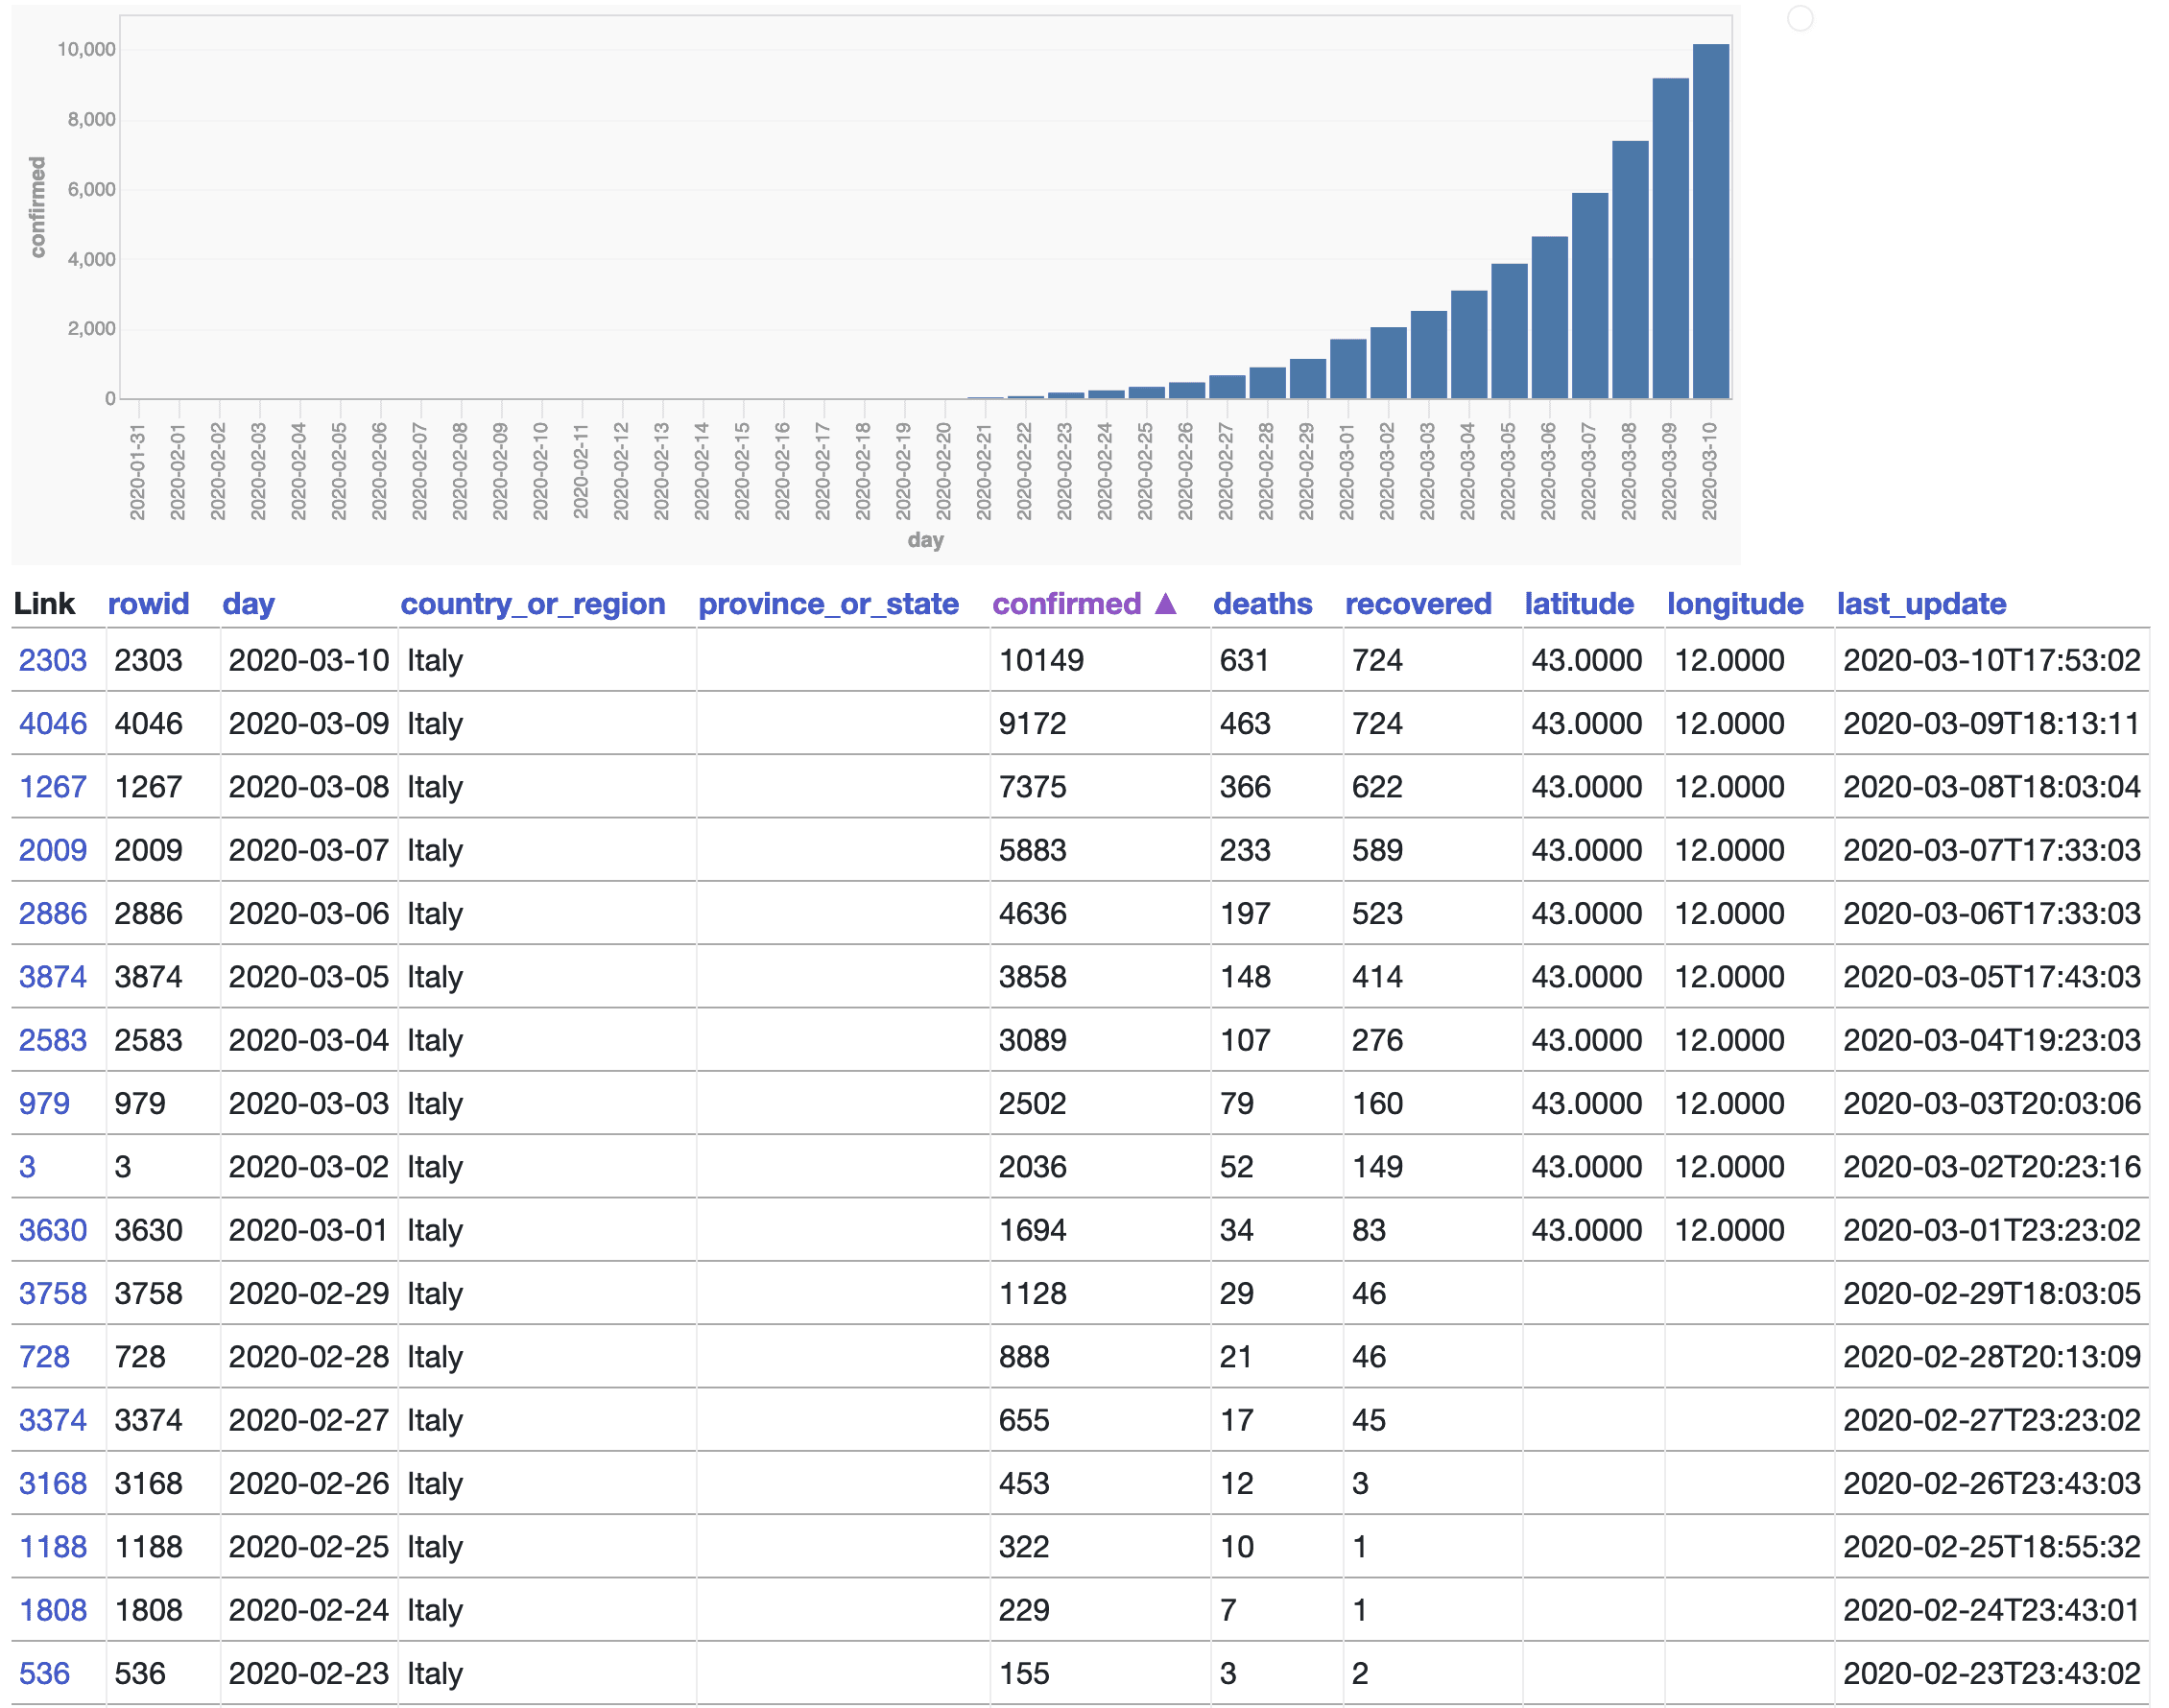
COVID-19, the disease caused by the novel coronavirus, gets more terrifying every day. Johns Hopkins Center for Systems Science and Engineering (CSSE) have been collating data about the spread of the disease and publishing it as CSV files on GitHub.
[... 644 words]