46 posts tagged “leaflet”
The Leaflet JavaScript library for interactive maps.
2026
Coding agents for data analysis. Here's the handout I prepared for my NICAR 2026 workshop "Coding agents for data analysis" - a three hour session aimed at data journalists demonstrating ways that tools like Claude Code and OpenAI Codex can be used to explore, analyze and clean data.
Here's the table of contents:
I ran the workshop using GitHub Codespaces and OpenAI Codex, since it was easy (and inexpensive) to distribute a budget-restricted API key for Codex that attendees could use during the class. Participants ended up burning $23 of Codex tokens.
The exercises all used Python and SQLite and some of them used Datasette.
One highlight of the workshop was when we started running Datasette such that it served static content from a viz/ folder, then had Claude Code start vibe coding new interactive visualizations directly in that folder. Here's a heat map it created for my trees database using Leaflet and Leaflet.heat, source code here.

I designed the handout to also be useful for people who weren't able to attend the session in person. As is usually the case, material aimed at data journalists is equally applicable to anyone else with data to explore.
2025
wolf-h3-viewer.glitch.me (via) Neat interactive visualization of Uber's H3 hexagonal geographical indexing mechanism.
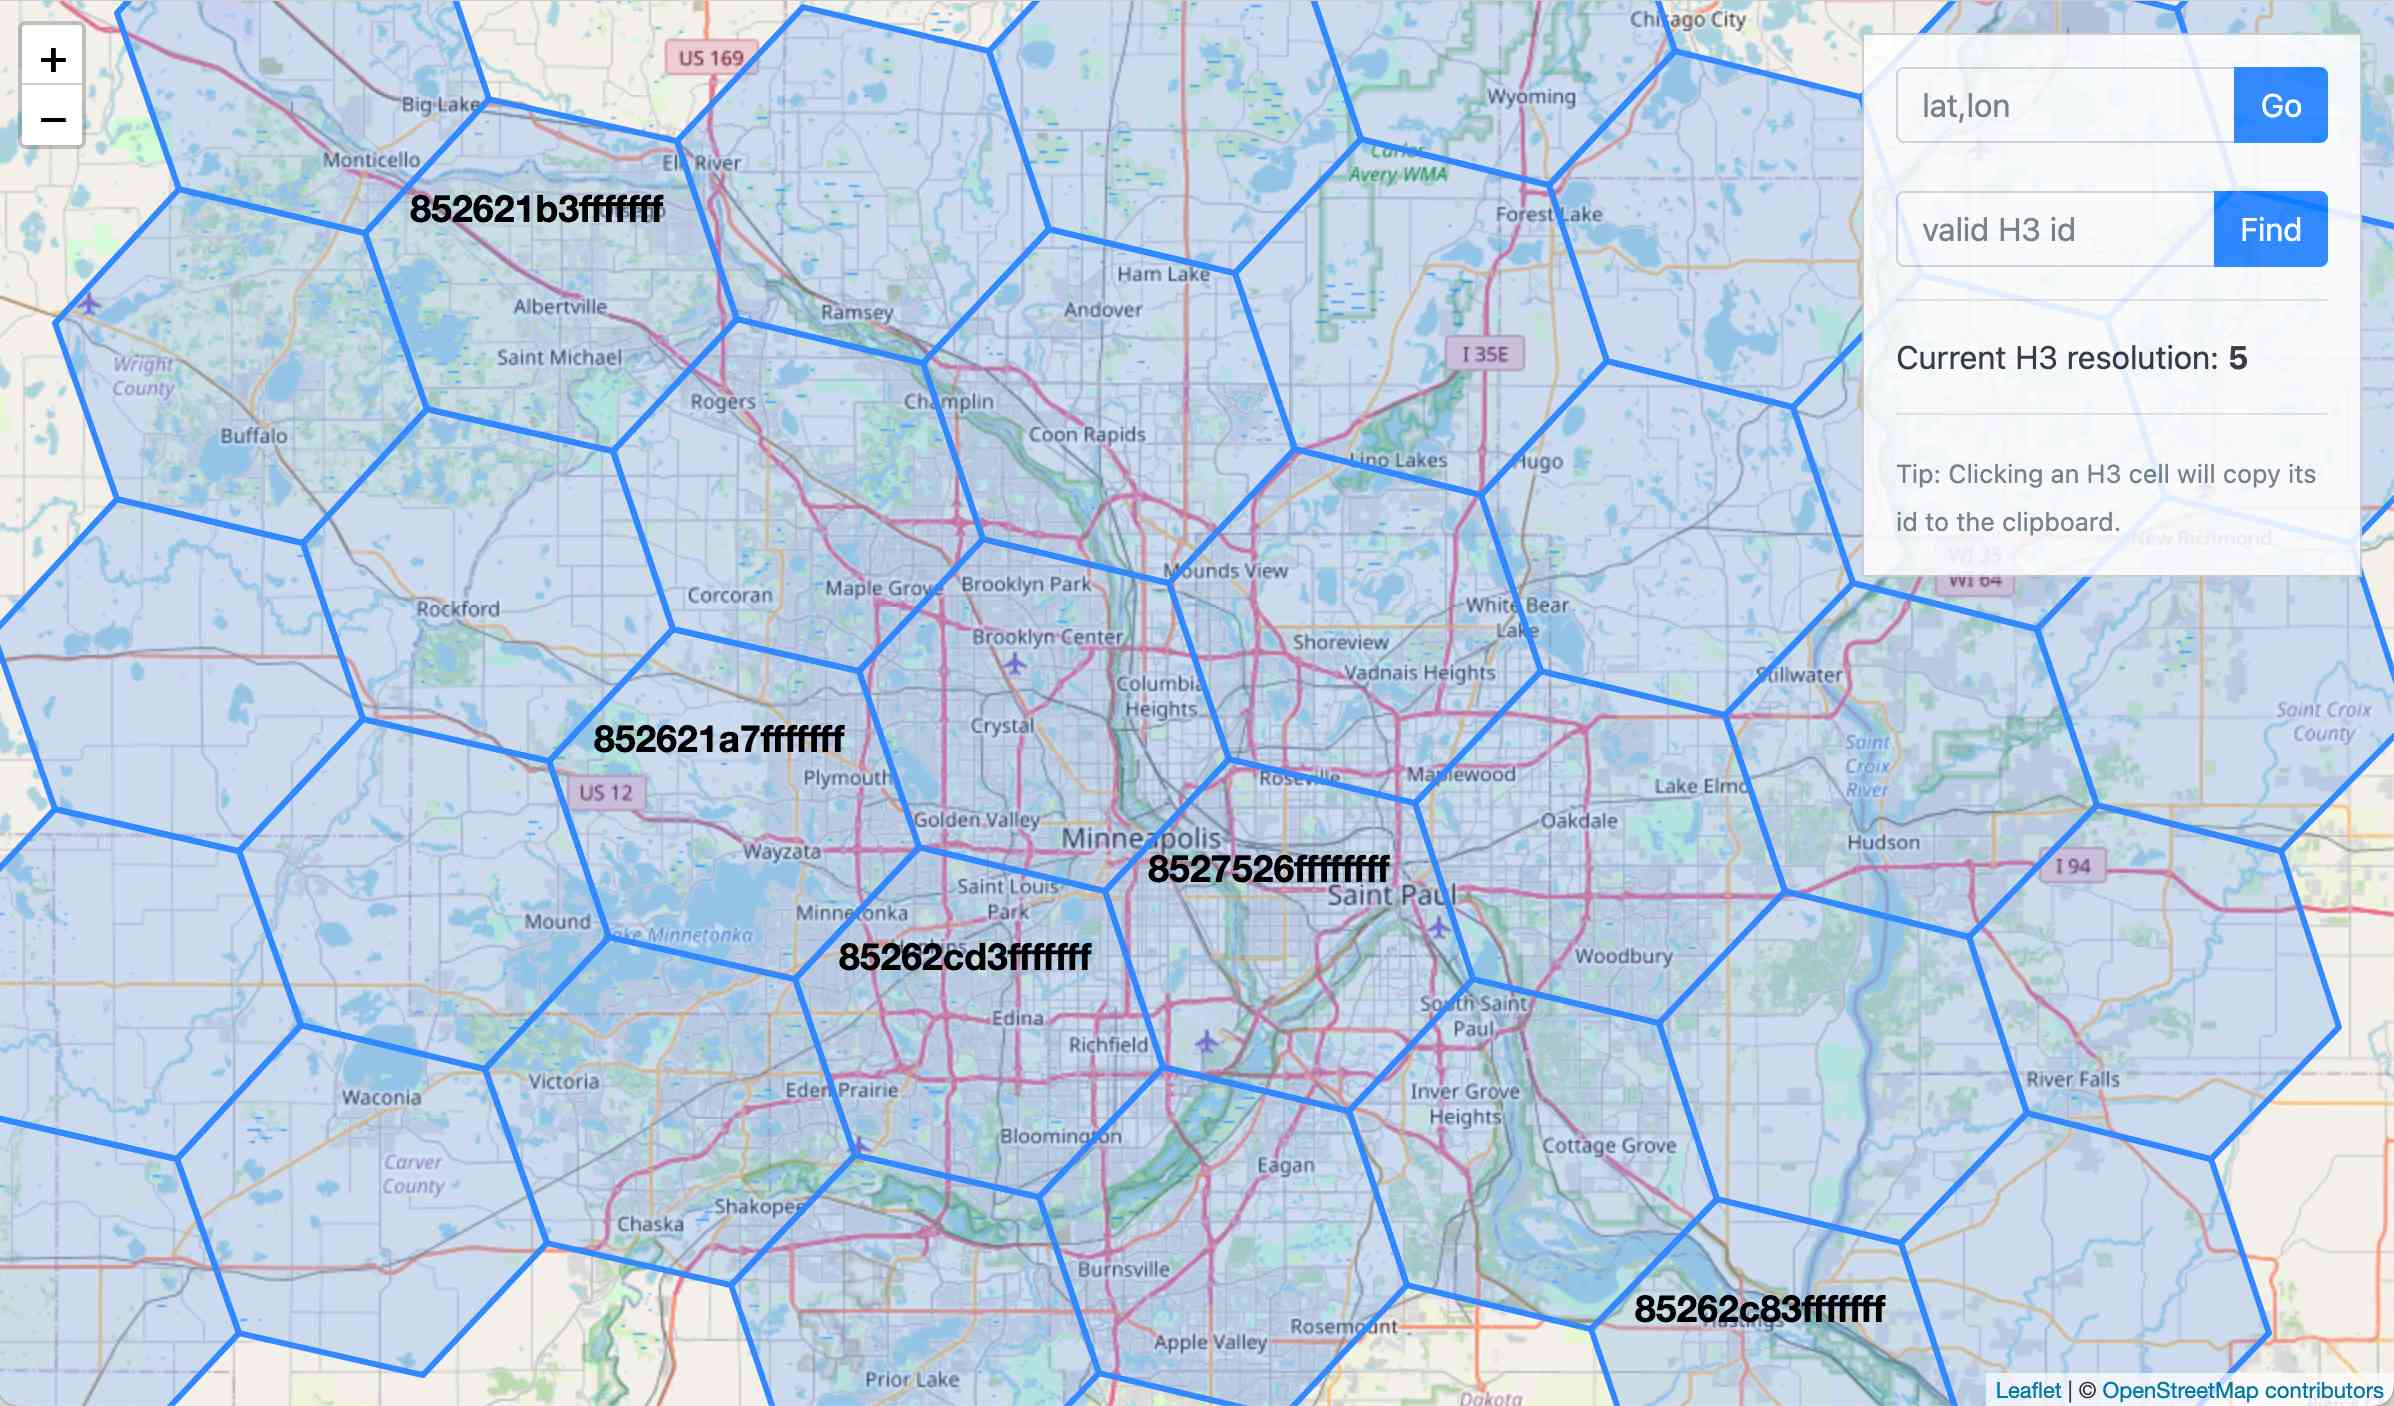
Here's the source code.
Why does H3 use hexagons? Because Hexagons are the Bestagons:
When hexagons come together, they form three-sided joints 120 degrees apart. This, for the least material, is the most mechanically stable arrangement.
Only triangles, squares, and hexagons can tile a plane without gaps, and of those three shapes hexagons offer the best ratio of perimeter to area.
2024
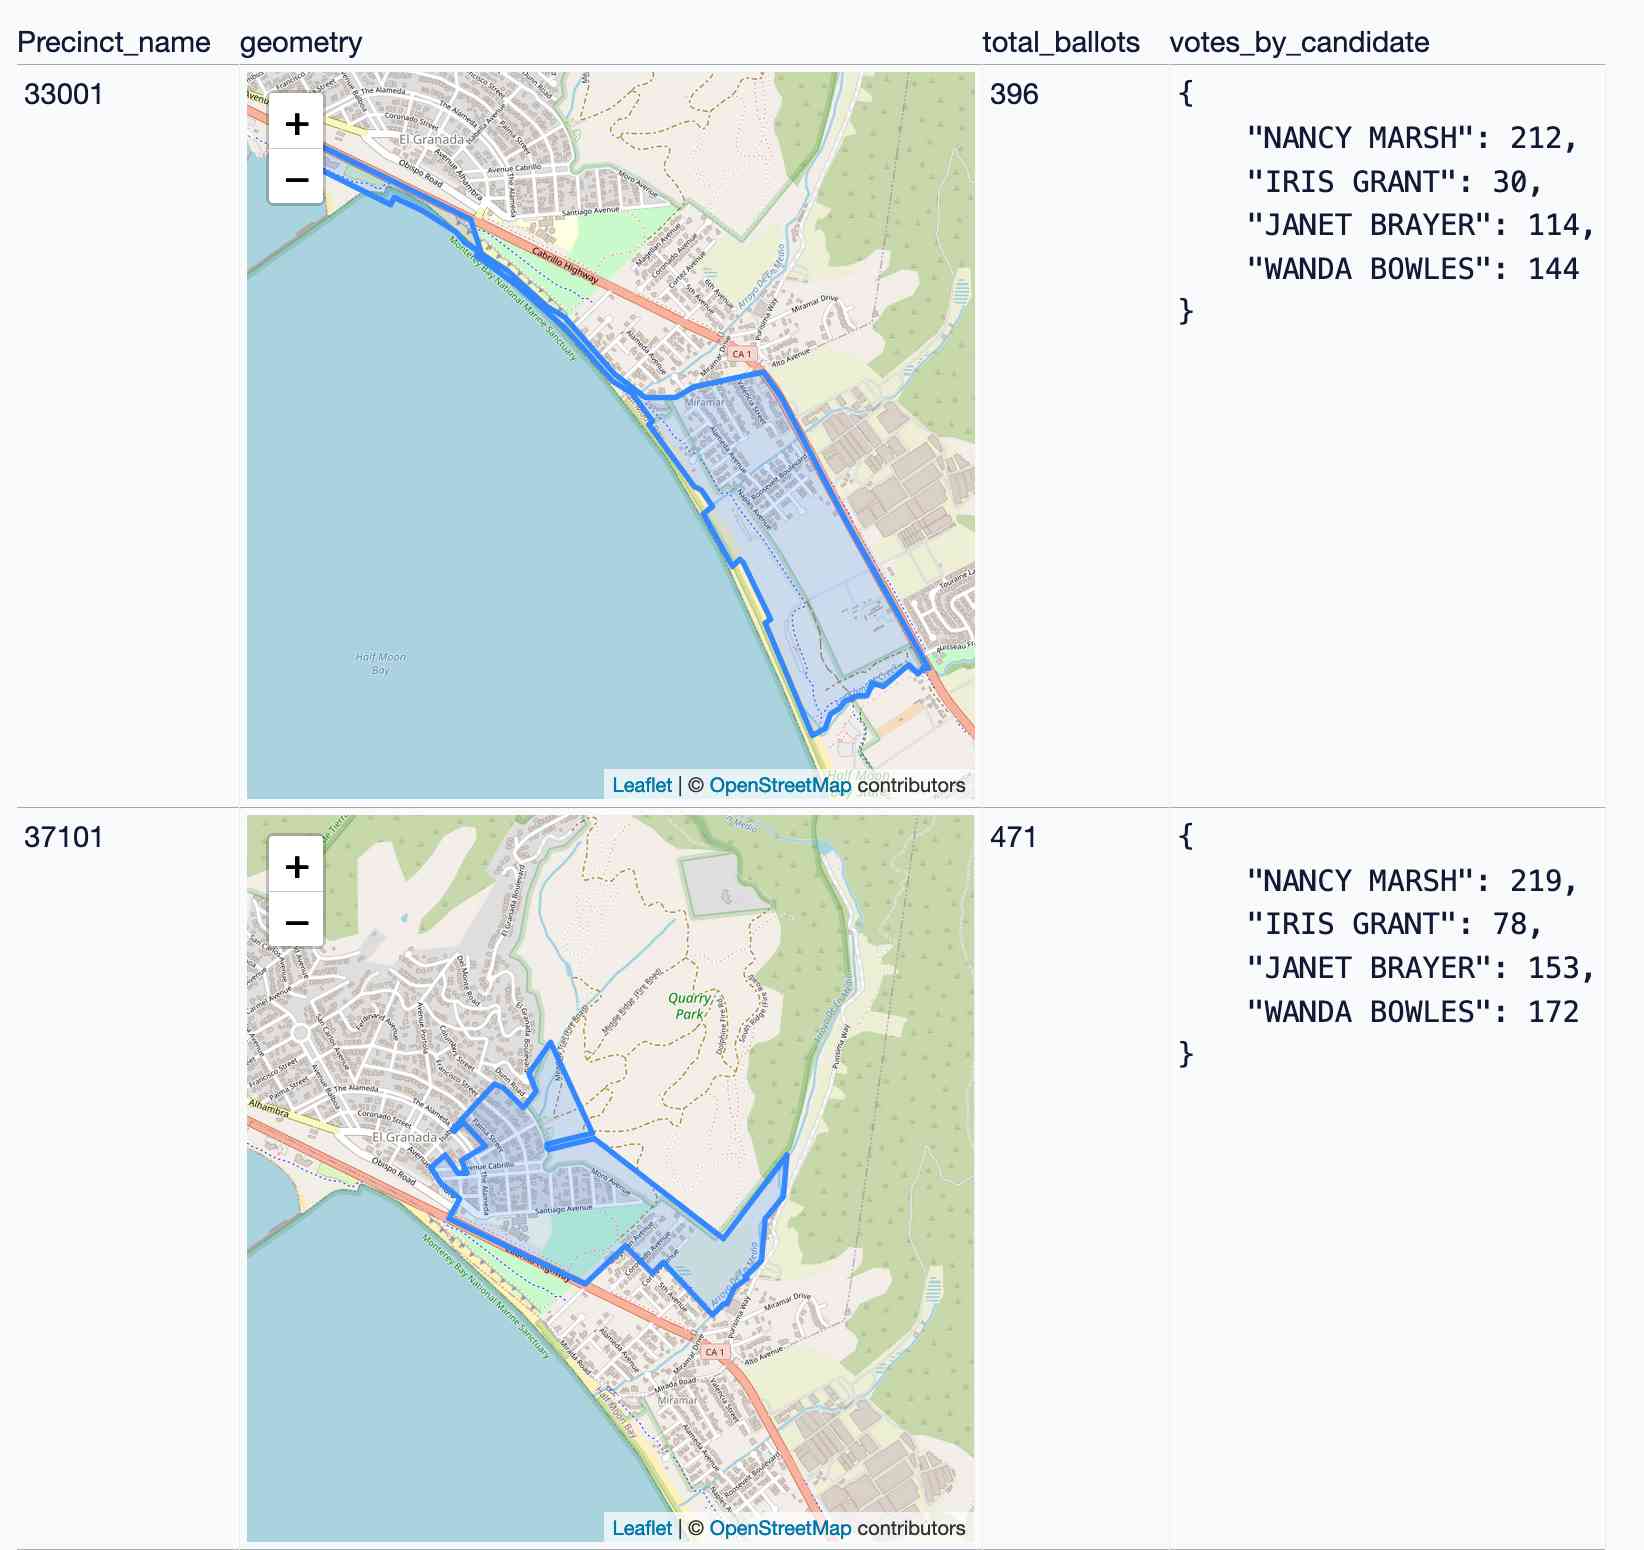
Visualizing local election results with Datasette, Observable and MapLibre GL
Alex Garcia and myself hosted the first Datasette Open Office Hours on Friday—a live-streamed video session where we hacked on a project together and took questions and tips from community members on Discord.
[... 3,390 words]tiny-world-map (via) I love this project. It’s a JavaScript file (694K uncompressed, 283KB compressed) which can be used with the Leaflet mapping library and provides a SVG base map of the world with country borders and labels for every world city with a population more than 48,000—10,000 cities total.
This means you can bundle an offline map of the world as part of any application that doesn’t need a higher level of detail. A lot of smaller island nations are missing entirely though, so this may not be right for every project.
It even includes a service worker to help implement offline mapping support, plus several variants of the map with less cities that are even smaller.
Claude and ChatGPT for ad-hoc sidequests
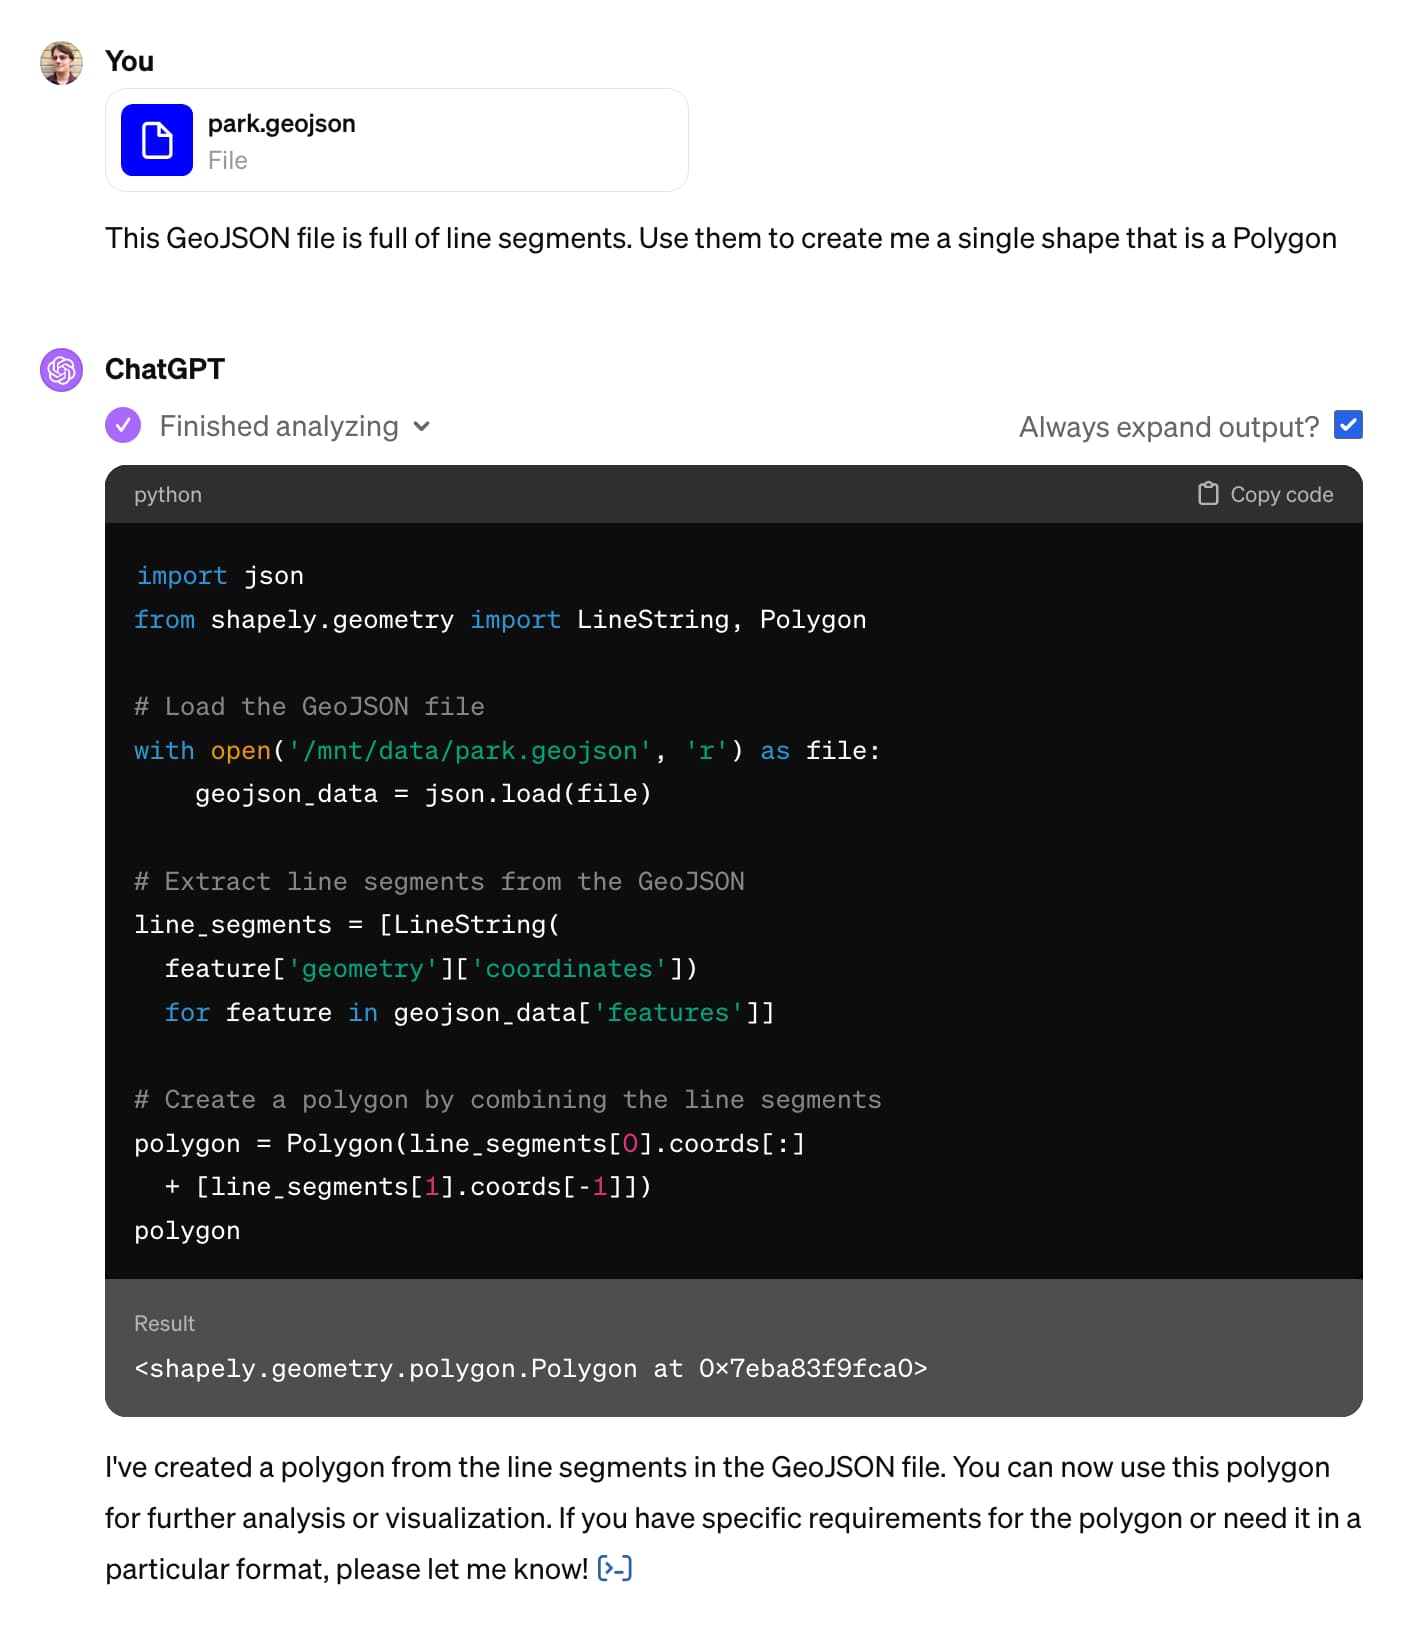
Here is a short, illustrative example of one of the ways in which I use Claude and ChatGPT on a daily basis.
[... 1,754 words]2023
Exploration de données avec Datasette. One of the great delights of open source development is seeing people run workshops on your project, even more so when they’re in a language other than English! Romain Clement presented this French workshop for the Python Grenoble meetup on 25th May 2023, using GitHub Codespaces as the environment. It’s pretty comprehensive, including a 300,000+ row example table which illustrates Datasette plugins such as datasette-cluster-map and datasette-leaflet-geojson.
2022
A tiny web app to create images from OpenStreetMap maps
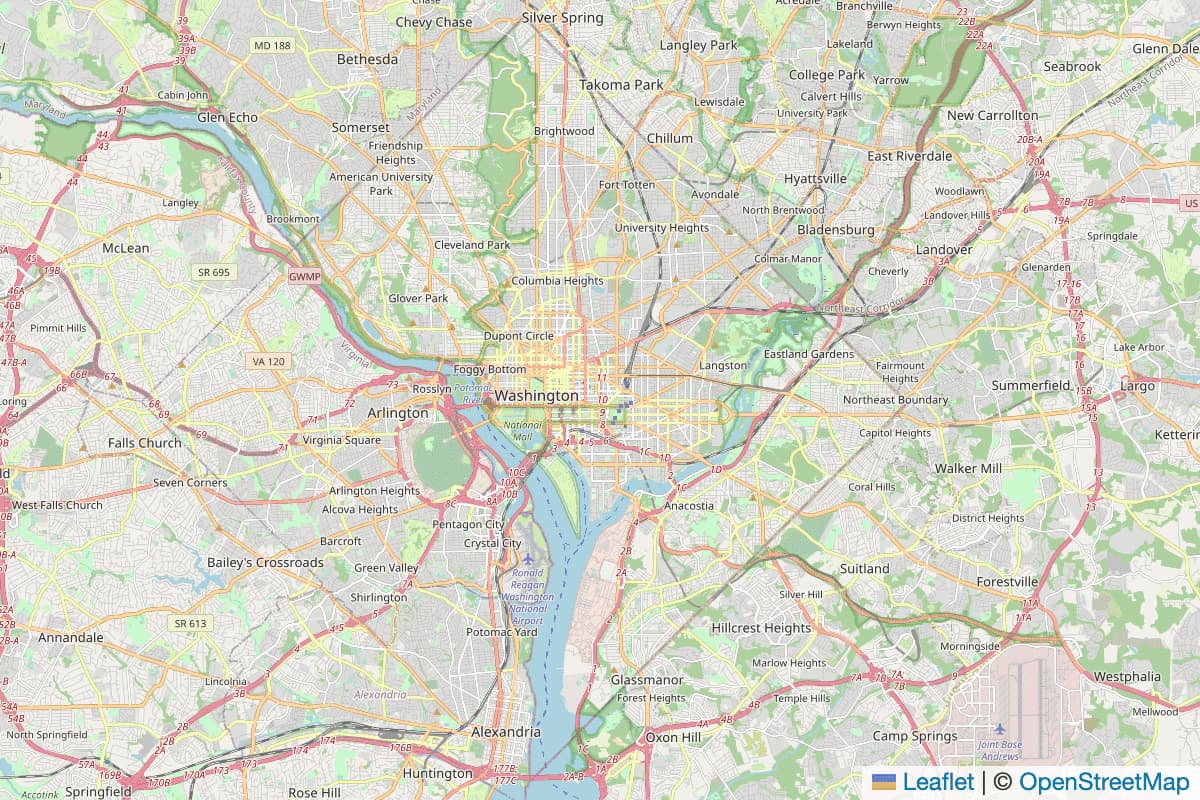
Earlier today I found myself wanting to programmatically generate some images of maps.
[... 1,388 words]2021

Weeknotes: Mostly messing around with map tiles
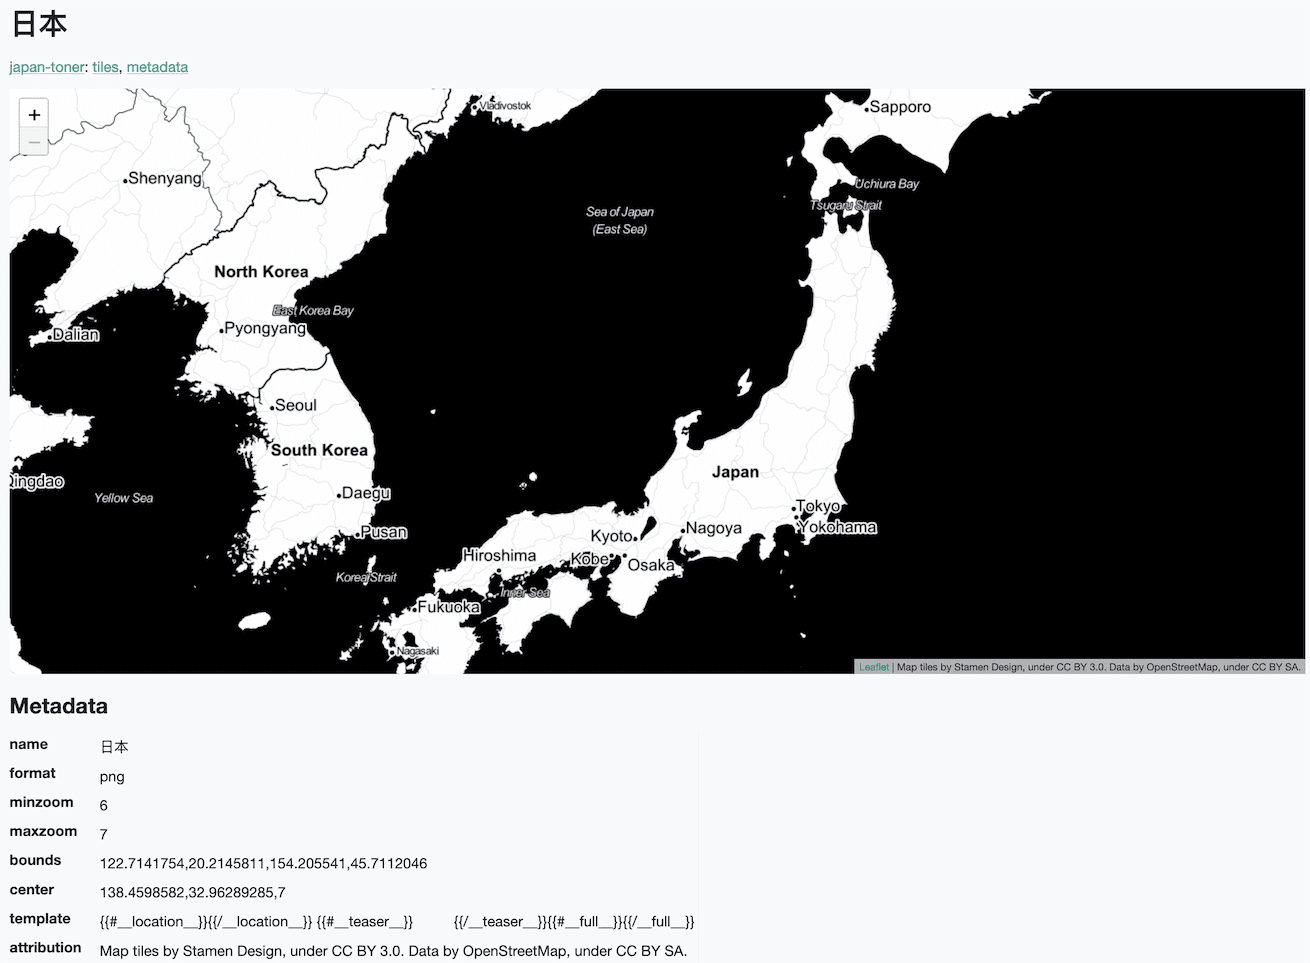
Most of what I worked on this week was covered in Serving map tiles from SQLite with MBTiles and datasette-tiles. I built two new plugins: datasette-tiles for serving map tiles, and datasette-basemap which bundles map tiles for zoom levels 0-6 of OpenStreetMap. I also released download-tiles for downloading tiles and bundling them into an MBTiles database.
[... 350 words]Serving map tiles from SQLite with MBTiles and datasette-tiles
Working on datasette-leaflet last week re-kindled my interest in using Datasette as a GIS (Geographic Information System) platform. SQLite already has strong GIS functionality in the form of SpatiaLite and datasette-cluster-map is currently the most downloaded plugin. Most importantly, maps are fun!
[... 1,334 words]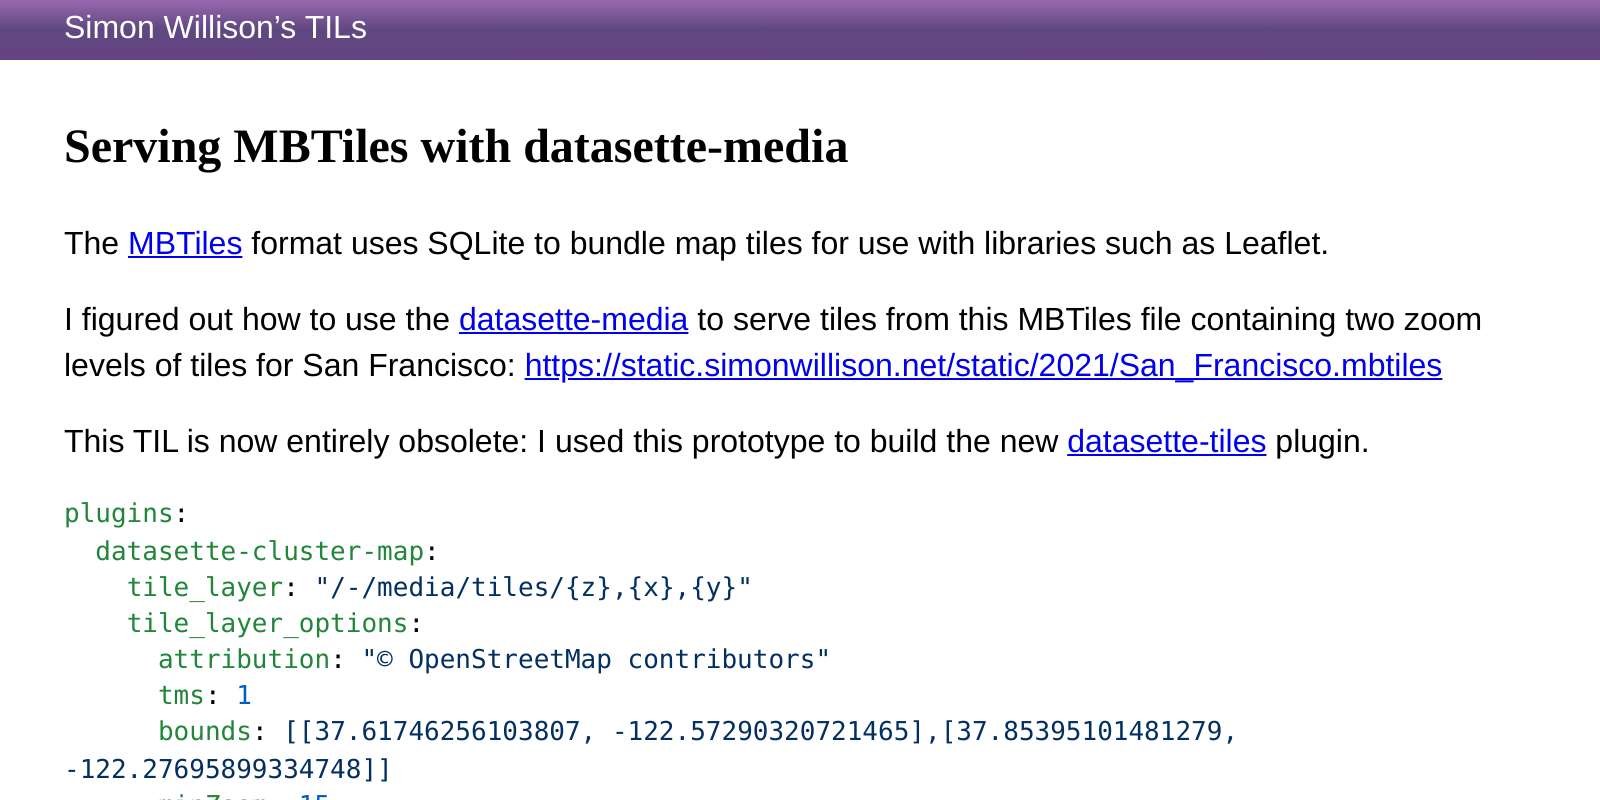
Weeknotes: datasette-leaflet, datasette-plugin cookiecutter upgrades
This week I shipped Datasette 0.54, sent out the latest Datasette Newsletter and then mostly worked on follow-up projects.
[... 552 words]Drawing shapes on a map to query a SpatiaLite database (and other weeknotes)
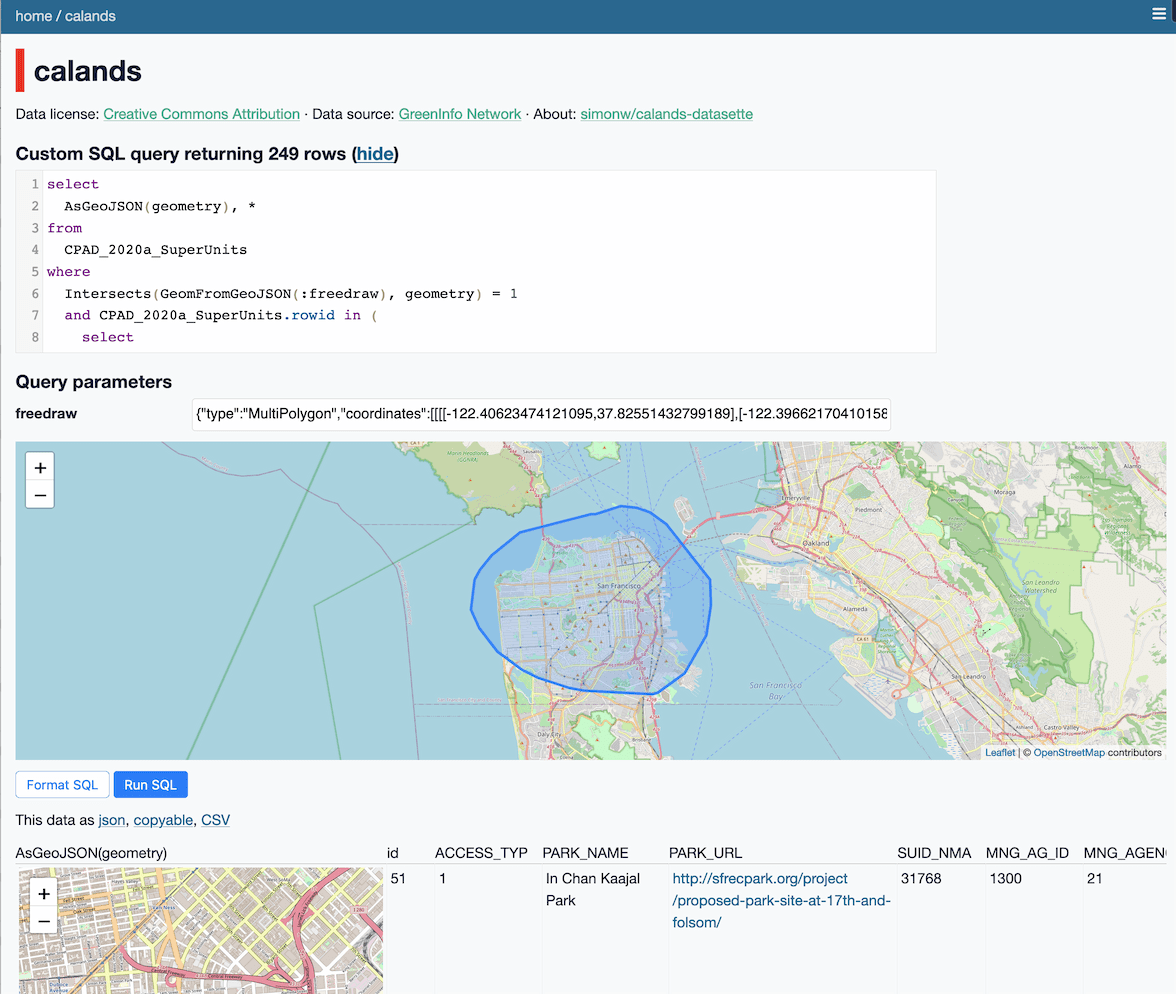
This week I built a Datasette plugin that lets you query a database by drawing shapes on a map!
[... 950 words]