1,522 posts tagged “datasette”
Datasette is an open source tool for exploring and publishing data.
2021
Datasette Desktop—a macOS desktop application for Datasette
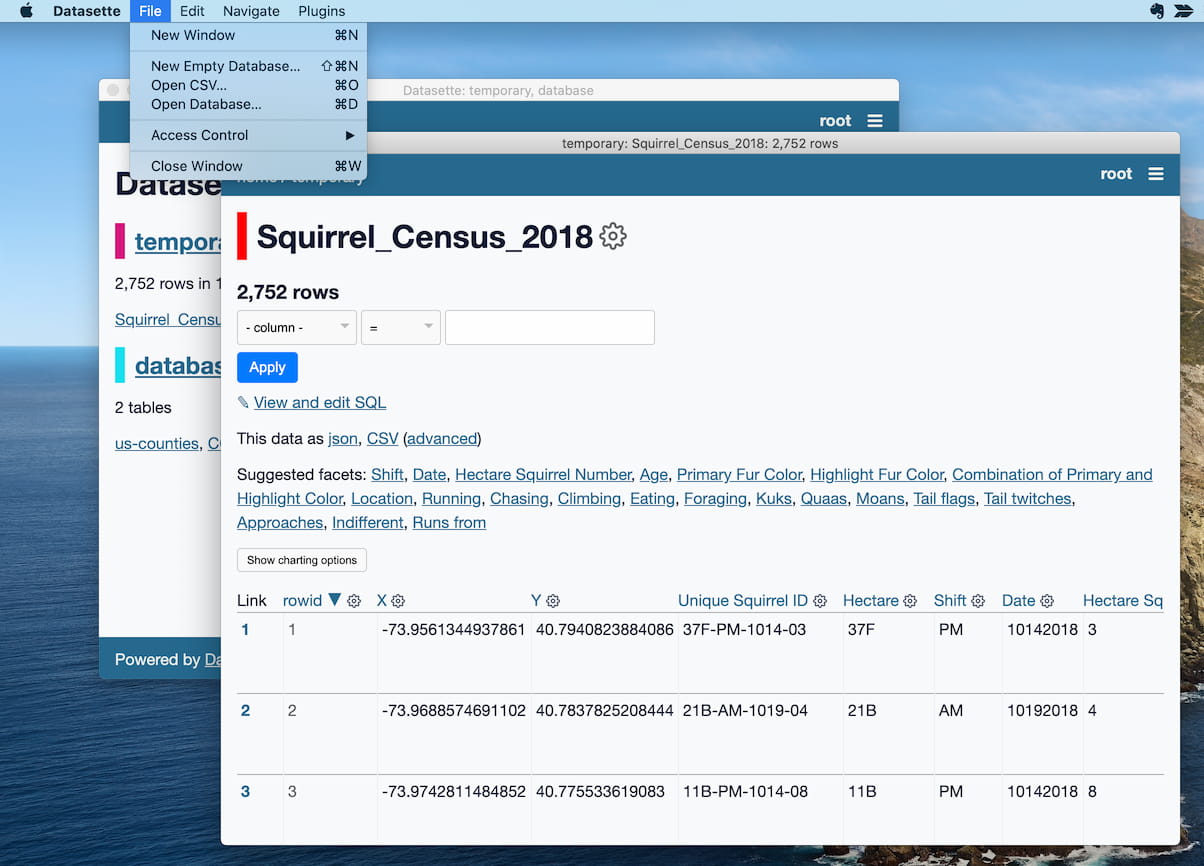
I just released version 0.1.0 of the new Datasette macOS desktop application, the first version that end-users can easily install. I would very much appreciate your help testing it out!
[... 1,761 words]Datasette Desktop 0.1.0 (via) This is the first installable version of the new Datasette Desktop macOS application I’ve been building. Please try it out and leave feedback on Twitter or on the GitHub Discussions thread linked from the release notes.
Building a desktop application for Datasette (and weeknotes)
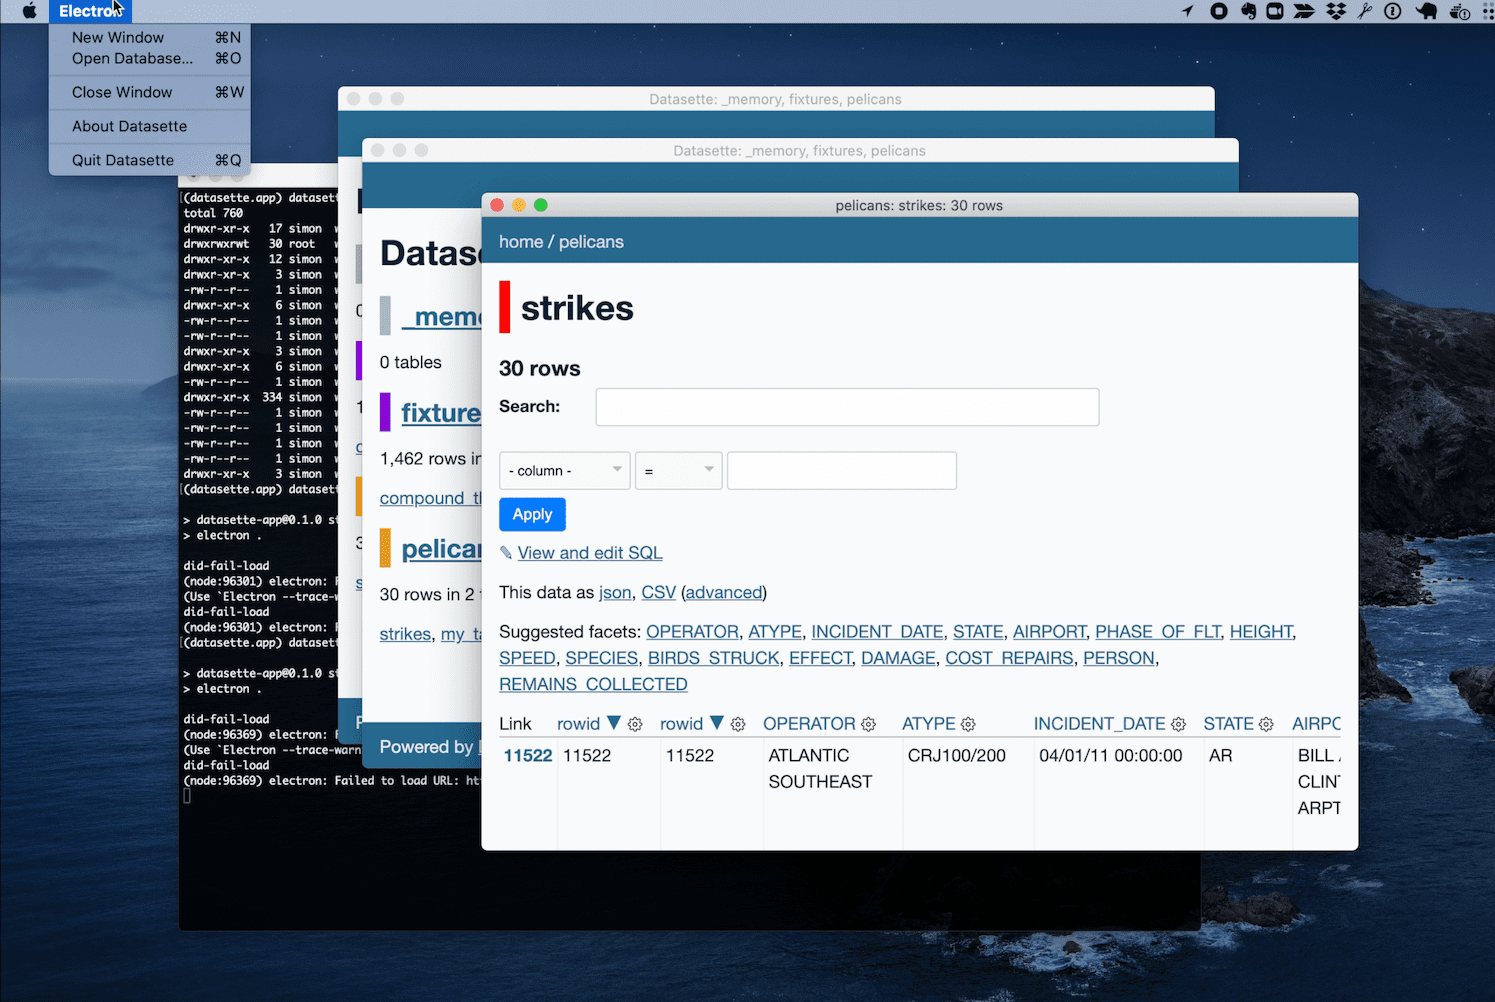
This week I started experimenting with a desktop application version of Datasette—with the goal of providing people who aren’t comfortable with the command-line the ability to get Datasette up and running on their own personal computers.
[... 1,423 words]Weeknotes: Getting my personal Dogsheep up and running again
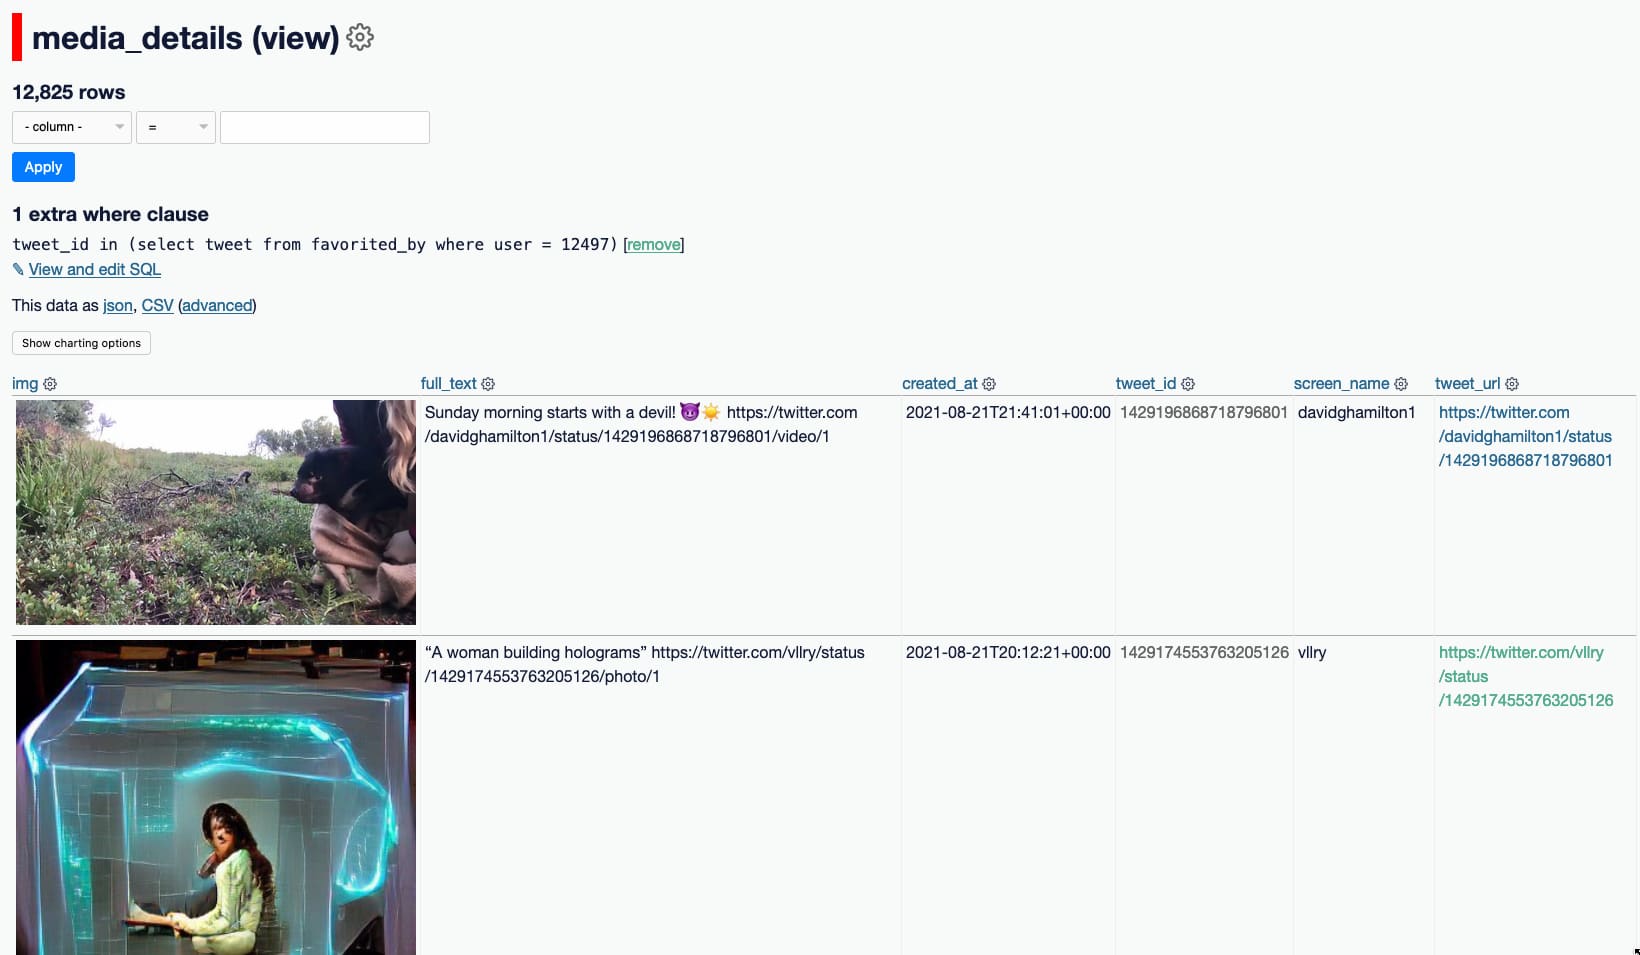
I gave a talk about Dogsheep at Noisebridge’s Five Minutes of Fame on Thursday. Just one problem: my regular Dogsheep demo was broken, so I ended up building it from scratch again. In doing so I fixed a few bugs in some Dogsheep tools.
[... 1,311 words]Datasette on Codespaces, sqlite-utils API reference documentation and other weeknotes
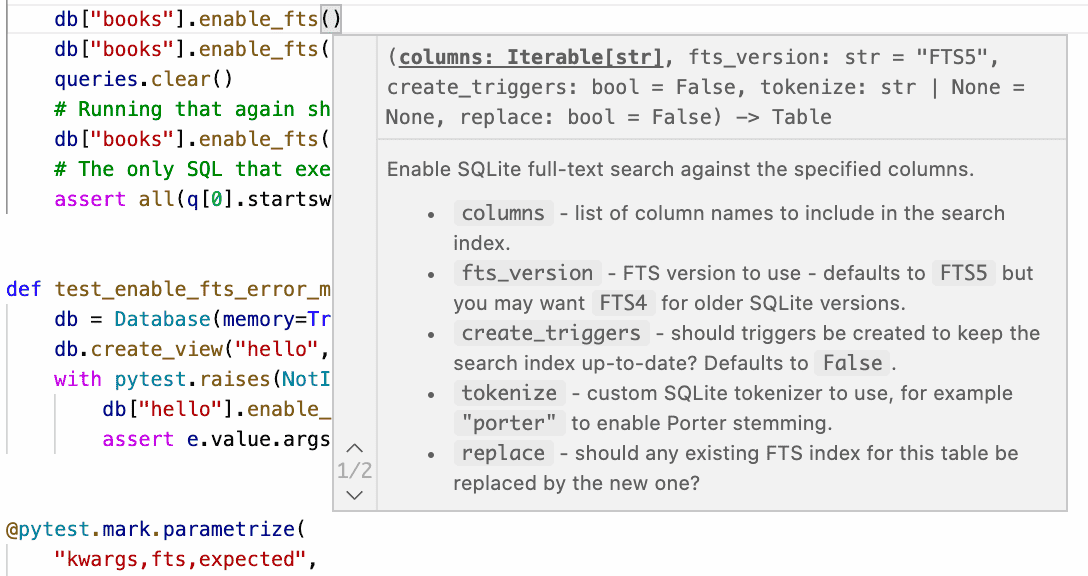
This week I broke my streak of not sending out the Datasette newsletter, figured out how to use Sphinx for Python class documentation, worked out how to run Datasette on GitHub Codespaces, implemented Datasette column metadata and got tantalizingly close to a solution for an elusive Datasette feature.
[... 2,164 words]Everything new in Datasette since January, plus Django SQL Dashboard. I sent out the first Datasette newsletter since late January this year, covering everything that’s new in Datasette and sqlite-utils this year and introducing Django SQL Dashboard.