13 posts tagged “profiling”
2024
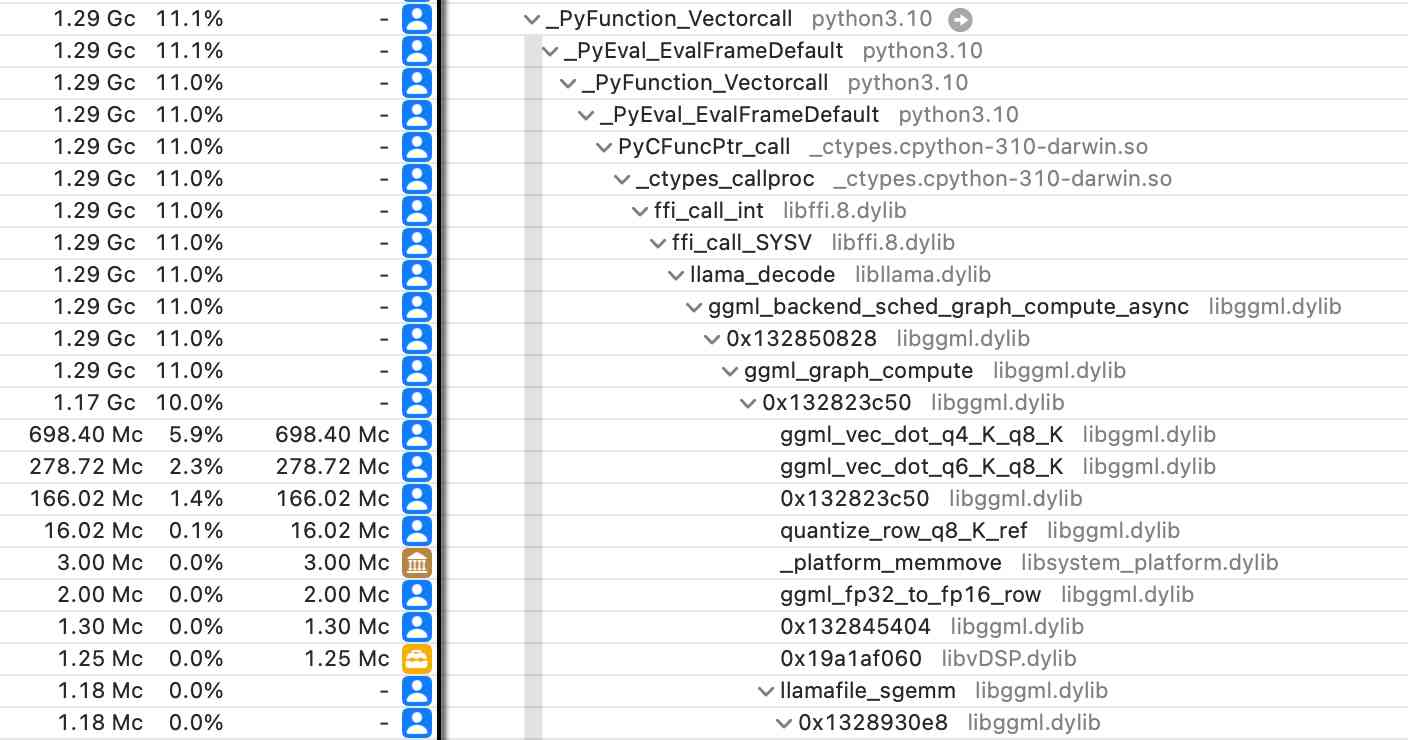
Did you know about Instruments? (via) Thorsten Ball shows how the macOS Instruments app (installed as part of Xcode) can be used to run a CPU profiler against any application - not just code written in Swift/Objective C.
I tried this against a Python process running LLM executing a Llama 3.1 prompt with my new llm-gguf plugin and captured this:
2022
Making Code Faster. Tim Bray’s detailed guide to using the Go profiler.
2021
How I cut GTA Online loading times by 70% (via) Incredible debugging war story: t0st was fed up of waiting six minutes (!) for GTA Online to load on their PC, so they used a host of devious debugging tricks to try and figure out what was going on. It turned out the game was loading a 10MB JSON file detailing all of the available in-game purchases, but inefficient JSON parsing meant it was pegging an entire CPU for 4 minutes mainly running the strlen() C function. Despite not having access to source code or debugging symbols t0st figured out the problem and managed to inject a custom DLL that hooked some internal functions and dropped load times down from 6m down to to 1m50s!
2019
Using memory-profiler to debug excessive memory usage in healthkit-to-sqlite. This morning I figured out how to use the memory-profiler module (and mprof command line tool) to debug memory usage of Python processes. I added the details, including screenshots, to this GitHub issue. It helped me knock down RAM usage for my healthkit-to-sqlite from 2.5GB to just 80MB by making smarter usage of the ElementTree pull parser.
2018
Using flamegraphs. I really like flamegraphs as a profiling tool—we have support for them baked into our Tikibar debugging toolbar at Eventbrite—but interpreting them isn’t particularly intuitive on first glance. Julia Evans has put together a great explanation of how to read them as part of the documentation for her rbspy Ruby profiler.
2017
profiling. “An interactive continuous Python profiler”. This is really neat—simply run “profiling myscript.py” to get an interactive, navigable console-based profile inspector at the end of your script... or run “profiling live-profile mywebverver.py” to see a live, updating profile of a long-running process. Has options for statistical profiling as well, which has a much lower overhead in exchange for a less accurate view of what is going on.
Building a statistical profiler in python. Generating flame graphs of production Python code is surprisingly straight-forward. Brian Pitts built a statistical flame graph profiler into our tikibar debugging tool at Eventbrite and it’s proved extremely useful.
2009
How to find un-indexed queries in MySQL, without using the log (via) Use tcpdump(!) to sniff the MySQL protocol and dump out queries that had the “no index used” bit set.
Building a Better JavaScript Profiler with WebKit. Clever hack from Francisco Tolmasky which solves the problem of JavaScript profilers showing ? as the name of any anonymous functions. He patched the WebKit profiler to look for a displayName attribute on a function and show that as the function name instead.
Heap Dump Analysis. Using jmap to dump the JVM’s memory to disk, then analysing it using the visualvm GUI tool.
2008
Using the New MySQL Query Profiler. Extremely powerful new feature in MySQL 5.0.37. Definitely something for the Django debug toolbar.
Deep Profiling jQuery Apps. Neat plugin from John Resig that monkey-patches most (all?) of the jQuery methods to build up a detailed profile of which methods are being used by a given page.
2007
YSlow: Bug (fix) in Firebug’s Net Panel. The latest release of the YSlow page analysis plugin (announced at FOWA) also fixes a misleading bug in Firebug’s Net panel.