Django SQL Dashboard
10th May 2021
I’ve released the first non-alpha version of Django SQL Dashboard, which provides an interface for running arbitrary read-only SQL queries directly against a PostgreSQL database, protected by the Django authentication scheme. It can also be used to create saved dashboards that can be published or shared internally.
I started building this tool back in March as part of my work to port VaccinateCA away from Airtable to a custom Django backend. One of the strengths of Airtable is that it allows ad-hoc data exploration and reporting, and I wanted to provide an alternative to that for the new Django backend.
I also wanted to try out some new ideas for Datasette, which doesn’t (yet) work with PostgreSQL.
First, a demo
I recorded this three minute video demo introducing the software, using my blog’s database as an example.
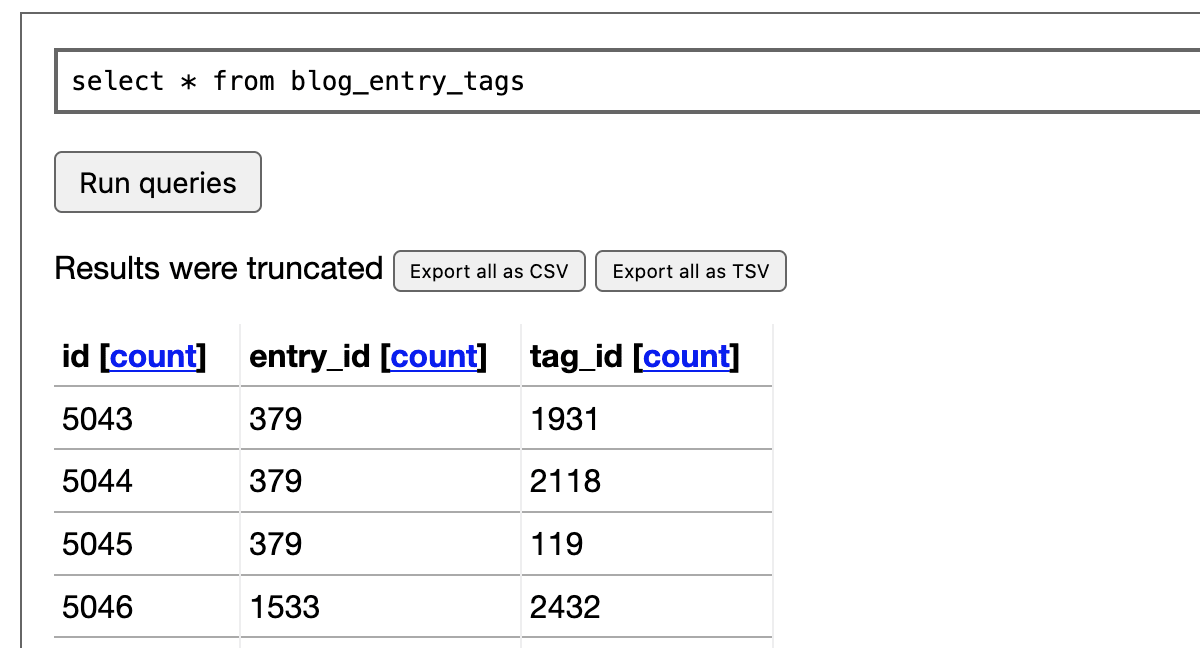
In the video I run the following SQL queries to explore the many-to-many table that maps tags to my blog entries:
select * from blog_entry_tags;The table starts out looking like this—not particularly interesting:
Then I run this query to join it against the blog_tag table and get the details of each tag:
select * from blog_entry_tags
join blog_tag on blog_tag.id = blog_entry_tags.tag_id
This is a bit more useful. I then click on the “count” link at the top of that “tag” column. This constructs a SQL query for me that uses a count(*) and group by to return a count of each value in that column:
select "tag", count(*) as n from (
  select * from blog_entry_tags
  join blog_tag on blog_tag.id = blog_entry_tags.tag_id
) as results group by "tag" order by n desc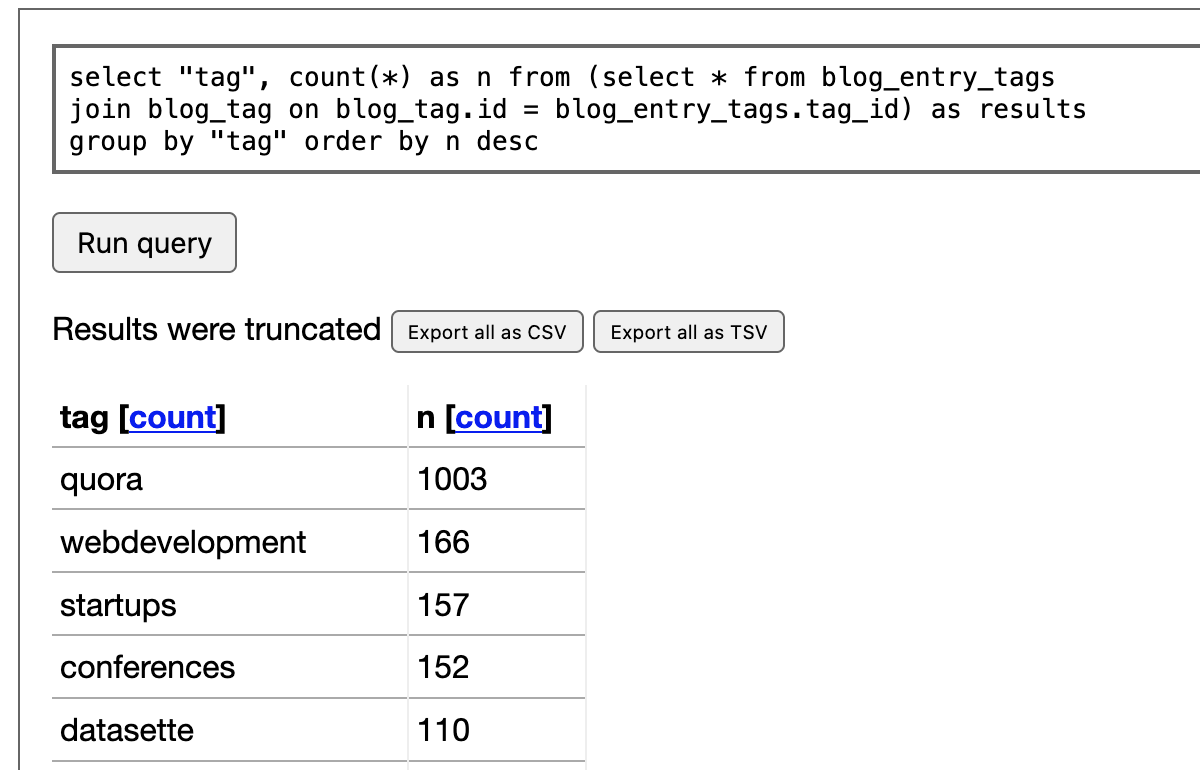
Then I demonstrate some of the default widget visualizations that come with Django SQL Dashboard. If I rewrite the query to return columns called bar_label and bar_quantity the tool will render the results as a bar chart:
select "tag" as bar_label, count(*) as bar_quantity from (
  select * from blog_entry_tags
  join blog_tag on blog_tag.id = blog_entry_tags.tag_id
) as results
group by "tag" order by bar_quantity desc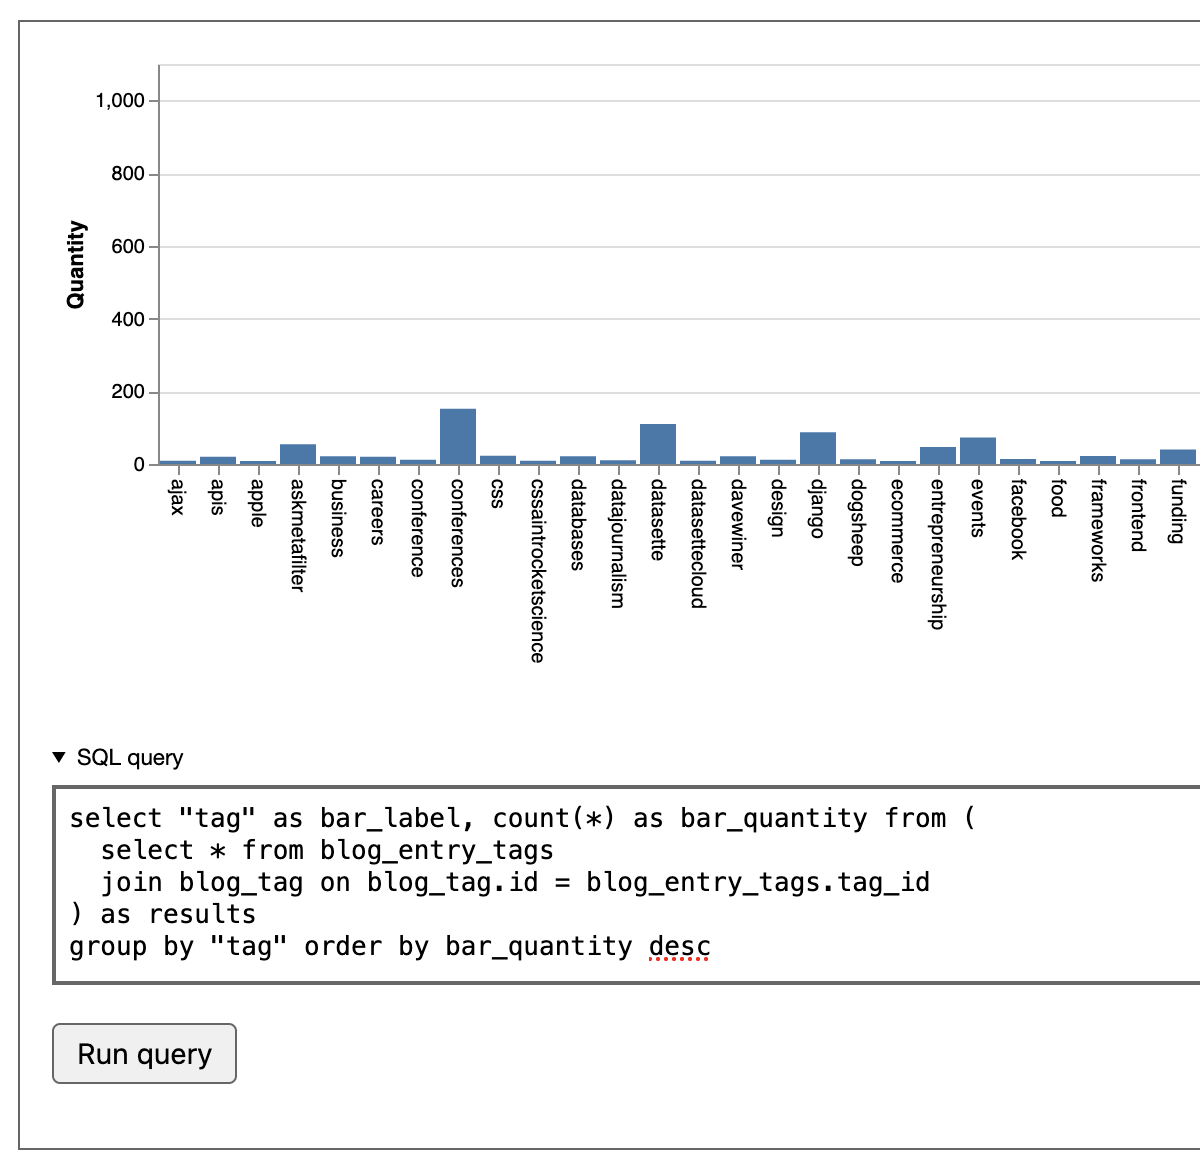
Next, I demonstrate a similar trick that instead produces a word cloud by aliasing the columns to wordcloud_word and wordcloud_count:
select "tag" as wordcloud_word, count(*) as wordcloud_count from (
  select * from blog_entry_tags
  join blog_tag on blog_tag.id = blog_entry_tags.tag_id
) as results
group by "tag" order by wordcloud_count desc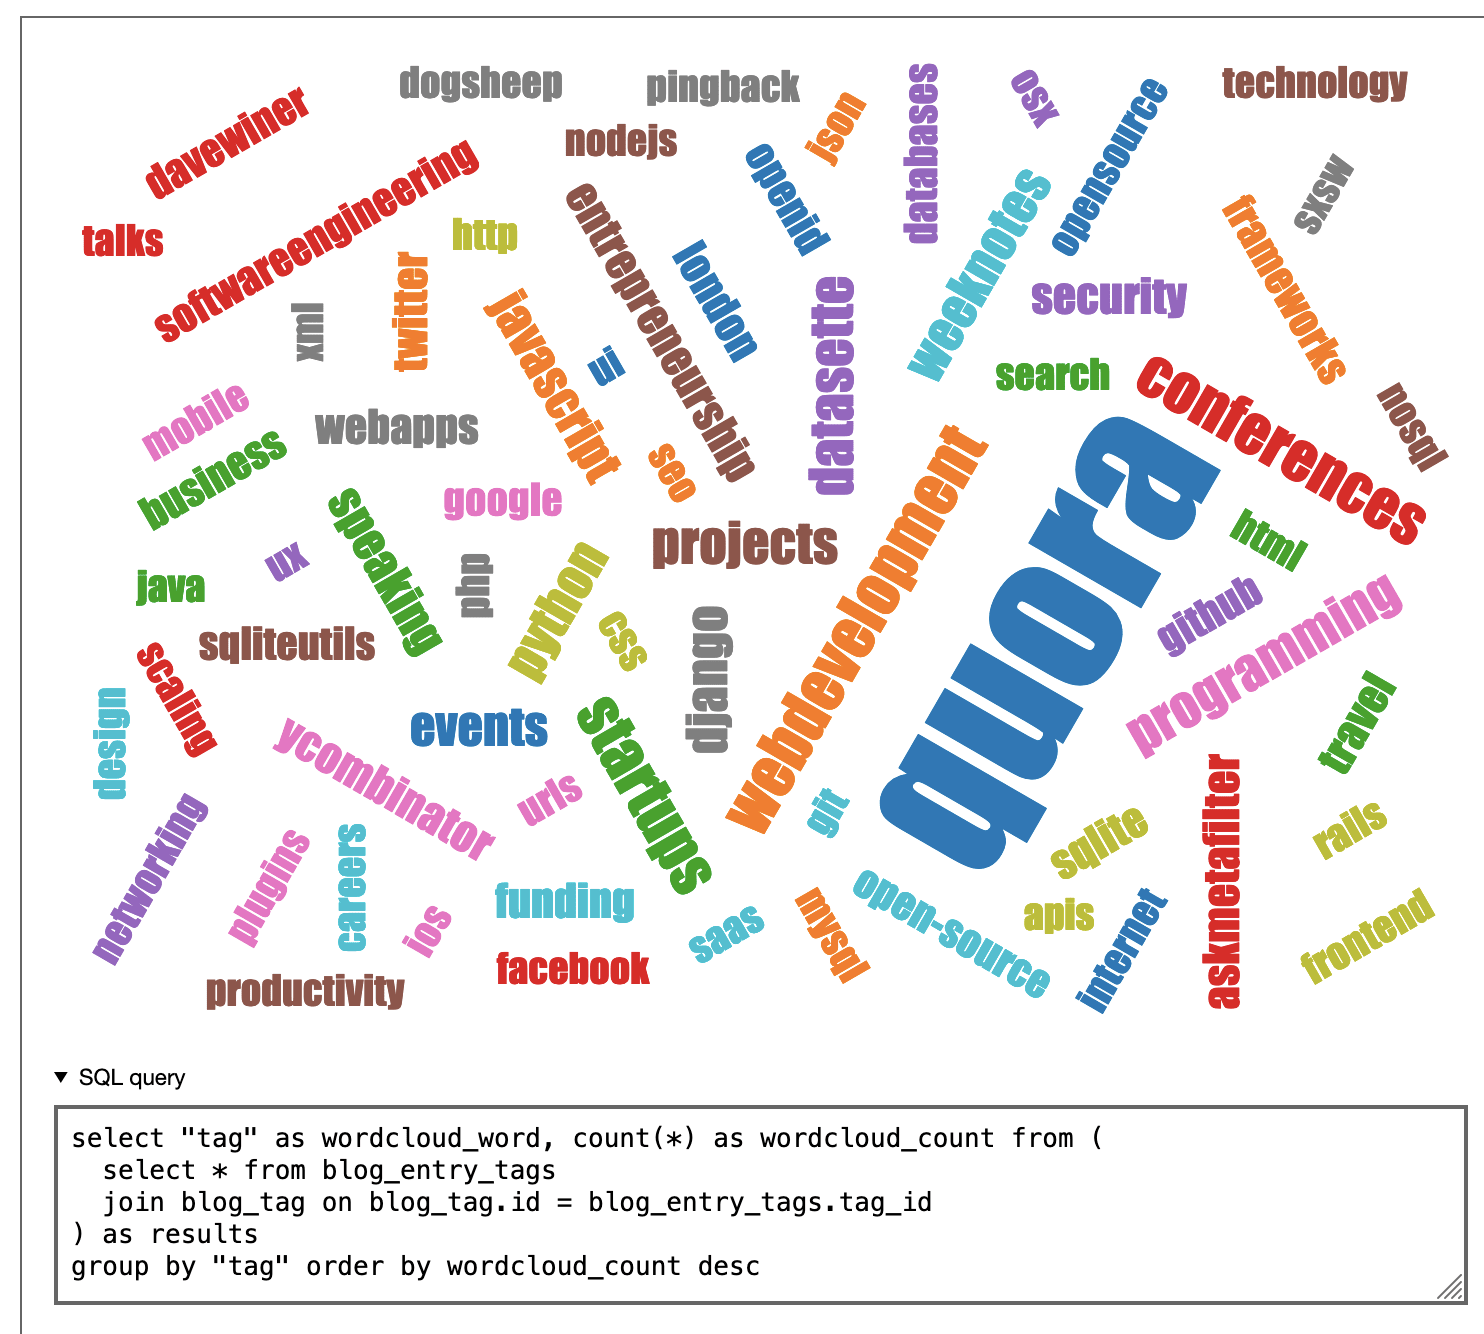
Finally, I show how that query can be turned into a saved dashboard and made available to the public. Here’s the saved dashboard I created in the video:
https://simonwillison.net/dashboard/tag-cloud/
This illustrates a key idea underlying both Django SQL dashboard and Datasette: a complete application can be defined as a SQL query!
Much of the work we do as web application developers can be boiled down to constructing a SQL query and hooking it up to output to a web page. If you can safely execute SQL queries from page query strings this means you can build custom applications that exist entirely as bookmarkable URLs.
My draw-a-shape-on-a-map application for searching mini parks in California from a few months ago is another example of this pattern in action.
Custom widgets
Building new custom widgets for this tool is extremely easy—hence the word cloud widget which I actually built specially for this demo. All you need to provide is a single Django template file.
If your widget is going to respond to returned columns wordcloud_word and wordcloud_count the name of that template is those columns, sorted alphabetically and joined with hyphens:
wordcloud_count-wordcloud_word.html
Place that in a django_sql_dashboard/widgets template directory and the new widget will be ready to use. Here’s the full implementation of the word cloud widget.
Named parameter support
This is a feature I lifted directly from Datasette. You can construct SQL queries that look like this:
select * from blog_entry where id = %(id)sThis uses psycopg2 syntax for named parameters. The value will be correctly quoted and escaped, so this is a useful tool for avoiding SQL injection attacks.
Djang SQL Dashboard spots these parameters and turns them into form fields. Here’s what that looks like in the interface:
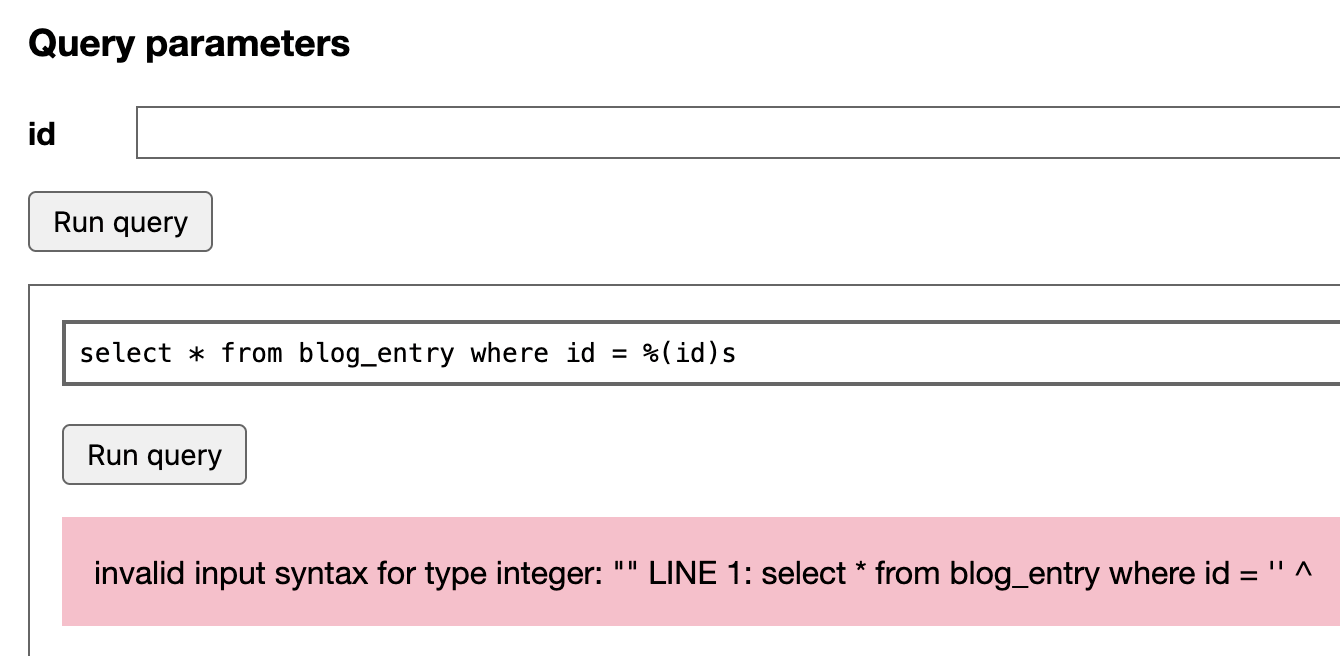
These forms submit using GET, so the result can be bookmarked. Here’s a saved dashboard you can use to retrieve the details of any of my blog entries by their numeric ID:
https://simonwillison.net/dashboard/blog-entry-by-id/?id=7991
You can include multiple SQL parameters on a single dashboard, and any form parameters will be made available to all of those queries.
This means you can build dashboards that run multiple queries against the same arguments. Imagine for example you want to build a report about a specific user’s activity across multiple tables—you can accept their user ID as a parameter, then display the output of multiple queries (including custom visualizations) that each refer to that parameter.
Export through copy and paste
I love copy and paste as a mechanism for exporting data from a system. Django SQL Dashboard embraces this in a couple of ways:
- Results from SQL queries can be copied out as TSV from an expandable textarea below the table—up to 1,000 rows. I like this format because you can paste it directly into Google Sheets or Excel to get the data correctly split into cells.
- Any time JSON is returned as a value from PostgreSQL, a “copy to clipboard” icon is shown next to the JSON. I use this a lot: both for JSON stored in PostgreSQL as well as the output from JSON aggregation functions.
Export all query results as CSV/TSV
This comes up a lot at Vaccinate CA: we do a lot of data analysis where we need to work with other tools or send data to partners, and having a way to export the full set of results for a query (rather than truncating at the first thousand to avoid crashing the user’s browser) was a frequent need.—Django SQL Dashboard provides this option using a combination of Django’s streaming HTTP response mechanism and PostgreSQL server-side cursors to efficiently stream large amounts of data without running out of resources.
A complex example: searching code examples across my blog
I decided to see how far I could push PostgreSQL.
I often include code in my blog entries—examples that are wrapped in a <pre> tag. Within that tag I sometimes apply syntax highlighting (a bunch of <span> elements).
It turns out I’ve included code snippets in 134 different blog entries:
select count(*) from blog_entry where body ~ '<pre>.*<pre>'Can I use regular expressions in PostgreSQL to extract just the code examples, clean them up (removing those spans, reversing HTML entity encoding) and then provide simple search across the text of those examples, all in one query?
It turns out I can!
Here’s a saved dashboard you can use to execute searches against just the contents of those <pre> tags across every entry on my blog:
https://simonwillison.net/dashboard/code-examples/?search=select
with results_stripped as (
select id, title,
replace(replace(replace(replace(replace(regexp_replace(
(regexp_matches(body, '<pre>(.*?)</pre>', 'g'))[1],
E'<[^>]+>', '', 'gi'
), '"' || chr(59), '"'), '>' || chr(59), '>'), '<' || chr(59), '<'), ''' || chr(59), chr(39)), '&' || chr(59), '&'
) as code
from
blog_entry
where
body ~ '<pre>.*<pre>'
)
select id, title, code, 'https://simonwillison.net/e/' || id as link from results_stripped
where code like '%%' || %(search)s || '%%' limit 10There’s a lot going on here. The key component is this bit:
regexp_matches(body, '<pre>(.*?)</pre>', 'g'))[1]
The regexp_matches() function, with the 'g' flag, returns every match for the given regular expression. As part of a larger select query this means that if the expression matches three times you’ll get back three rows in the output (in this case with duplicate id and title columns)—which is what I want here.
It’s wrapped in a terrifying nest of extra functions. These serve two purposes: they strip out any nested HTML tags, and the un-escape the ", <, >, & and ' HTML entities. I did this as a nested block of replace() functions—there’s probably a neater solution here.
The chr(59) bits are a hack: Django SQL Dashboard disallows the ; character to ensure people can’t execute multiple SQL queries—which could be used to work around some of the per-transaction protective settings applied by the tool.
But I need to search-and-replace "—so I use this pattern to include the semicolon:
replace(text, '"' || chr(59), '"')
Where || is the PostgreSQL string concatenation operator.
The search itself is constructed like this:
where code like '%%' || %(search)s || '%%'
This constructs a like query against '%your-search-term%'—the double percentage sign escaping is needed because % has a special meaning here (it’s part of the %(search)s named parameter).
One last trick: the final output of the query is produced by this:
select id, title, code, 'https://simonwillison.net/e/' || id as link from results_strippedresults_stripped is a CTE defined earlier—I usually try to wrap up complex weird stuff like those nested replace() calls in a CTE so I can write a simple final query.
The 'https://simonwillison.net/e/' || id as link bit here concatenates together a URL that links to my entry based on its ID. My blog uses /yyyy/Mon/slug/ URLs but generating these from a SQL query against the created column was a little fussy, so I added /e/ID redirecting URLs to make generating links in dashboard queries easier.
Future plans
Django SQL Dashboard has already proved itself invaluable for my current project. I imagine I’ll be using it for every Django project I build going forward—being able to query the database like this, create ad-hoc visualizations and then link to them is a huge productivity boost.
The bigger question is how it overlaps with Datasette.
Datasette has been SQLite-only since I started the project three and a half years ago—because I know that building a database abstraction layer is a huge additional commitment and, for Datasette’s initial purpose of helping publish read-only data, it didn’t feel necessary.
I have a growing suspicion that getting Datasette to work against PostgreSQL (and other database backends) in addition to SQLite is less work than I had originally thought.
Datasette is also built on top of ASGI. Django 3.0 introduced ASGI support, so it’s now possible to host ASGI applications like Datasette as part of a unified Django application.
So it’s possible that the future of Django SQL Dashboard will be for Datasette to eventually make it obsolete.
That doesn’t stop it from being extremely useful today. If you try it out I’d love to hear from you! I’m also keen to see people start to expand it for their own projects, especially via the custom widgets mechanism.
Let me know if you try it out!
TIL this week
Releases this week
-
django-sql-dashboard: 0.12—(22 releases total)—2021-05-08
Django app for building dashboards using raw SQL queries
More recent articles
- Phoenix.new is Fly's entry into the prompt-driven app development space - 23rd June 2025
- Trying out the new Gemini 2.5 model family - 17th June 2025
- The lethal trifecta for AI agents: private data, untrusted content, and external communication - 16th June 2025