5 posts tagged “opentelemetry”
2026
I saw Parseable in a Show HN today - it's a new observability platform with both an open source (AGPL) Rust implementation (a single ~180MB binary), an "Enterprise" version with extra features and a cloud hosted option.
Since Datasette 1.0a41 added OpenTelemetry support (thanks, Alex Garcia), I decided to fire up Codex and have it figure out how to run Parseable and feed it traces from Datasette.
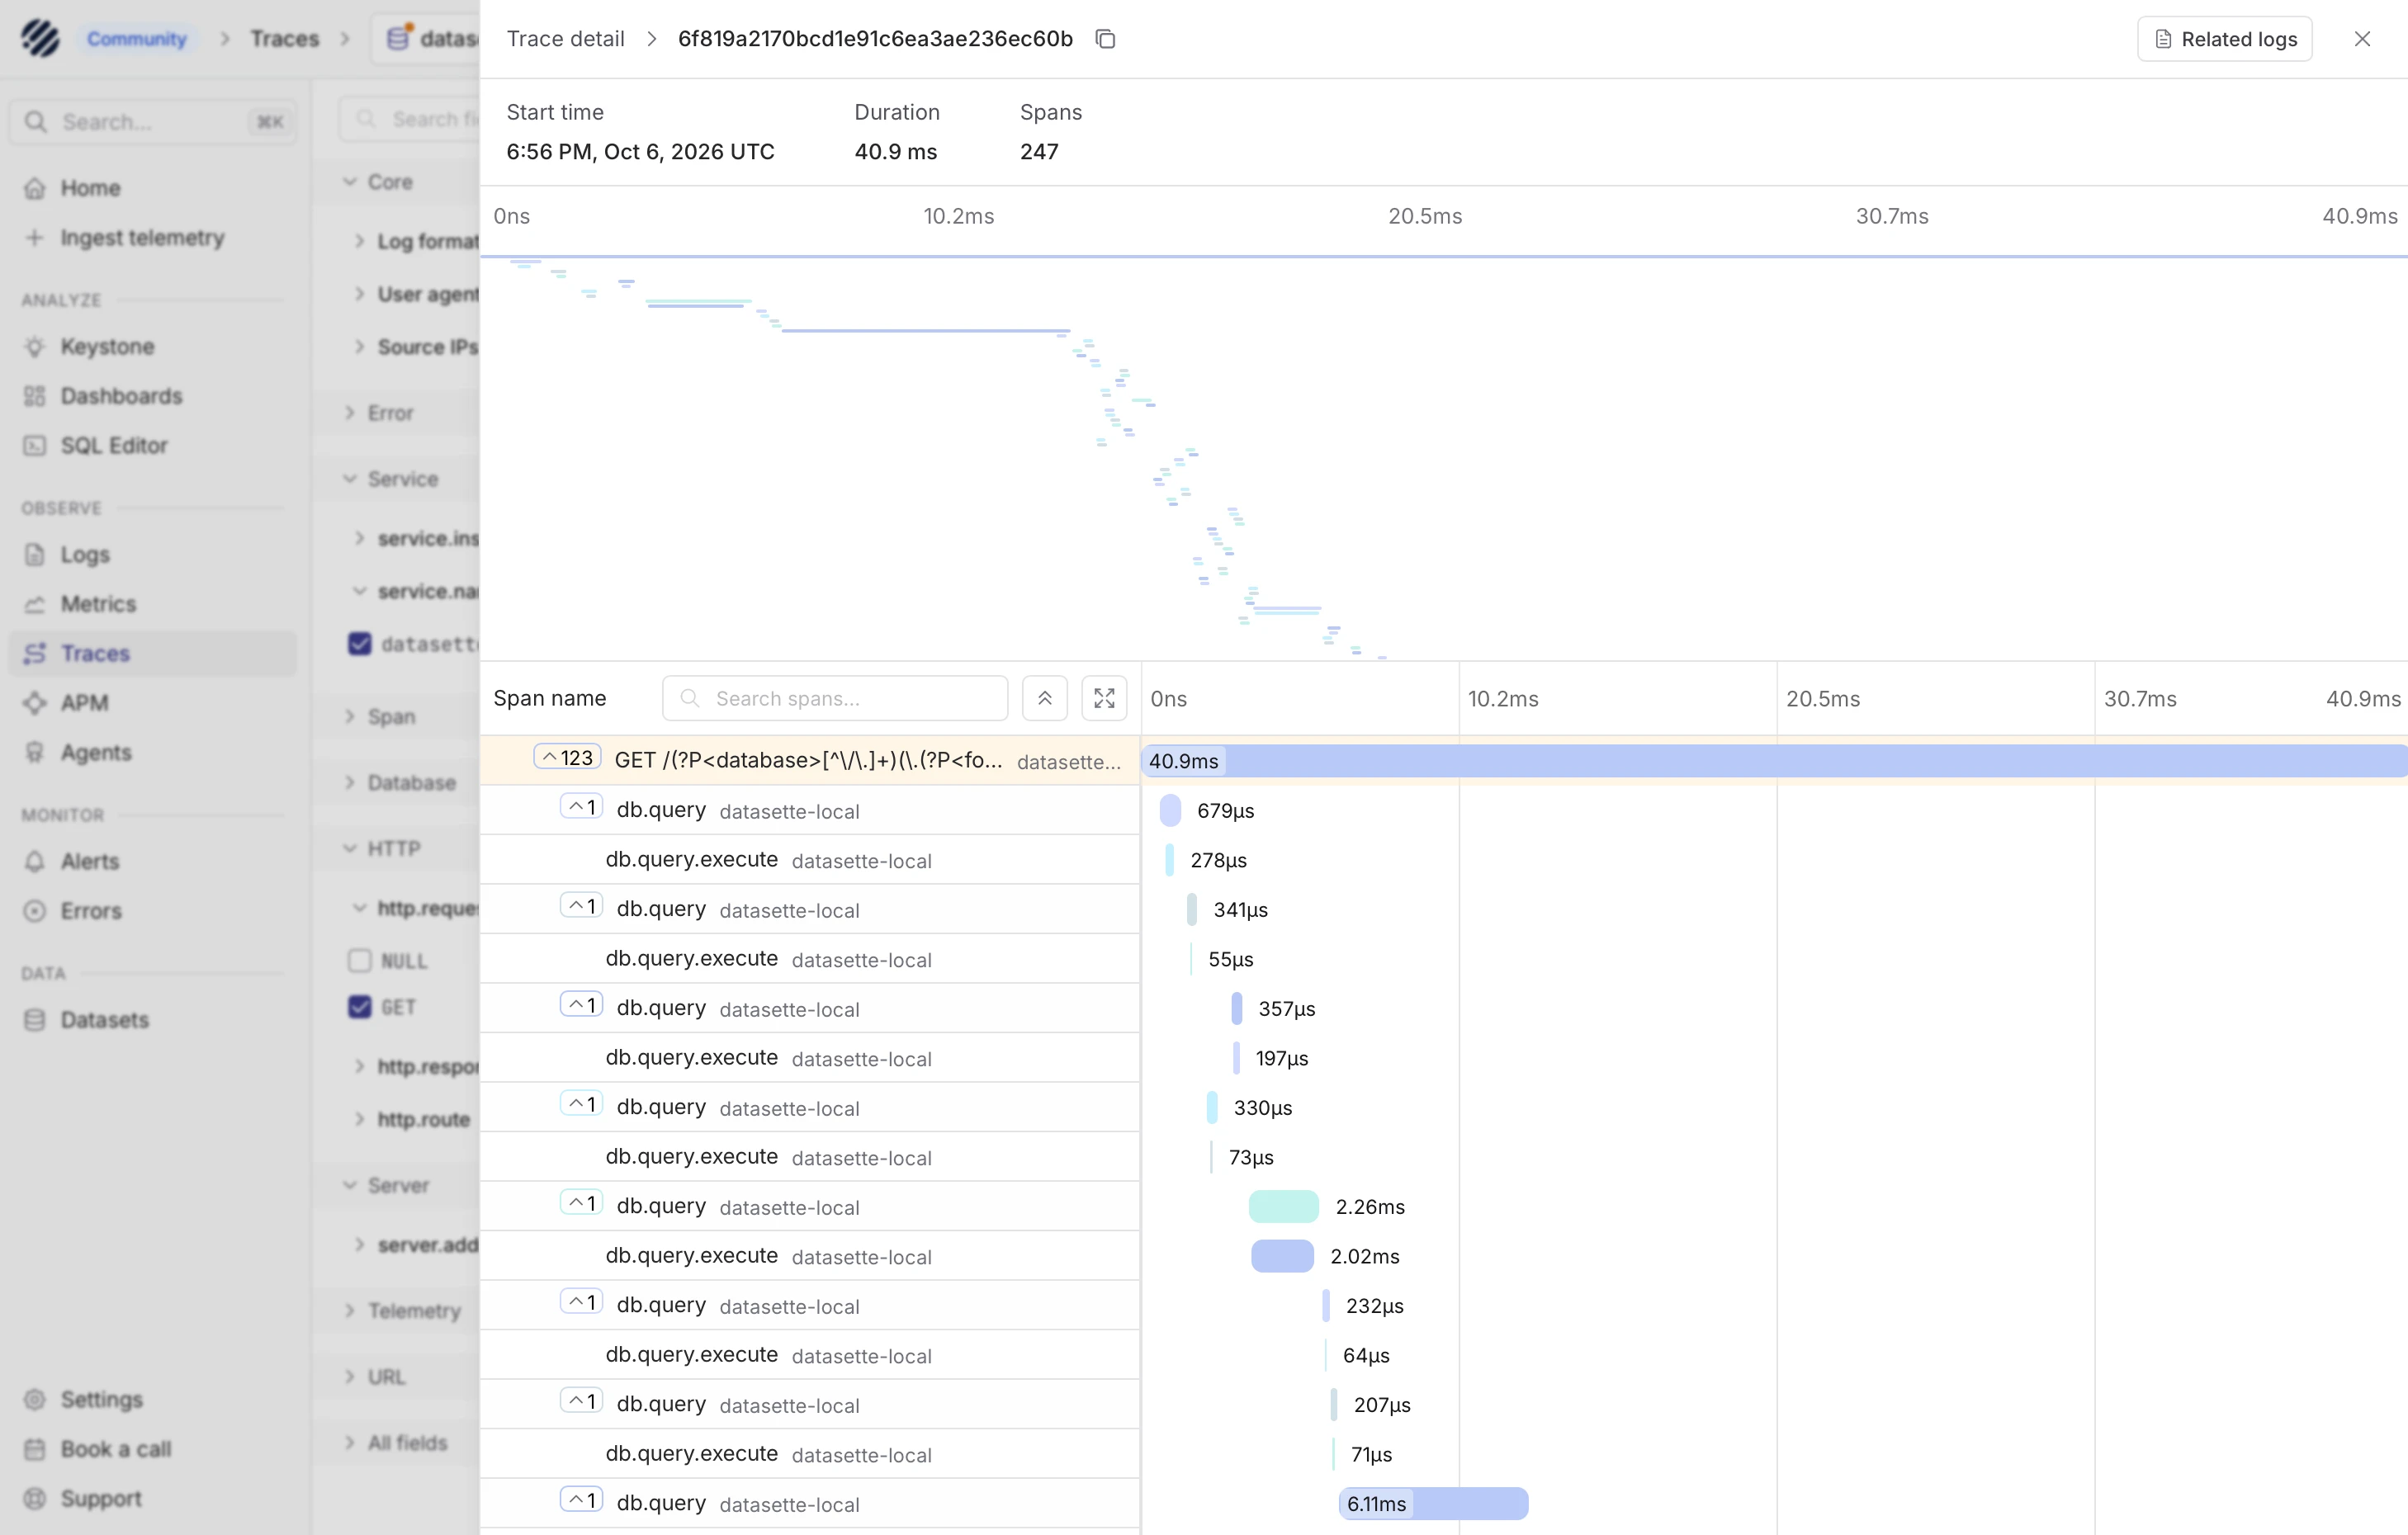
Here's my (human-written) TIL showing the patterns that worked, and here's a screenshot of a Datasette trace displayed within the Parseable localhost web application:
Alec Garcia added support for OpenTelemetry to Datasette in this release.
I've also refactored all of Datasette's modal dialogs to a single Web Component, which is now documented for other plugins to use.
Introducing wrapture. New from Graham Dumpleton (of wrapt, mod_wsgi, and New Relic's Python agent fame), who describes Wrapture as taking the monkeypatching ideas from wrapt and extending them to apply to testing and tracing at the same time.
Wrapture (full documentation here) makes it easy to wrap any function or method such that all access can be traced, or can be overridden to return a different value.
It acts as both an alternative to unittest.mock and a way to implement tracing against an existing project:
Attaching observation to code you do not control, recording what flows through it, and doing so without disturbing the program being watched, is a problem I have never really stopped thinking about.
Wrapture includes OpenTelemetry support and even has an entirely configuration-based mechanism for adding tracing to an existing Python project, which looks like this:
capture = "summary"

[[observe]]
target = "domain:Calculator"
name = ["outer", "inner"]

[[sink]]
type = "jsonlines"
path = "trace.jsonl"
This is still a very young project - just a few weeks old - but it's off to a very promising start.
Interestingly, this is also Graham's first attempt at large entirely agent-driven project:
Every line of code and documentation in wrapture was written by an AI assistant working under my direction. I want to be upfront about that, and equally upfront about what it was not. This was not vibe coding, where a one-shot prompt produces a pile of generated code and the person driving hopes for the best because they lack the knowledge to judge what came back. Vibe coding has earned its bad reputation. I engineered wrapture carefully from the start. I have spent a long time in this particular corner of Python and knew exactly what the result needed to be, and the AI was the means of producing it rather than the source of the design.
In a follow-up post, Unit testing with wrapture, Graham shows the testing patterns supported by the new library:
def test_stub_with_wrapture():
    with wrapture.binding(
        Gateway, "charge"
    ).on_call.returns({
        "id": "stub", "amount": 0}
    ):
        assert OrderService().place(
            500
        )["id"] == "stub"
And this neat example of a test that calls and then modifies the return value from the original method:
def test_pinned_result_with_wrapture():
    charge = wrapture.binding(
        Gateway, "charge"
    )
    charge.on_call.transforms_result(
        lambda r: {**r, "id": "ch_TEST"}
    )
    with charge:
        assert OrderService().place(
           500
        ) == {
            "id": "ch_TEST", "amount": 500
        }
(In both of these examples the OrderService().place(...) method calls Gateway().charge(...).)
2024
Mermaid Gantt diagrams are great for displaying distributed traces in Markdown.
Bryce Mecum demonstrates how Mermaid gantt diagrams can be used to render trace information, such as the traces you might get from OpenTelemetry. I tried this out in a Gist and it works really well - GitHub Flavored Markdown will turn any fenced code block tagged mermaid containing a gantt definition into a neat rendered diagram.
All you need is Wide Events, not “Metrics, Logs and Traces” (via) I’ve heard great things about Meta’s internal observability platform Scuba, here’s an explanation from ex-Meta engineer Ivan Burmistrov describing the value it provides and comparing it to the widely used OpenTelemetry stack.