Optimizing Datasette (and other weeknotes)
22nd August 2024
I’ve been working with Alex Garcia on an experiment involving using Datasette to explore FEC contributions. We currently have a 11GB SQLite database—trivial for SQLite to handle, but at the upper end of what I’ve comfortably explored with Datasette in the past.
This was just the excuse I needed to dig into some optimizations! The next Datasette alpha release will feature some significant speed improvements for working with large tables—they’re available on the main branch already.
Datasette tracing
Datasette has had a ?_trace=1 feature for a while. It’s only available if you run Datasette with the trace_debug setting enabled—which you can do like this:
datasette -s trace_debug 1 mydatabase.dbThen any request with ?_trace=1 added to the URL will return a JSON blob at the end of the page showing every SQL query that was executed, how long it took and a truncated stack trace showing the code that triggered it.
Scroll to the bottom of https://latest.datasette.io/fixtures?_trace=1 for an example.
The JSON isn’t very pretty. datasette-pretty-traces is a plugin I built to fix that—it turns that JSON into a much nicer visual representation.
As I dug into tracing I found a nasty bug in the trace mechanism. It was meant to quietly give up on pages longer than 256KB, in order to avoid having to spool potentially megabytes of data into memory rather than streaming it to the client. That code had a bug: the user would get a blank page instead! I fixed that first.
The next problem was that SQL queries that terminated with an error—including the crucial “query interrupted” error raised when a query took longer than the Datasette configured time limit—were not being included in the trace. That’s fixed too, and I upgraded datasette-pretty-traces to render those errors with a pink background:
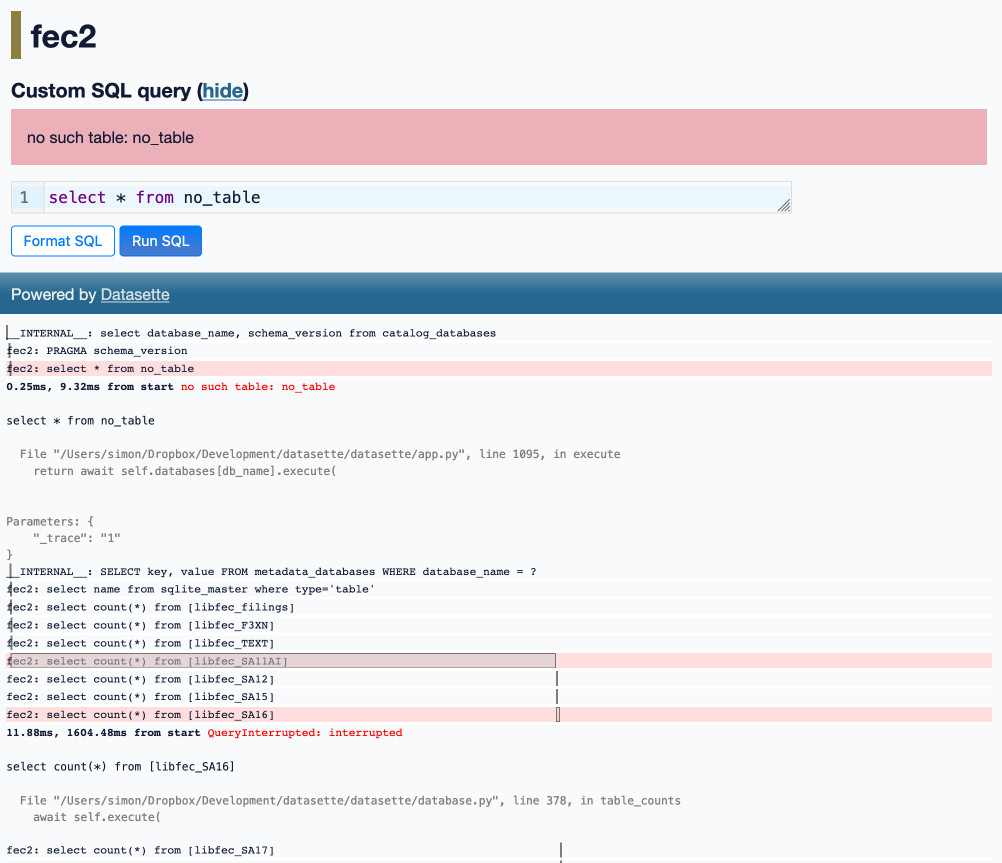
This gave me all the information I needed to track down those other performance problems.
Rule of thumb: don’t scan more than 10,000 rows
SQLite is fast, but you can still run into performance problems if you ask it to scan too many rows.
Going forward, I’m introducing a new target for Datasette development: never scan more than 10,000 rows without a user explicitly requesting that scan.
The most common time this happens is with a select count(*) query. Datasette likes to display the number of rows in a table, and when you run a SQL query it likes to show you how many total rows match even when only displaying a subset of them in the paginated interface.
These counts are shown in two key places: on the list of tables in a database, and on the table view itself.
Counts are protected by Datasette’s query time limit mechanism. On the table listing page this was configured such that if a count takes longer than 5ms it would be skipped and “Many rows” would be displayed. It turns out this mechanism isn’t as reliable as I had hoped, maybe due to the overhead of cancelling the query. Given enough large tables those cancelled count queries could still add up to user-visible latency problems on that page.
Here’s the pattern I turned to that fixed the performance problem:
select count(*) from (
    select * from libfec_SA16 limit 10001
)
This nested query first limits the table to 10,001 rows, then counts them. If the count is less than 10,001 we know that the count is entirely accurate. If it’s exactly 10,001 we can show “>10,000 rows” in the UI.
Capping the number of scanned rows to 10,000 for any of these counts makes a huge difference in the performance of these pages!
But what about those table pages? Showing “>10,000 rows” is a bit of a cop-out, especially if the question the user wants to answer is “how many rows are in this table / match this filter?”
I addressed that in issue #2408: Datasette still truncates the count at 10,000 on initial page load, but users now get a “count all” link they can click to execute the full count.
The link goes to a SQL query page that runs the query, but I’ve also added a bit of progressive enhancement JavaScript to run that query and update the page in-place when the link is clicked. Here’s what that looks like:
In the future I may add various caching mechanisms so that counts that have been calculated can be displayed elsewhere in the UI without having to re-run the expensive queries. I may also incorporate SQL triggers for updating exact denormalized counts in a _counts table, as implemented in sqlite-utils.
Optimized facet suggestions
The other feature that was really hurting performance was facet suggestions.
Datasette Facets are a really powerful way to quickly explore data. They can be applied to any column by the user, but to make the feature more visible Datasette suggests facets that might be a good fit for the current table by looking for things like columns that only contain 3 unique values.
The suggestion code was designed with performance in mind—it uses tight time limits (governed by the facet_suggest_time_limit_ms setting, defaulting to 50ms) and attempts to use other SQL tricks to quickly decide if a facet should be considered or not.
I found a couple of tricks to dramatically speed these up against larger tables as well.
First, I’ve started enforcing that new 10,000 limit for facet suggestions too—so each suggestion query only considers a maximum of 10,000 rows, even on tables with millions of items. These suggestions are just suggestions, so seeing a recommendation that would not have been suggested if the full table had been scanned is a reasonable trade-off.
Secondly, I spotted a gnarly bug in the way the date facet suggestion works. The previous query looked like this:
select date(column_to_test) from (
    select * from mytable
)
where column_to_test glob "????-??-*"
limit 100;
That limit 100 was meant to restrict it to considering 100 rows... but that didn’t actually work! If a table with 20 million columns in had NO rows that matched the glob pattern, the query would still scan all 20 million rows.
The new query looks like this, and fixes the problem:
select date(column_to_test) from (
    select * from mytable limit 100
)
where column_to_test glob "????-??-*"
Moving the limit to the inner query causes the SQL to only run against the first 100 rows, as intended.
Thanks to these optimizations running Datasette against a database with huge tables now feels snappy and responsive. Expect them in an alpha release soon.
On the blog
I’m trying something new for the rest of my weeknotes. Since I’m investing a lot more effort in my link blog, I’m including a digest of everything I’ve linked to since the last edition. I updated my weeknotes Observable notebook to help generate these, after prompting Claude to help prototype a bunch of different approaches.
The following section was generated by this code—it includes everything I’ve posted, grouped by the most “interesting” tag assigned to each post. I’ll likely iterate on this a bunch more in the future.
openai
- OpenAI: Introducing Structured Outputs in the API—2024-08-06
- GPT-4o System Card—2024-08-08
- Using sqlite-vec with embeddings in sqlite-utils and Datasette—2024-08-11
javascript
- Observable Plot: Waffle mark—2024-08-06
- Reckoning—2024-08-18
python
- cibuildwheel 2.20.0 now builds Python 3.13 wheels by default—2024-08-06
- django-http-debug, a new Django app mostly written by Claude—2024-08-08
- PEP 750 – Tag Strings For Writing Domain-Specific Languages—2024-08-11
- mlx-whisper—2024-08-13
- Upgrading my cookiecutter templates to use python -m pytest—2024-08-17
- Writing your pyproject.toml—2024-08-20
- uv: Unified Python packaging—2024-08-20
- #!/usr/bin/env -S uv run—2024-08-21
- Armin Ronacher: There is an elephant in the room which is that As...—2024-08-21
- light-the-torch—2024-08-22
security
- Google AI Studio data exfiltration demo—2024-08-07
- SQL Injection Isn’t Dead: Smuggling Queries at the Protocol Level—2024-08-12
- Links and materials for Living off Microsoft Copilot—2024-08-14
- Adam Newbold: [Passkeys are] something truly unique, because ba...—2024-08-15
- com2kid: Having worked at Microsoft for almost a decade, I...—2024-08-16
- Data Exfiltration from Slack AI via indirect prompt injection—2024-08-20
- SQL injection-like attack on LLMs with special tokens—2024-08-20
- The dangers of AI agents unfurling hyperlinks and what to do about it—2024-08-21
llm
- q What do I title this article?—2024-08-07
prompt-engineering
- Braggoscope Prompts—2024-08-07
- Using gpt-4o-mini as a reranker—2024-08-11
- LLMs are bad at returning code in JSON—2024-08-16
andrej-karpathy
projects
- Share Claude conversations by converting their JSON to Markdown—2024-08-08
- Datasette 1.0a15—2024-08-16
- datasette-checkbox—2024-08-16
- Fix @covidsewage bot to handle a change to the underlying website—2024-08-18
anthropic
- Gemini 1.5 Flash price drop—2024-08-08
- Prompt caching with Claude—2024-08-14
- Alex Albert: Examples are the #1 thing I recommend people use ...—2024-08-15
- Introducing Zed AI—2024-08-20
sqlite
- High-precision date/time in SQLite—2024-08-09
- New Django {% querystring %} template tag—2024-08-13
ethics
- Where Facebook’s AI Slop Comes From—2024-08-10
jon-udell
browsers
- Ladybird set to adopt Swift—2024-08-11
explorables
- Transformer Explainer—2024-08-11
ai-assisted-programming
hacker-news
design
- Help wanted: AI designers—2024-08-13
prompt-injection
- A simple prompt injection template—2024-08-14
fly
- Fly: We’re Cutting L40S Prices In Half—2024-08-16
open-source
- Whither CockroachDB?—2024-08-16
game-design
- “The Door Problem”—2024-08-18
whisper
- llamafile v0.8.13 (and whisperfile)—2024-08-19
go
- Migrating Mess With DNS to use PowerDNS—2024-08-19
Releases
-
datasette-pretty-traces 0.5—2024-08-21
Prettier formatting for ?_trace=1 traces -
sqlite-utils-ask 0.1a0—2024-08-19
Ask questions of your data with LLM assistance -
datasette-checkbox 0.1a2—2024-08-16
Add interactive checkboxes to columns in Datasette -
datasette 1.0a15—2024-08-16
An open source multi-tool for exploring and publishing data -
asgi-csrf 0.10—2024-08-15
ASGI middleware for protecting against CSRF attacks -
datasette-pins 0.1a3—2024-08-07
Pin databases, tables, and other items to the Datasette homepage -
django-http-debug 0.2—2024-08-07
Django app for creating endpoints that log incoming request and return mock data
TILs
More recent articles
- Mr. Chatterbox is a (weak) Victorian-era ethically trained model you can run on your own computer - 30th March 2026
- Vibe coding SwiftUI apps is a lot of fun - 27th March 2026
- Experimenting with Starlette 1.0 with Claude skills - 22nd March 2026