Visualizing local election results with Datasette, Observable and MapLibre GL
9th November 2024
Alex Garcia and myself hosted the first Datasette Open Office Hours on Friday—a live-streamed video session where we hacked on a project together and took questions and tips from community members on Discord.
We didn’t record this one (surprisingly not a feature that Discord offers) but we hope to do more of these and record them in the future.
This post is a detailed write-up of what we built during the session.
- San Mateo County election results
- Importing CSV data into Datasette
- Modifying the schema
- Faceting and filtering the table
- Importing geospatial precinct shapes
- Enriching that data to extract the precinct IDs
- Running a join
- Creating an API token to access the data
- Getting CORS working
- Working with Datasette in Observable
- Visualizing those with MapLibre GL
- Observable Plot
- Bringing it all together
- We’ll be doing this again
San Mateo County election results
I live in El Granada, a tiny town just north of Half Moon Bay in San Mateo County, California.
Every county appears to handle counting and publishing election results differently. For San Mateo County the results are published on this page, and detailed per-precinct and per-candidate breakdowns are made available as a CSV file.
(I optimistically set up a Git scraper for these results in simonw/scrape-san-mateo-county-election-results-2024 only to learn that the CSV is updated just once a day, not continually as the ballots are counted.)
I’m particularly invested in the results of the Granada Community Services District board member elections. Our little town of El Granada is in “unincorporated San Mateo County” which means we don’t have a mayor or any local officials, so the closest we get to hyper-local government is the officials that run our local sewage and parks organization! My partner Natalie ran the candidate forum event (effectively the debate) featuring three of the four candidates running for the two open places on the board.
Let’s explore the data for that race using Datasette.
Importing CSV data into Datasette
I ran my part of the demo using Datasette Cloud, the beta of my new hosted Datasette service.
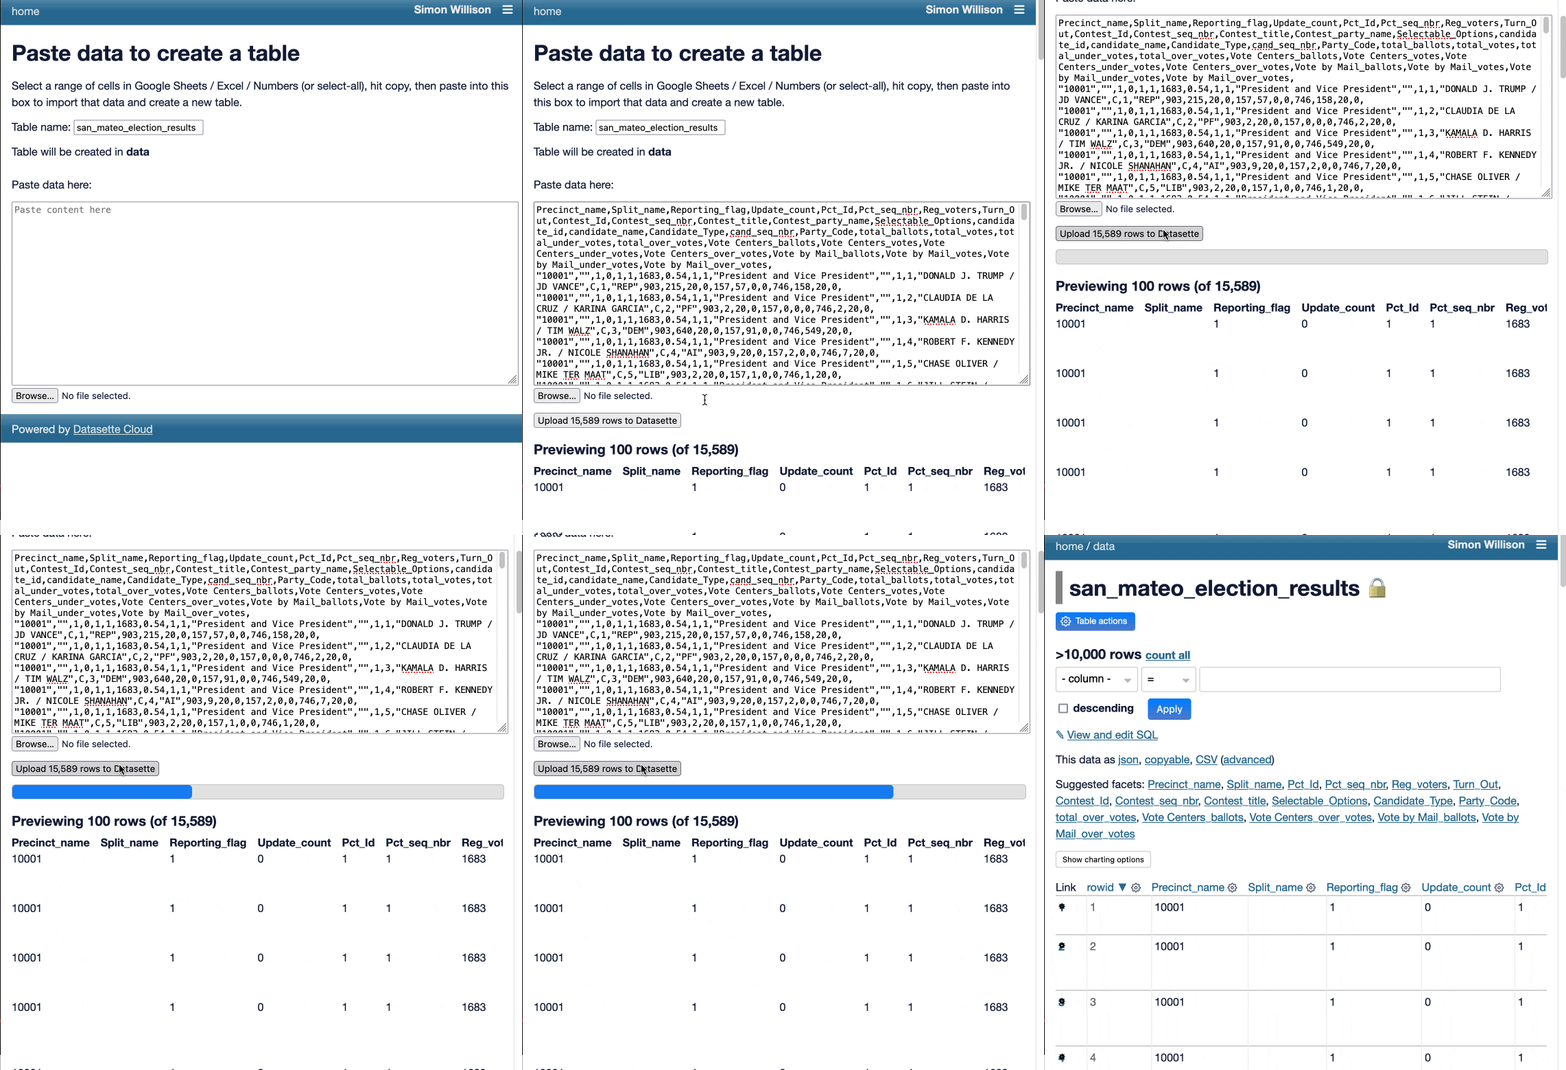
I started by using the pre-configured datasette-import plugin to import the data from the CSV file into a fresh table:
Modifying the schema
The table imported cleanly, but all of the columns from the CSV were still being treated as text. I used the datasette-edit-schema plugin to switch the relevant columns to integers so that we could run sums and sorts against them.
(I also noted that I really should add a “detect column types” feature to that plugin!)
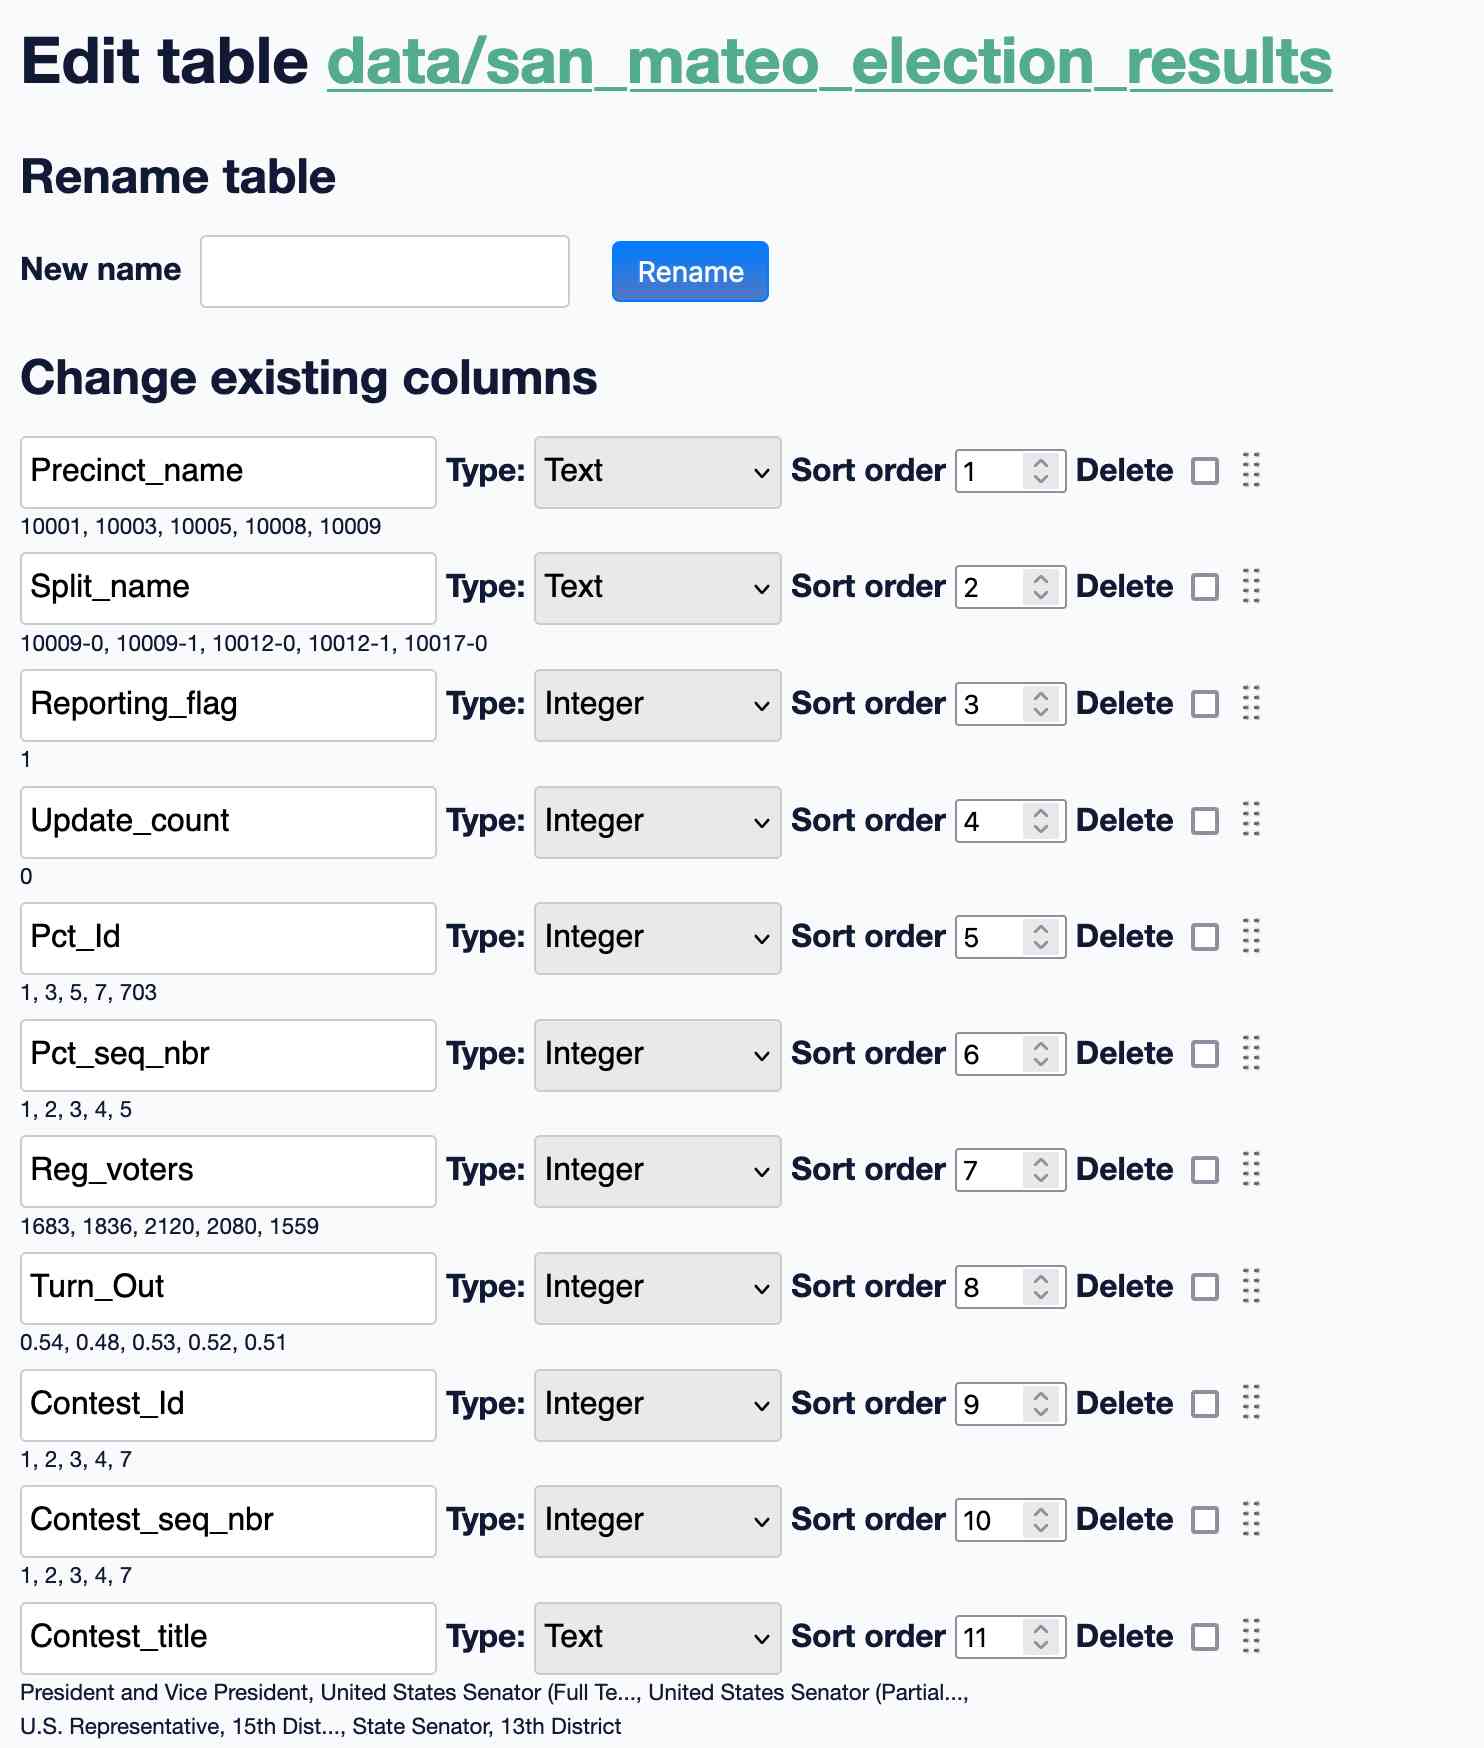
The resulting 15,589 rows represent counts from individual precincts around the county for each of the races and measures on the ballot, with a row per precinct per candidate/choice per race.
Faceting and filtering the table
Since I’m interested in the Granada Community Services District election, I applied a facet on “Contest_title” and then used that to select that specific race.
I applied additional facets on “candidate_name” and “Precinct name”.
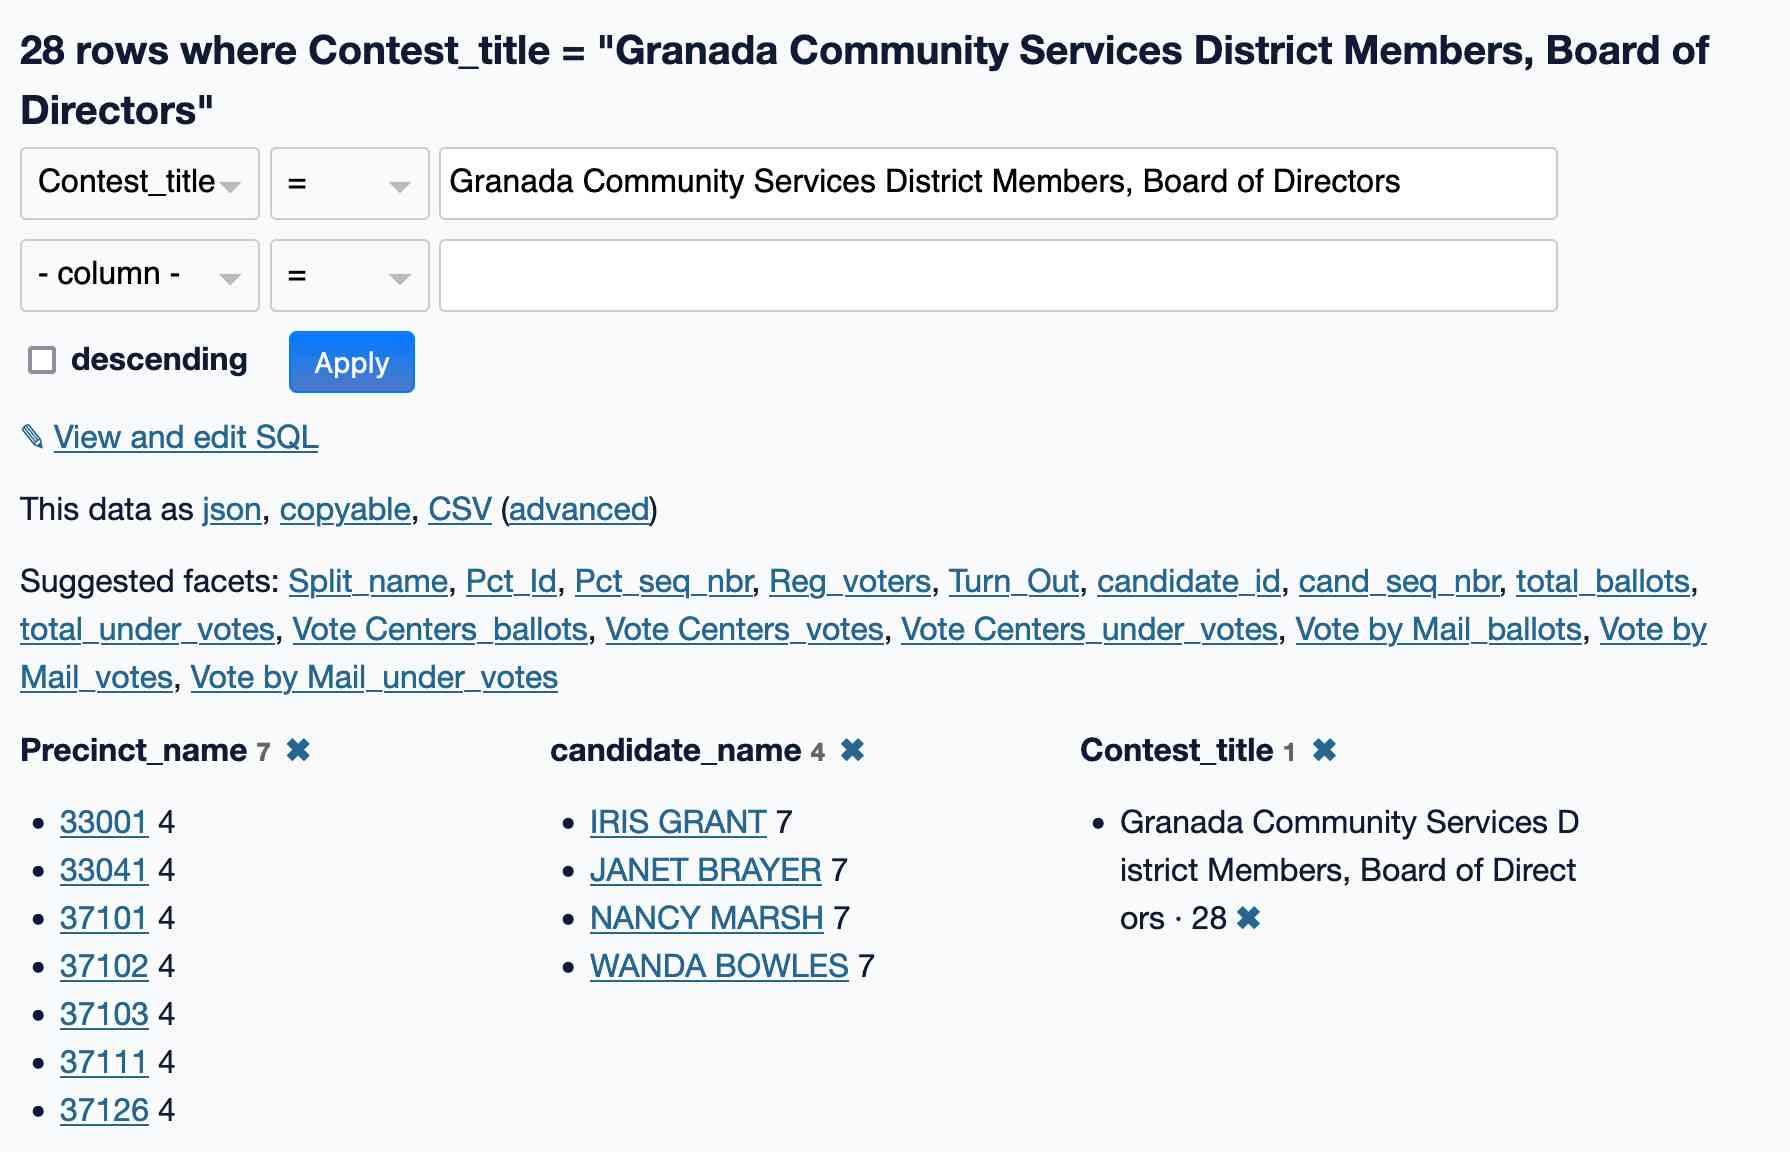
This looks right to me: we have 7 precincts and 4 candidates for 28 rows in total.
Importing geospatial precinct shapes
Those precinct names are pretty non-descriptive! What does 33001 mean?
To answer that question, I added a new table.
San Mateo County offers precinct maps in the form of 23 PDF files. Our precincts are in the “Unincorporated Coastside” file:
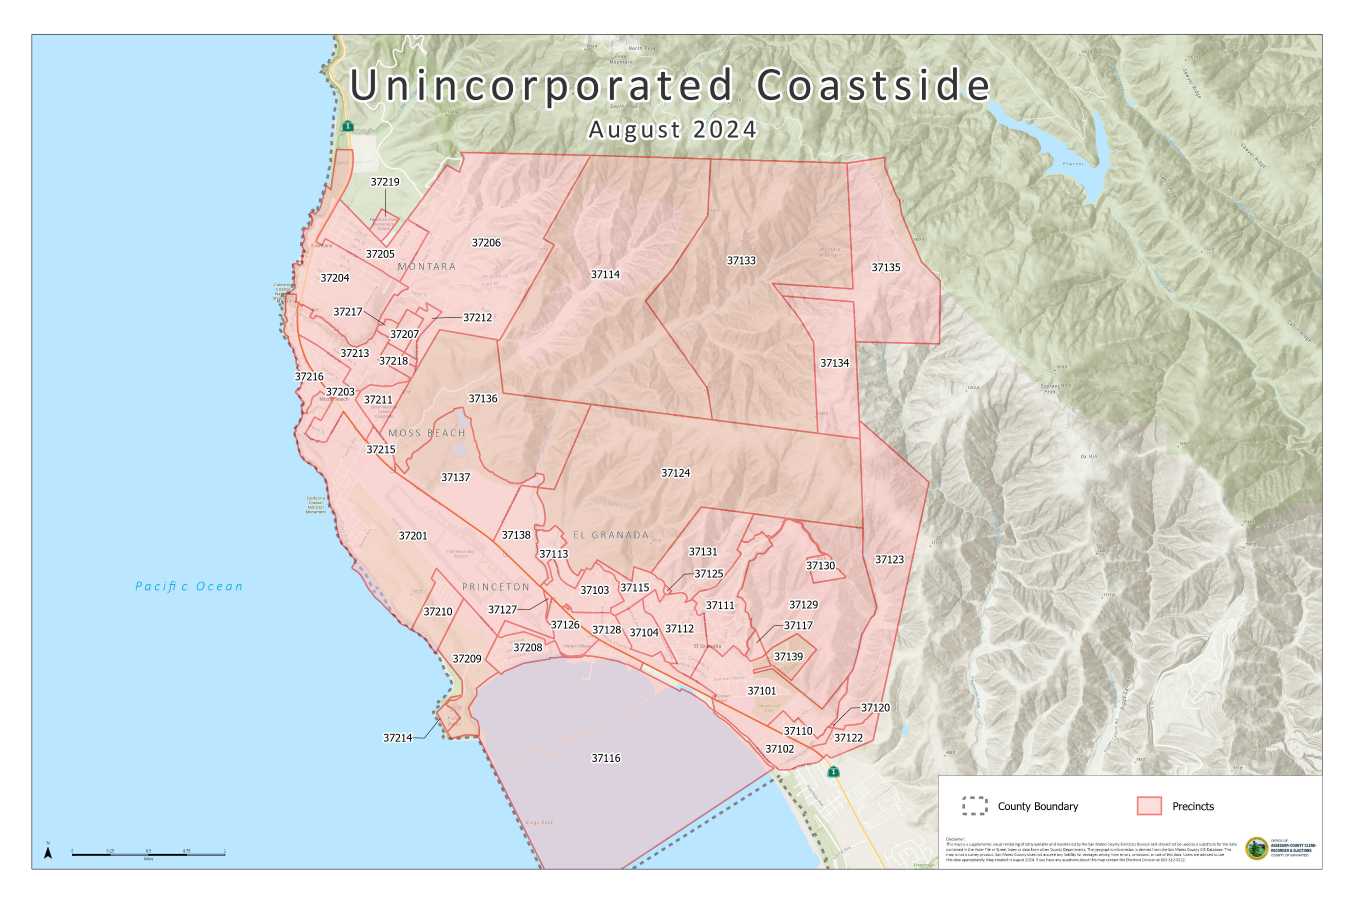
Thankfully the county also makes that data available as geospatial data, hosted using Socrata with an option to export as GeoJSON.
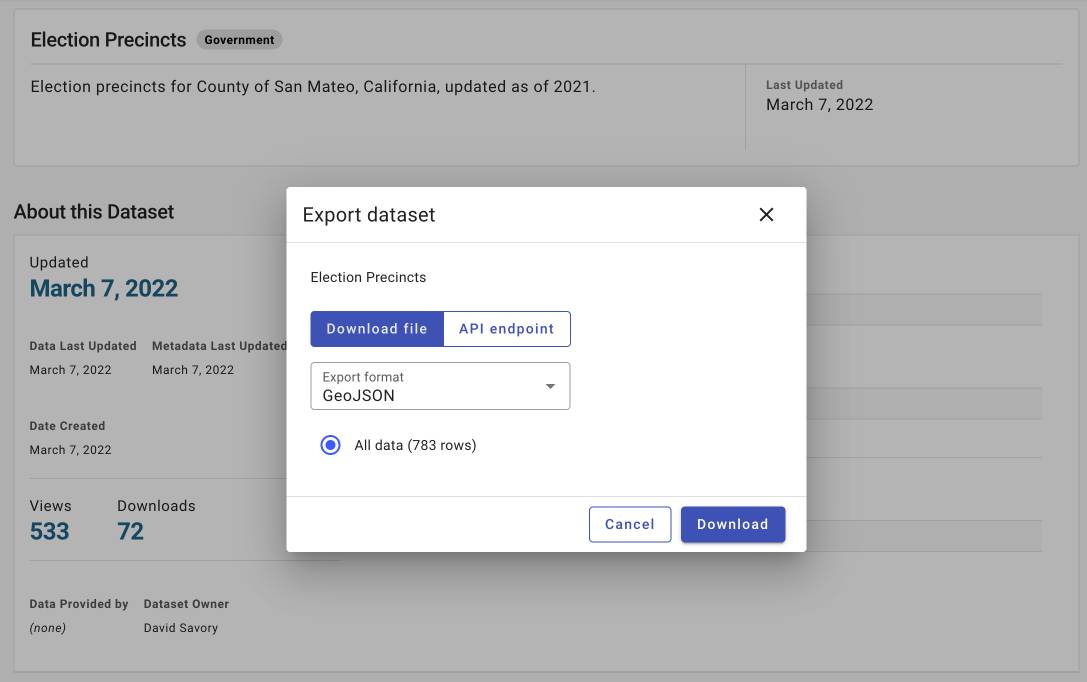
The datasette-import plugin can handle JSON files... and if a JSON file contains a top-level object with a key that is an array of objects, it will import those objects as a table.
Dragging that file into Datasette is enough to import it as a table with a properties JSON column containing properties and a geometry JSON columnn with the GeoJSON geometry.
Here’s where another plugin kicks in: datasette-leaflet-geojson looks for columns that contain valid GeoJSON geometries and... draws them on a map!
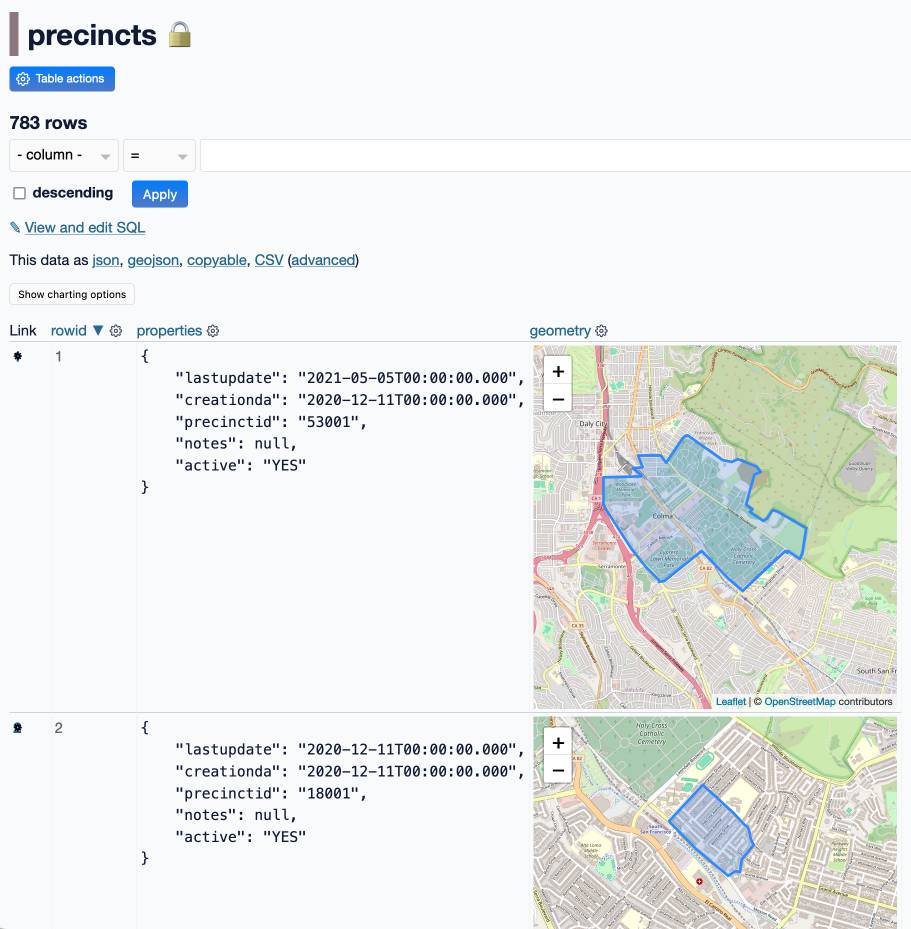
So now we can see the shape of the individual geometries.
Enriching that data to extract the precinct IDs
The precinctid is present in the data, but it’s tucked away in a JSON object in that properties JSON blob. It would be more convenient if it was a top-level column.
Datasette’s enrichments feature provides tools for running operations against every row in a table and adding new columns based on the results.
My Datasette Cloud instance was missing the datasette-enrichments-quickjs plugin that would let me run JavaScript code against the data. I used my privileged access on Datasette Cloud to add that plugin to my requirements and restarted the instance to install it.
I used that to run this JavaScript code against every row in the table and saved the output in a new precinct_id column:
function enrich(row) {
  return JSON.parse(row.properties).precinctid;
}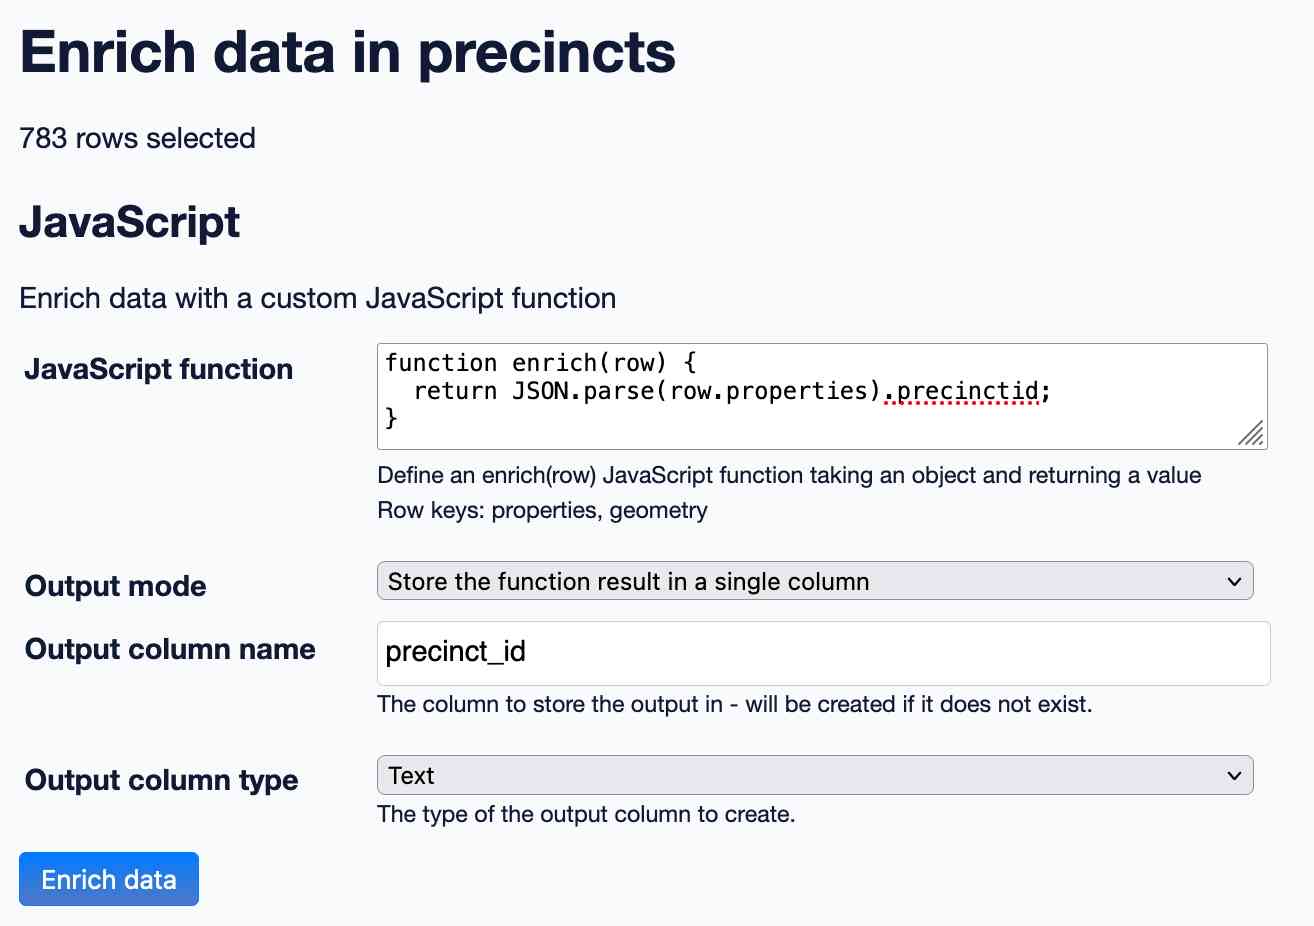
This took less than a second to run, adding and populating a new precinct_id column for the table.
Running a join
I demonstrated how to run a join between the election results and the precincts table using the Datasette SQL query editor.
I tried a few different things, but the most interesting query was this one:
select
  Precinct_name,
  precincts.geometry,
  total_ballots,
  json_group_object(
    candidate_name,
    total_votes
  ) as votes_by_candidate
from
  election_results
  join precincts on election_results.Precinct_name = precincts.precinct_id
where
  Contest_title = "Granada Community Services District Members, Board of Directors"
group by
  Precinct_name,
  precincts.geometry,
  total_ballots;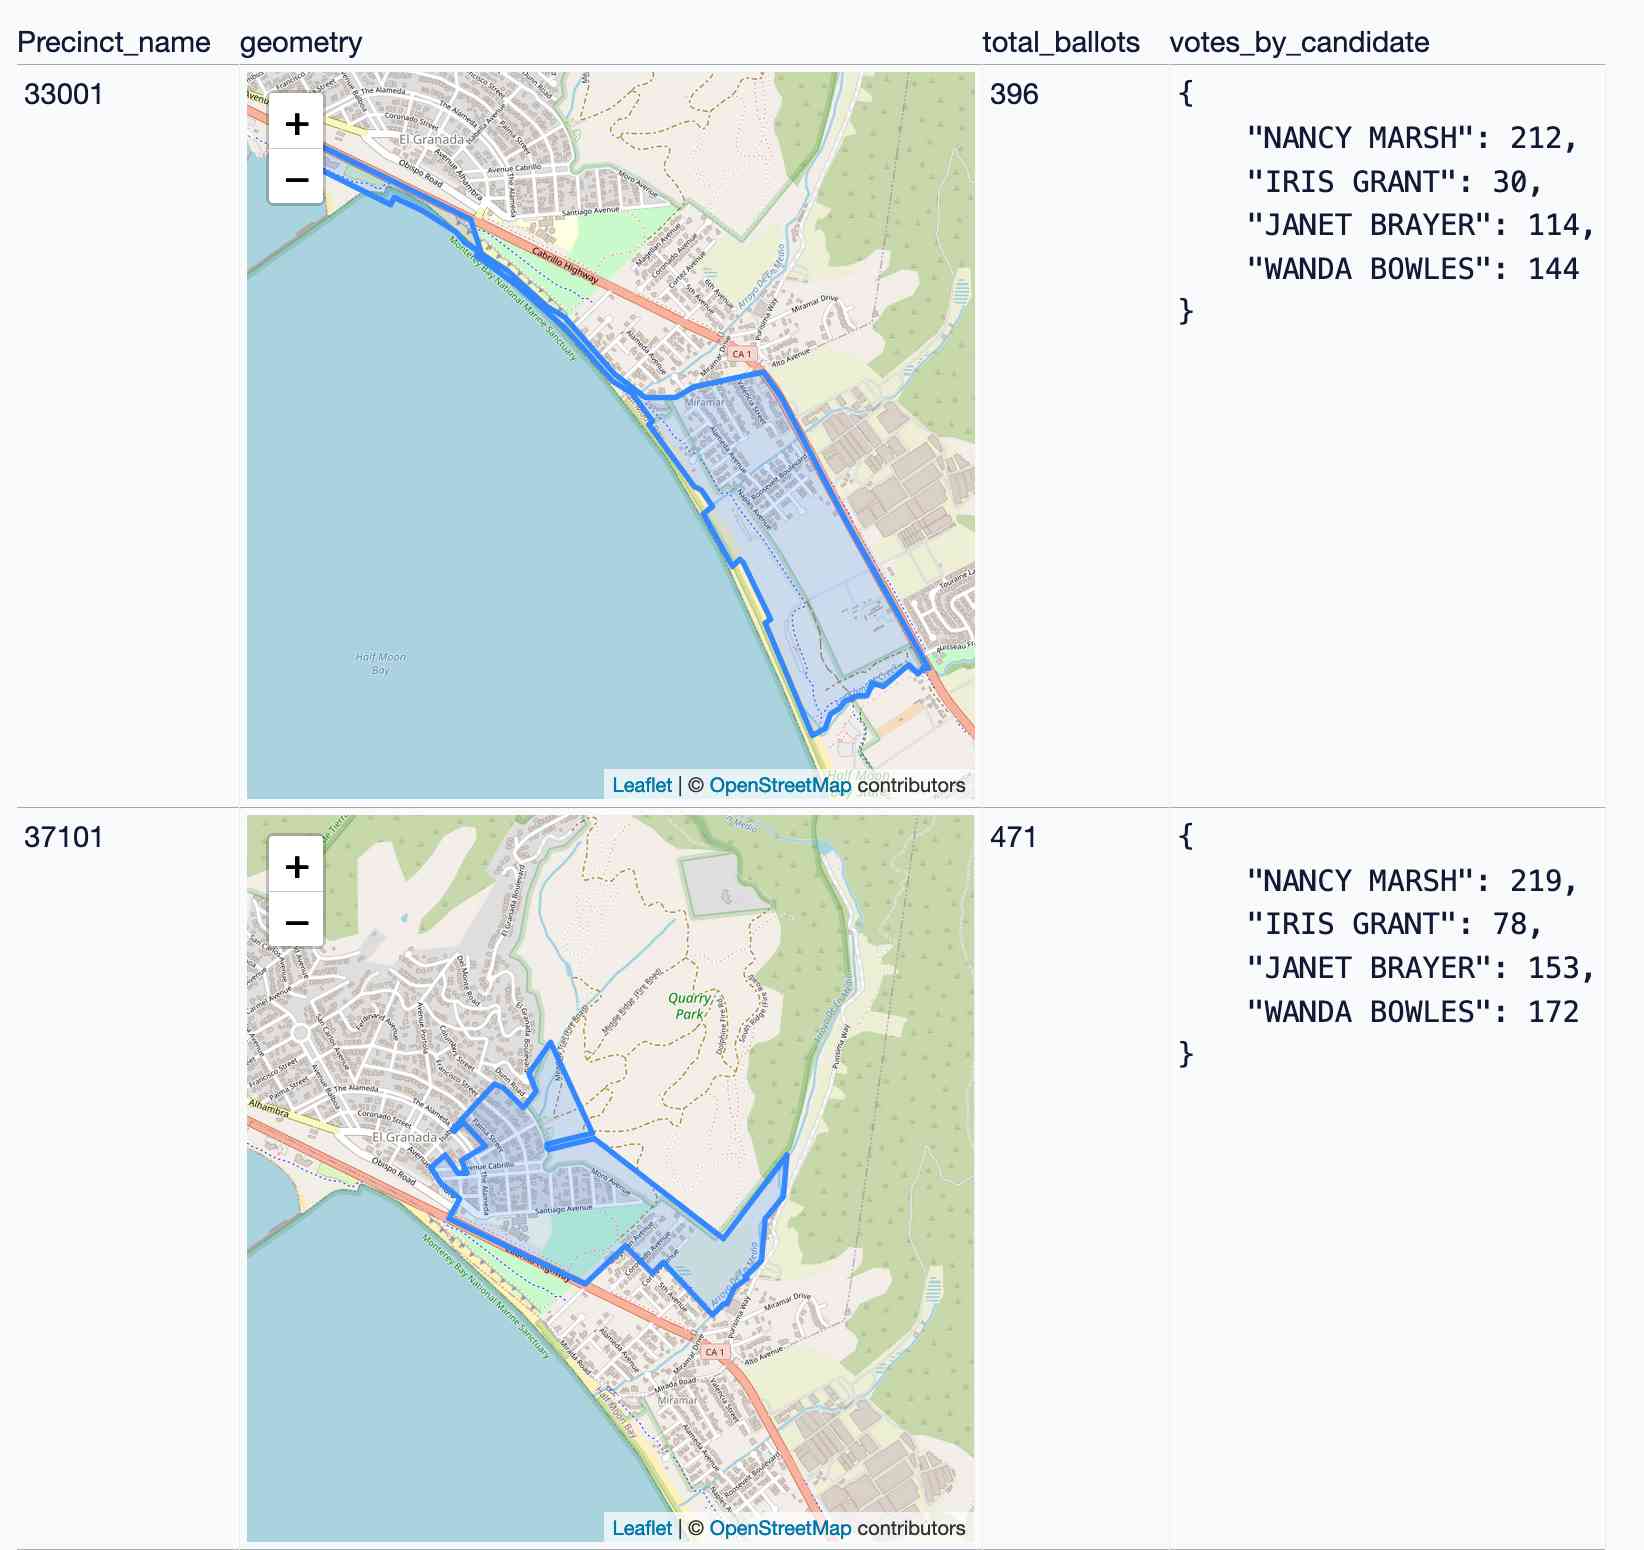
Creating an API token to access the data
I was nearly ready to hand over to Alex for the second half of our demo, where he would use Observable Notebooks to build some custom visualizations on top of the data.
A great pattern for this is to host the data in Datasette and then fetch it into Observable via the Datasette JSON API.
Since Datasette Cloud instances are private by default we would need to create an API token that could do this.
I used this interface (from the datasette-auth-tokens plugin) to create a new token with read-only access to all databases and tables in the instance:
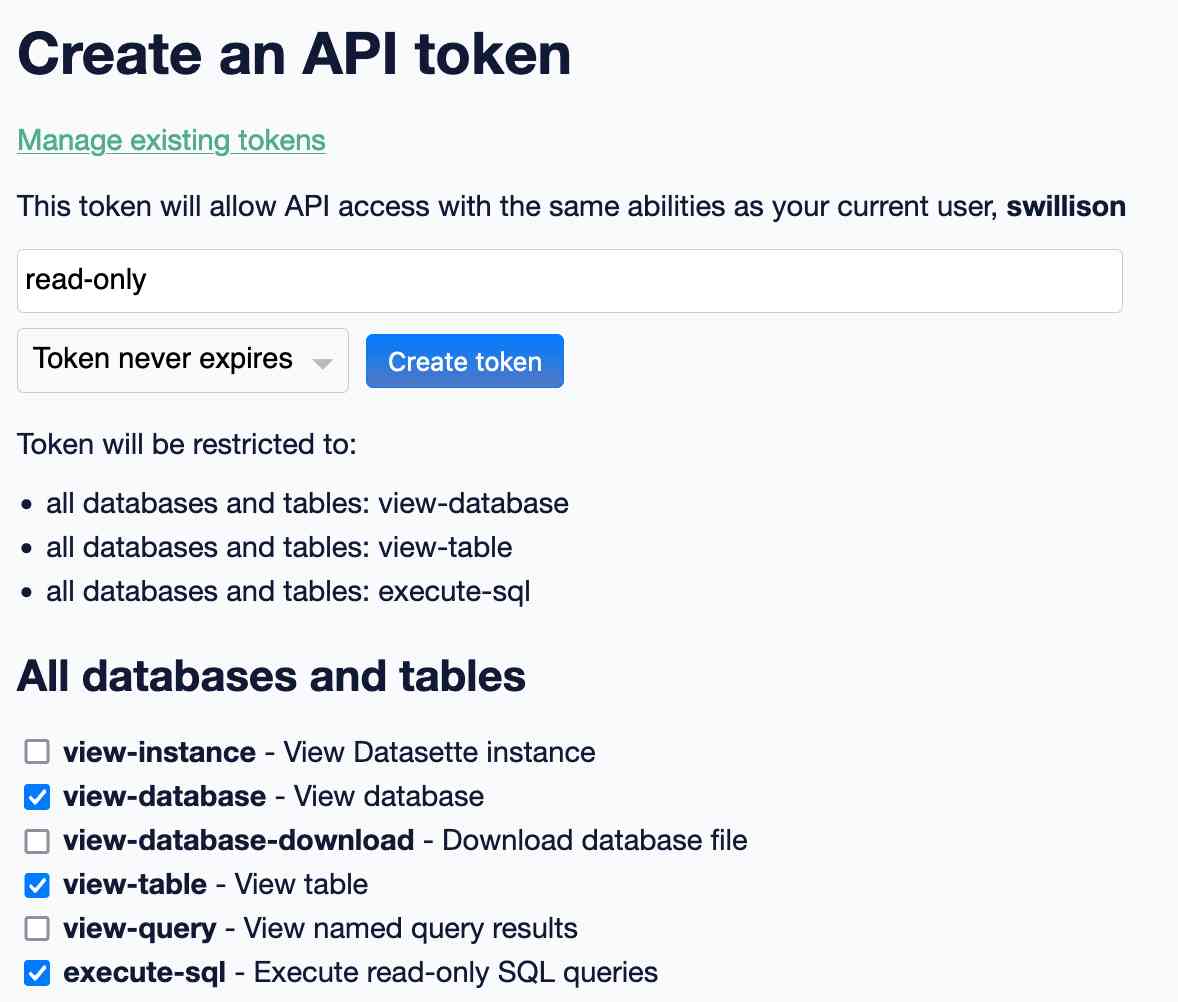
Since we’re running a dedicated instance just for Datasette Public Office Hours there’s no reason not to distribute that read-only token in publically accessible code.
Getting CORS working
Embarrassingly, I had forgotten that we would need CORS headers in order to access the data from an Observable notebook. Thankfully we have another plugin for that: datasette-cors. I installed that quickly and we confirmed that it granted access to the API from Observable as intended.
I handed over to Alex for the next section of the demo.
Working with Datasette in Observable
Alex started by running a SQL query from client-side JavaScript to pull in the joined data for our specific El Granada race:
sql = `
select
  Precinct_name,
  precincts.geometry,
  Split_name,
  Reporting_flag,
  Update_count,
  Pct_Id,
  Pct_seq_nbr,
  Reg_voters,
  Turn_Out,
  Contest_Id,
  Contest_seq_nbr,
  Contest_title,
  Contest_party_name,
  Selectable_Options,
  candidate_id,
  candidate_name,
  Candidate_Type,
  cand_seq_nbr,
  Party_Code,
  total_ballots,
  total_votes,
  total_under_votes,
  total_over_votes,
  [Vote Centers_ballots],
  [Vote Centers_votes],
  [Vote Centers_under_votes],
  [Vote Centers_over_votes],
  [Vote by Mail_ballots],
  [Vote by Mail_votes],
  [Vote by Mail_under_votes],
  [Vote by Mail_over_votes]
from
  election_results join precincts on election_results.Precinct_name = precincts.precinct_id
where "Contest_title" = "Granada Community Services District Members, Board of Directors"
limit 101;`
And in the next cell:
raw_data = fetch(
  `https://datasette-public-office-hours.datasette.cloud/data/-/query.json?_shape=array&sql=${encodeURIComponent(
    sql
  )}`,
  {
    headers: {
      Authorization: `Bearer ${secret}`
    }
  }
).then((r) => r.json())
Note the ?_shape=array parameter there, which causes Datasette to output the results directly as a JSON array of objects.
That’s all it takes to get the data into Observable. Adding another cell like this confirms that the data is now available:
Inputs.table(raw_data)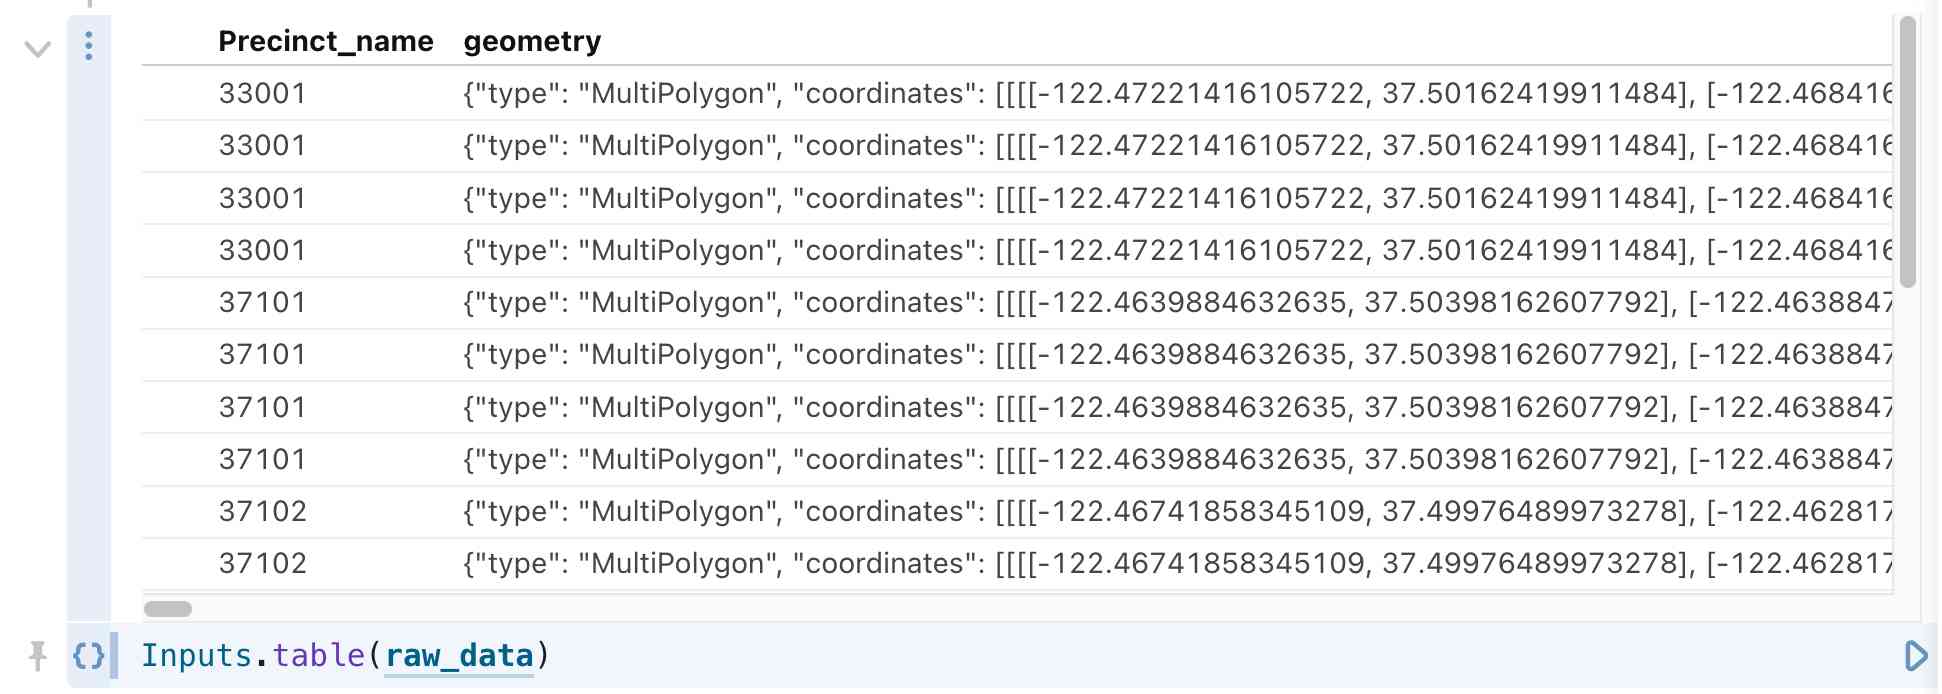
Visualizing those with MapLibre GL
There are plenty of good options for visualizing GeoJSON data using JavaScript in an Observable notebook.
Alex started with MapLibre GL, using the excellent OpenFreeMap 3D tiles:
viewof map = {
  const container = html`<div style="height:800px;">`;
  yield container;
  const map = (container.value = new maplibregl.Map({
    container,
    zoom: 2,
    //style: "https://basemaps.cartocdn.com/gl/voyager-gl-style/style.json",
    style: "https://tiles.openfreemap.org/styles/liberty",
    scrollZoom: true
  }));
  yield container;

  map.on("load", function () {
    map.fitBounds(d3.geoBounds(data), { duration: 0 });
    map.addSource("precincts", {
      type: "geojson",
      data: data
    });
    map.addLayer({
      id: "precincts",
      type: "fill",
      source: "precincts",
      paint: {
        "fill-opacity": 0.4,
        "fill-color": [
          "case",
          ["==", ["get", "ratio"], null], "#000000",
          [
            "interpolate",
            ["linear"],
            ["get", "ratio"],
            0.0, "#0000ff",
            0.5, "#d3d3d3",
            1.0, "#ff0000"
          ]
        ]
      }
    });
    map.on("click", "precincts", (e) => {
      const { precinct, ratio } = e.features[0].properties;
      const description = JSON.stringify();

      new maplibregl.Popup()
        .setLngLat(e.lngLat)
        .setHTML(description)
        .addTo(map);
    });
  });
  invalidation.then(() => map.remove());
}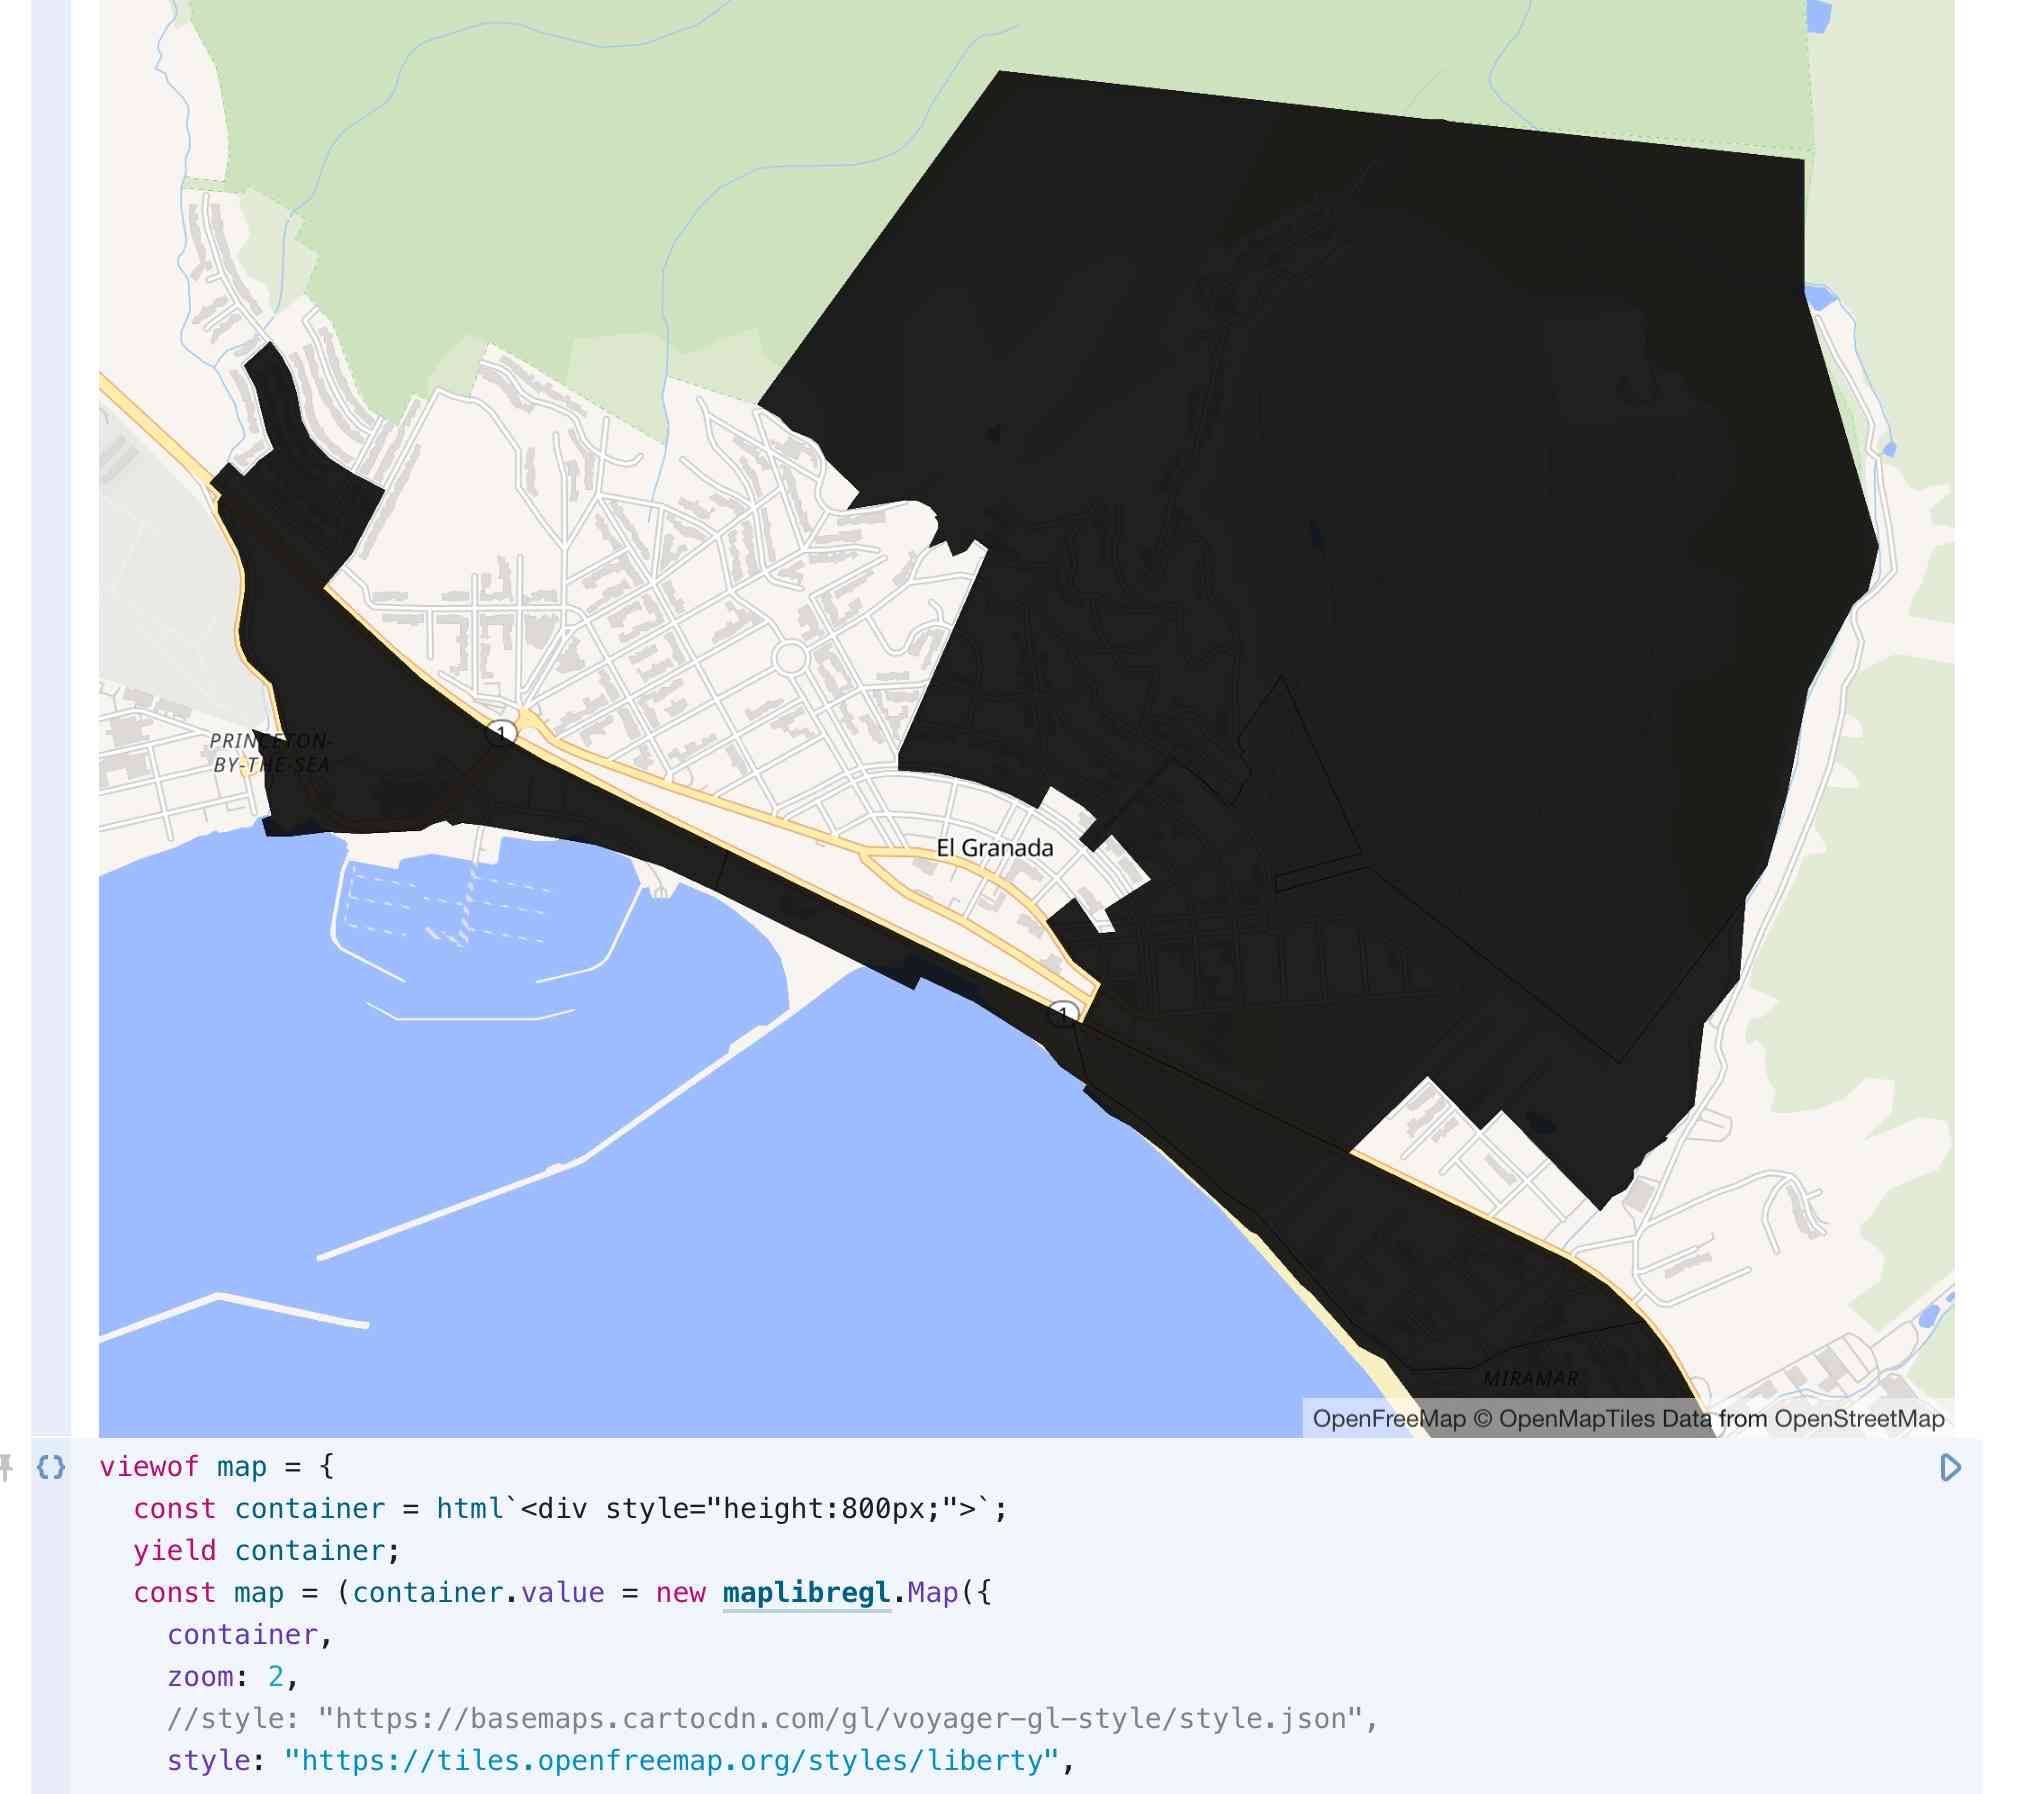
(This is just one of several iterations, I didn’t capture detailed notes of every change Alex made to the code.)
Observable Plot
Observable notebooks come pre-loaded with the excellent Observable Plot charting library—Mike Bostock’s high-level charting tool built on top of D3.
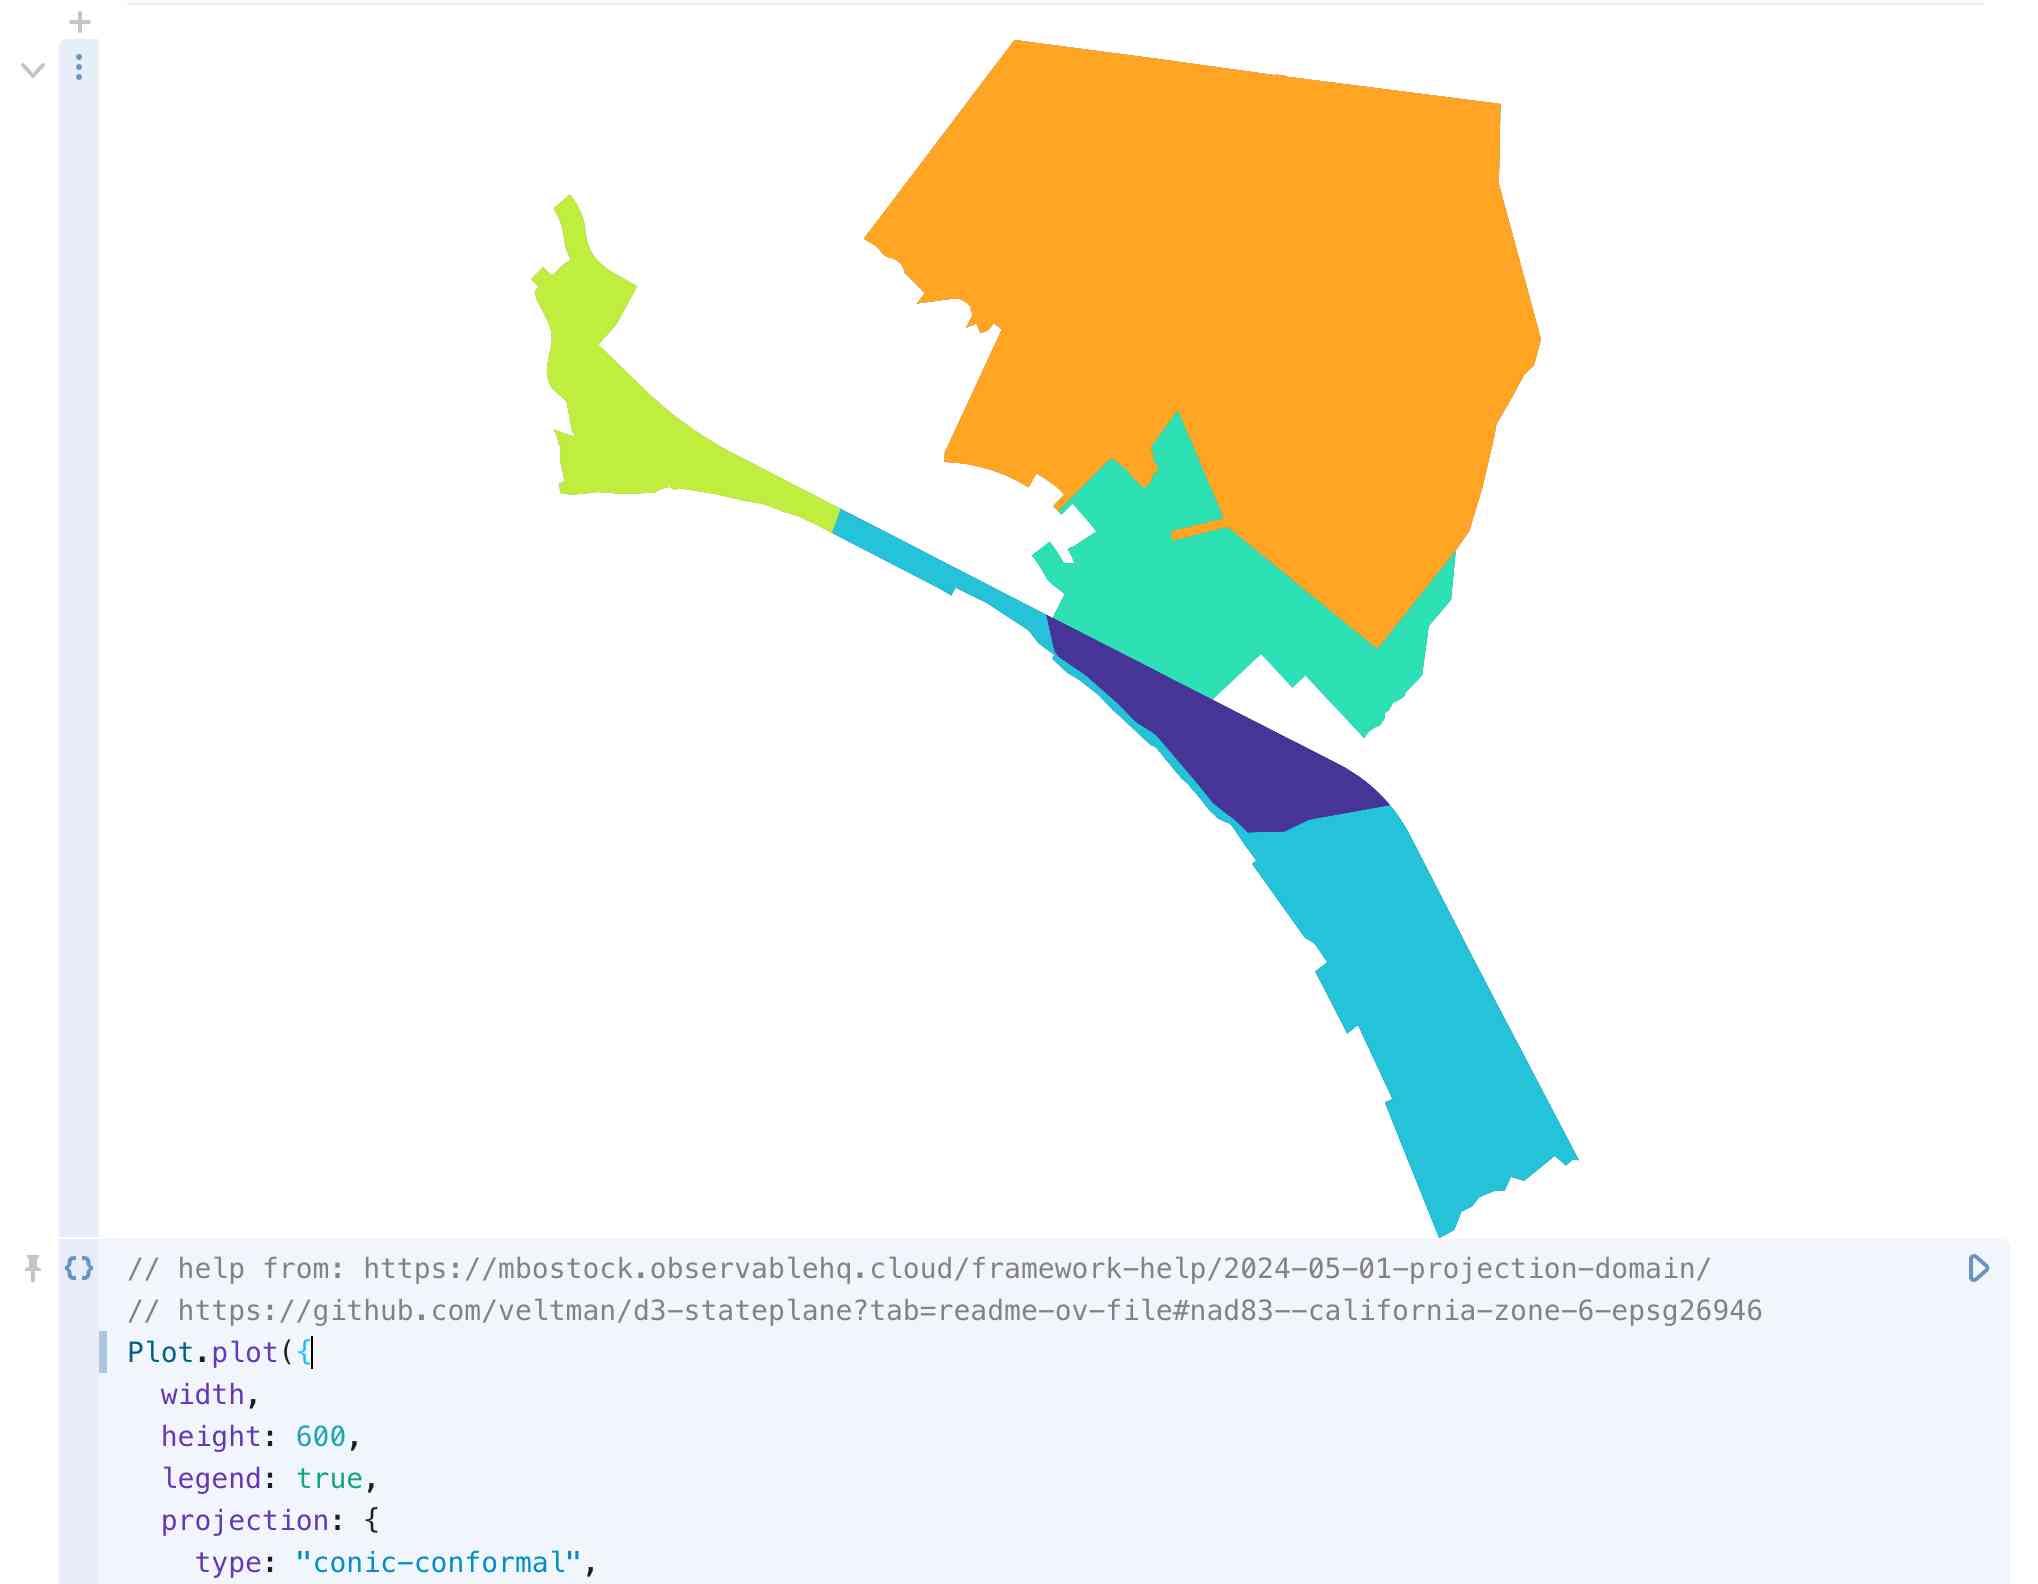
Alex used that to first render the shapes of the precincts directly, without even needing a tiled basemap:
Plot.plot({
  width,
  height: 600,
  legend: true,
  projection: {
    type: "conic-conformal",
    parallels: [37 + 4 / 60, 38 + 26 / 60],
    rotate: [120 + 30 / 60, 0],
    domain: data
  },
  marks: [
    Plot.geo(data, {
      strokeOpacity: 0.1,
      fill: "total_votes",
      title: (d) => JSON.stringify(d.properties),
      tip: true
    })
  ]
})
The parallels and rotate options there come from the handy veltman/d3-stateplane repo, which lists recommended settings for the State Plane Coordinate System used with projections in D3. Those values are for California Zone 3.
Bringing it all together
For the grand finale, Alex combined everything learned so far to build an interactive map allowing a user to select any of the 110 races on the ballot and see a heatmap of results for any selected candidate and option:
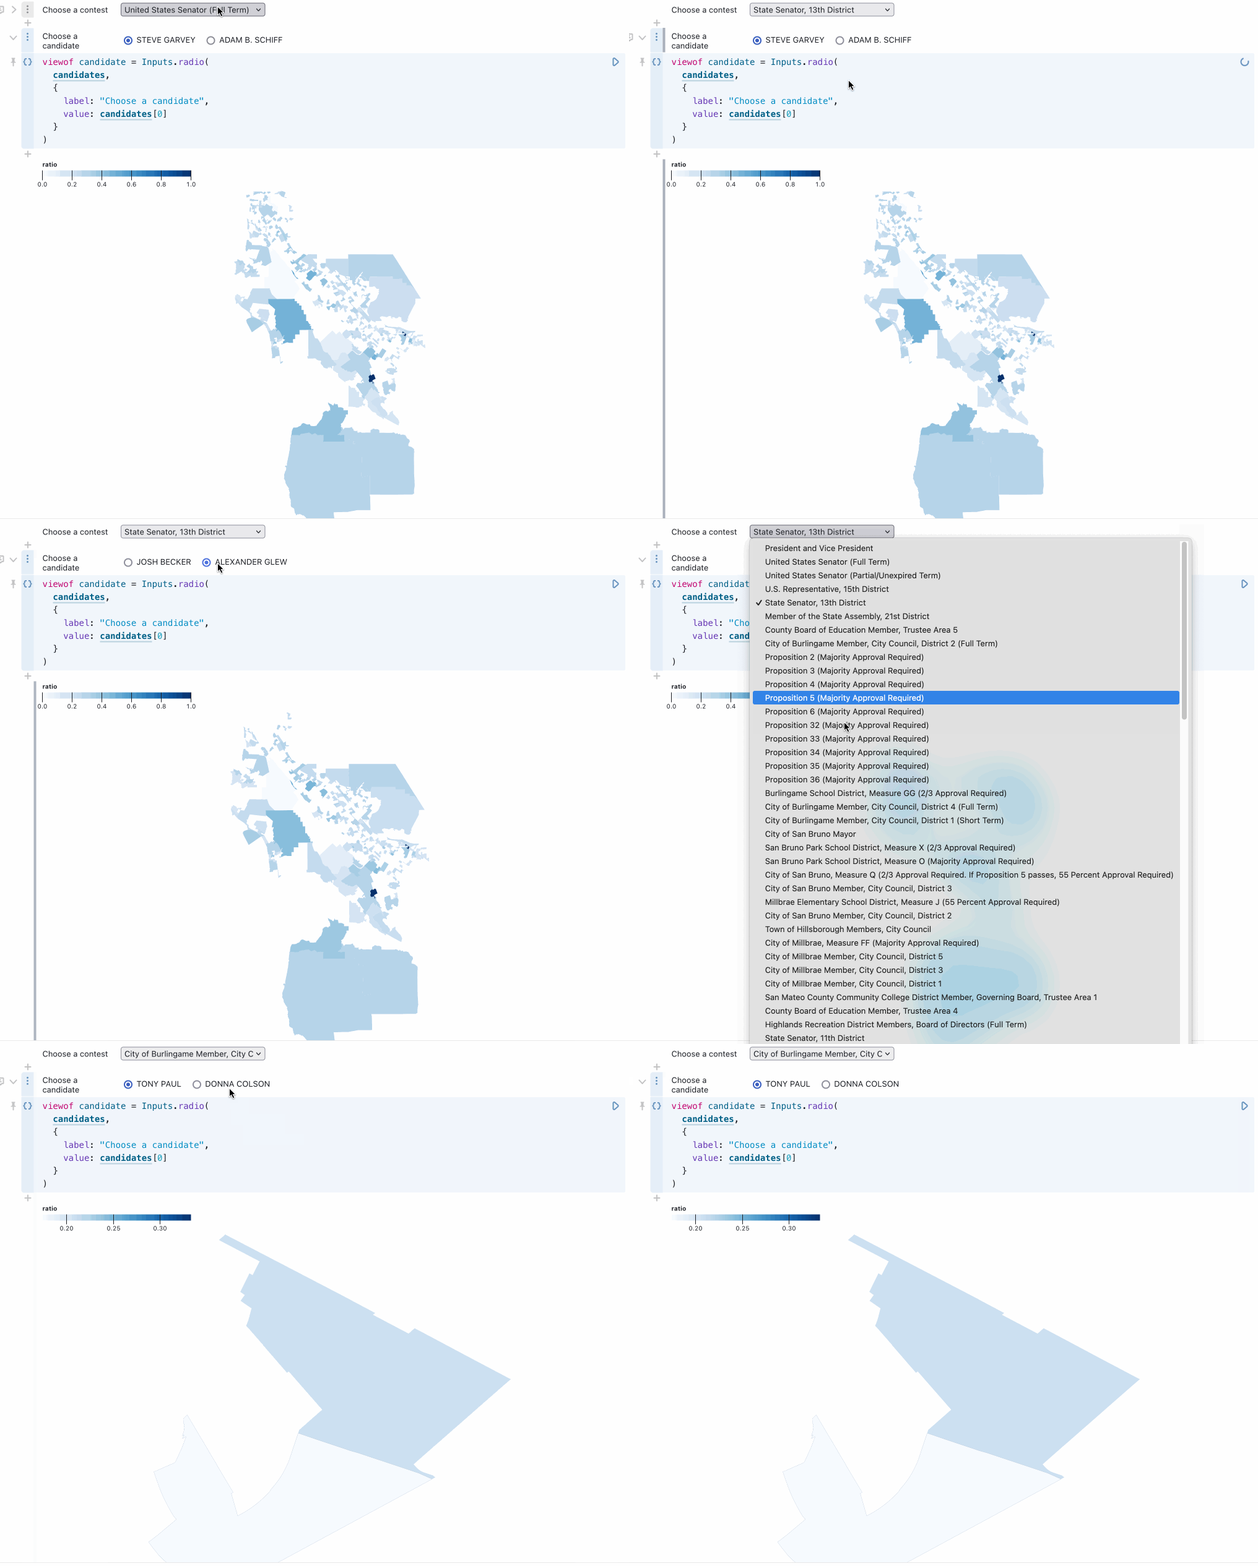
You can try this out in Alex’s notebook. Here’s the relevant code (Observable cells are divided by // --- comments). Note that Observable notebooks are reactive and allow variables to be referenced out of order.
// Select the contest
viewof contest = Inputs.select(contests, { label: "Choose a contest" })

// ---

// And the candidate
viewof candidate = Inputs.radio(
  candidates,
  {
    label: "Choose a candidate",
    value: candidates[0]
  }
)

// ---

// Show the map itself
Plot.plot({
  width,
  height: 600,
  legend: true,
  color: { scheme: "blues", legend: true },
  projection: {
    type: "mercator",
    domain: data2
  },
  marks: [
    Plot.geo(data2, {
      strokeOpacity: 0.1,
      fill: "ratio",
      tip: true
    })
  ]
})
# ---
data2 = ({
  type: "FeatureCollection",
  features: raw_data2.map((d) => ({
    type: "Feature",
    properties: {
      precinct: d.Precinct_name,
      total_ballots: d.total_ballots,
      ratio: JSON.parse(d.votes_by_candidate)[candidate] / d.total_ballots
    },
    geometry: JSON.parse(d.geometry)
  }))
})

// ---

raw_data2 = query(
  `select
  Precinct_name,
  precincts.geometry,
  total_ballots,
  json_grop_object(
    candidate_name,
    total_votes
  ) as votes_by_candidate
from
  election_results
  join precincts on election_results.Precinct_name = precincts.precinct_id
where Contest_title = :contest
group by
  Precinct_name,
  precincts.geometry,
  total_ballots;`,
  { contest }
)

// ---

raw_data2 = query(
  `select
  Precinct_name,
  precincts.geometry,
  total_ballots,
  json_group_object(
    candidate_name,
    total_votes
  ) as votes_by_candidate
from
  election_results
  join precincts on election_results.Precinct_name = precincts.precinct_id
where Contest_title = :contest
group by
  Precinct_name,
  precincts.geometry,
  total_ballots;`,
  { contest }
)

// ---

// Fetch the available contests
contests = query("select distinct Contest_title from election_results").then(
  (d) => d.map((d) => d.Contest_title)
)

// ---

// Extract available candidates for selected contest

candidates = Object.keys(
  JSON.parse(raw_data2[0].votes_by_candidate)
)

// ---

function query(sql, params = {}) {
  return fetch(
    `https://datasette-public-office-hours.datasette.cloud/data/-/query.json?${new URLSearchParams(
      { sql, _shape: "array", ...params }
    ).toString()}`,
    {
      headers: {
        Authorization: `Bearer ${secret}`
      }
    }
  ).then((r) => r.json());
}
We’ll be doing this again
This was our first time trying something like this and I think it worked really well. We’re already thinking about ways to improve it next time:
- I want to record these sessions and make them available on YouTube for people who couldn’t be there live
- It would be fun to mix up the format. I’m particularly keen on getting more people involved giving demos—maybe having 5-10 minute lightning demo slots so we can see what other people are working on
Keep an eye on this blog or on the Datasette Discord for news about future sessions.
More recent articles
- Two new Showboat tools: Chartroom and datasette-showboat - 17th February 2026
- Deep Blue - 15th February 2026
- The evolution of OpenAI's mission statement - 13th February 2026