Adding AI-generated descriptions to my tools collection
13th March 2025
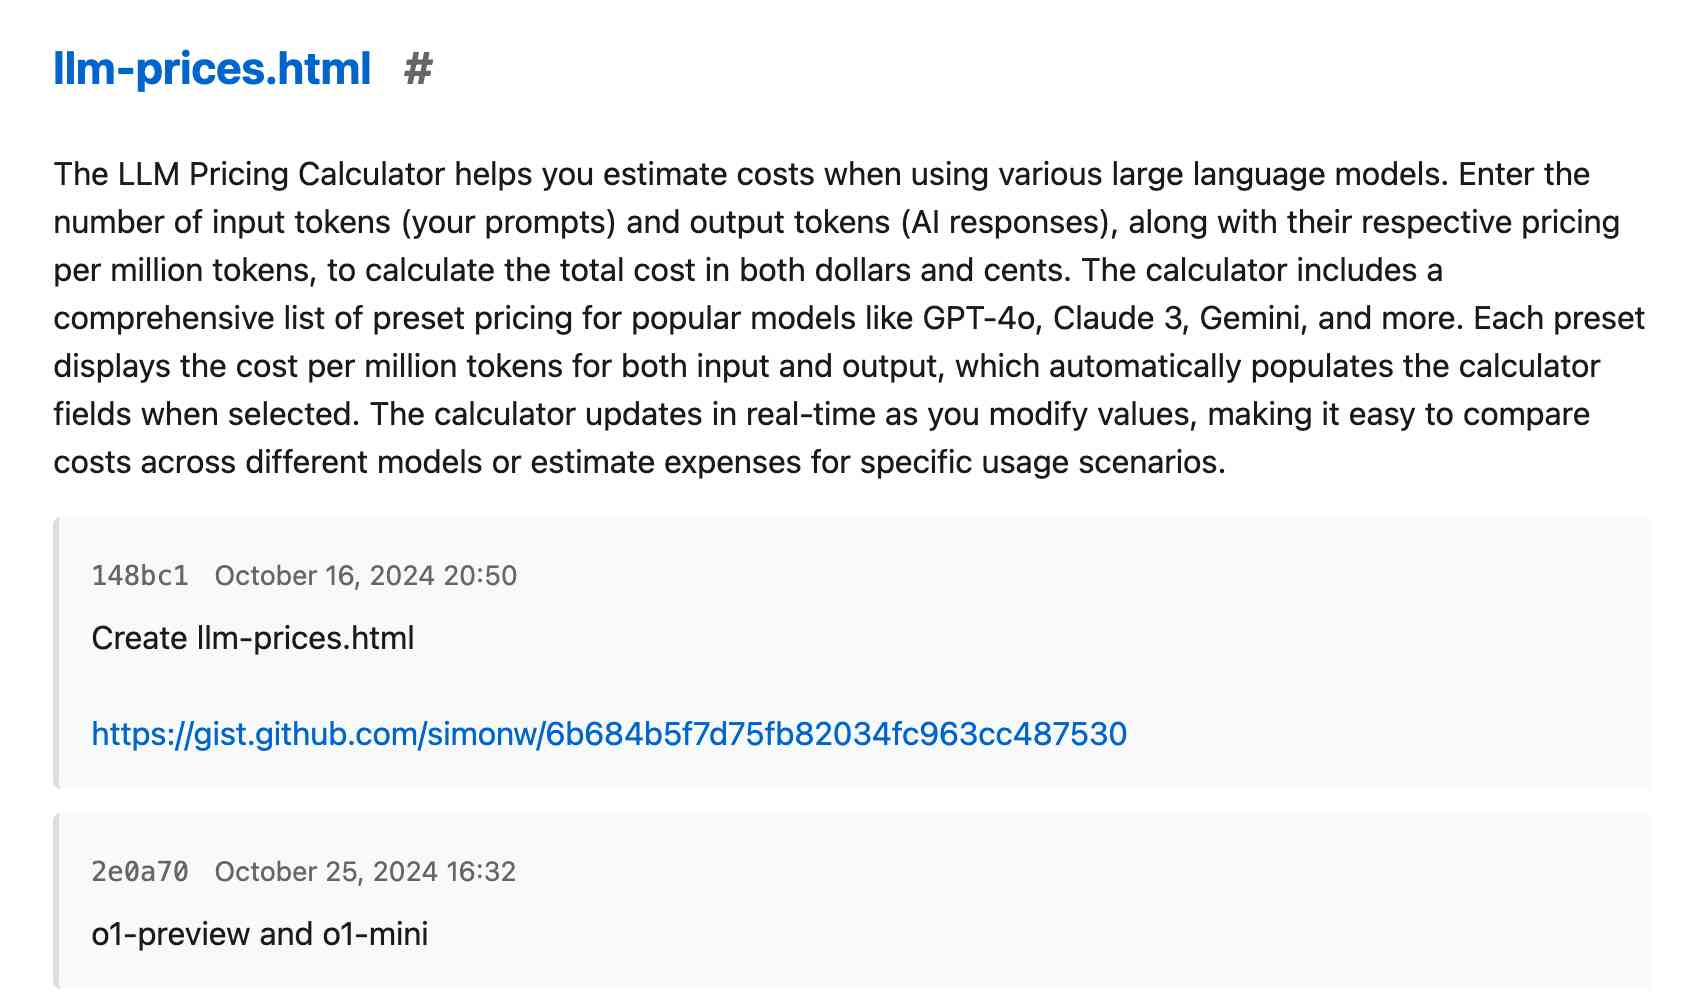
The /colophon page on my tools.simonwillison.net site lists all 78 of the HTML+JavaScript tools I’ve built (with AI assistance) along with their commit histories, including links to prompting transcripts. I wrote about how I built that colophon the other day. It now also includes a description of each tool, generated using Claude 3.7 Sonnet.
This is the single largest chunk of AI-generated text I’ve ever published on the indexable web. I share lots of LLM transcripts but I usually put them in a secret Gist such that they’ll be kept out of search engines.
On the one hand this feels slop adjacent—but I was never going to write documentation for all 78 of those little experiments, yet I find myself forgetting details of how they worked. Just one example: my CSV marker map tool which I built last year for knocking out an ad-hoc Bigfoot sightings map and then promptly forgot what it could do.
Here’s what I got when I ran:
cat csv-marker-map.html | llm -m claude-3.7-sonnet \
  --system "Write a paragraph of documentation for this page as markdown. Do not include a heading. Do not use words like just or simply."
This interactive map displays markers based on data from a CSV file. Load data by adding
?csv=URLto the page URL, where the CSV must includelatitudeandlongitudecolumns. You can customize the map with several URL parameters:center(coordinates in formatlat,lng),zoom(zoom level),q(location to search for),marker(add individual markers at coordinates), andcolor(change the default marker color). The map automatically updates the URL as you navigate, preserving your current view. Markers from CSV files appear as small colored circles on the map, while markers specified directly in the URL use the default Leaflet marker style.
That’s genuinely useful. I got Claude to write me a write_docs.py script to loop through all 78 files and generate filename.docs.md descriptions that live in the repo, then updated build_colophon.py to include those descriptions if they exist.
It cost about $1.08 in Claude credits to document all 78 tools, because some of those HTML files were quite long so the input tokens added up.
Each of the documentation files includes a comment with the most recent commit hash of the file that was used to generate the document, like this:
<!-- Generated from commit: 7c6af8eeabc7682b5f9ec2621e34bc771c5471d8 -->
The script can use this to spot if a tool has been updated—if so, the documentation will be regenerated.
Add this all together and now I can drop new HTML+JavaScript tools into my simonw/tools repo and, moments later, they’ll be published on tools.simonwillison.net with auto-generated descriptions added to my colophon. I think that’s pretty neat!
Update: I decided that the descriptions were too long, so I modified the script to add “Keep it to 2-3 sentences” to the end of the system prompt. These new, shorter descriptions are now live—here’s the diff. Total usage was 283,528 input tokens and 6,010 output tokens for a cost of 94 cents.
The new, shorter description for csv-marker-map.html looks like this:
This page creates an interactive map with markers based on CSV data. It accepts parameters in the URL to set the center, zoom level, search query, individual markers, and a CSV file URL for bulk marker placement. The markers are displayed on an OpenStreetMap base layer, and the map view automatically updates the URL when panned or zoomed.
For comparison, here’s a copy of the previous colophon with the longer descriptions.
More recent articles
- Meta's new model is Muse Spark, and meta.ai chat has some interesting tools - 8th April 2026
- Anthropic's Project Glasswing - restricting Claude Mythos to security researchers - sounds necessary to me - 7th April 2026
- The Axios supply chain attack used individually targeted social engineering - 3rd April 2026