Building a location to time zone API with SpatiaLite, OpenStreetMap and Datasette
12th December 2017
Given a latitude and longitude, how can we tell what time zone that point lies within? Here’s how I built a simple JSON API to answer that question, using a combination of data from OpenStreetMap, the SpatiaLite extension for SQLite and my Datasette API tool.
This article is out of date and no longer relevant. It has been replaced by a new tutorial: Building a location to time zone API with SpatiaLite, on the official Datasette website.
The API
You can try the API out here: feed it a latitude and longitude and it will return the corresponding time zone ID: https://timezones.datasette.io/timezones/by_point
Some examples:
- Brighton, England is in Europe/London (in JSON)
- San Francisco, USA is in America/Los_Angeles (in JSON)
- Tokyo, Japan is Asia/Tokyo (in JSON)
The data
I was first introduced to Eric Muller’s tz_world shapefile by Nick Williams at Eventbrite, who used it to build us an internal time zone lookup API on top of MySQL’s geospatial data types. Eric’s project is no longer updated and he recommends Evan Siroky’s timezone-boundary-builder project as an alternative, which derives time zone shapes from OpenStreetMap and makes the resulting data available under the Open Database License. The shapefile itself can be downloaded from the GitHub releases page for the project.
Loading the data into SpatiaLite
SpatiaLite is a powerful open source extension for SQLite, which adds a comprehensive suite of geospatial functions—including the ability to ingest shapefiles, convert them into geometries and run point within queries against the resulting shapes.
The easiest way to get it running on OS X is via Homebrew:
$ brew install spatialite-tools
$ brew install gdal
Having installed SpatiaLite, we can ingest the shapefile using .loadshp combined_shapefile timezones CP1252 23032—here’s the full process, from downloading the shapefile to ingesting it into a new SQLite database file called timezones.db:
$ wget https://github.com/evansiroky/timezone-boundary-builder/releases/download/2017c/timezones.shapefile.zip
$ unzip timezones.shapefile.zip
$ cd dist
$ spatialite timezones.db
SpatiaLite version ..: 4.3.0a   Supported Extensions:
...
Enter SQL statements terminated with a ";"
spatialite> .loadshp combined_shapefile timezones CP1252 23032
========
Loading shapefile at 'combined_shapefile' into SQLite table 'timezones'

BEGIN;
CREATE TABLE "timezones" (
"PK_UID" INTEGER PRIMARY KEY AUTOINCREMENT,
"tzid" TEXT);
SELECT AddGeometryColumn('timezones', 'Geometry', 23032, 'MULTIPOLYGON', 'XY');
COMMIT;

Inserted 414 rows into 'timezones' from SHAPEFILE
========
spatialite>
Let’s try it out with a query. Here’s the SQL needed to find the time zone for a point in Tokyo:
select tzid
from
    timezones
where
    within(GeomFromText('POINT(139.7819661 35.6631424)'), timezones.Geometry);
Let’s run that in SpatiaLite and see what we get:
spatialite> select tzid
   ...> from
   ...>     timezones
   ...> where
   ...>     within(GeomFromText('POINT(139.7819661 35.6631424)'), timezones.Geometry);
Asia/Tokyo
Looks good so far! How long is it taking though? We can find out by running .timer on in the spatialite prompt:
spatialite> .timer on
spatialite> select tzid
   ...> from
   ...>     timezones
   ...> where
   ...>     within(GeomFromText('POINT(139.7819661 35.6631424)'), timezones.Geometry);
Asia/Tokyo
CPU Time: user 0.108479 sys 0.064778
That’s a tenth of a second, or 100ms. Fast, but not brilliant.
Speeding it up with a geospatial index
It turns out SpatiaLite includes support for spatial indices, based on SQLite’s R*Tree module. R-Tree indexes can massively accelerate boundary box searches. Our searches are a lot more complex than that, acting as they do against extremely complex polygon shapes—but we can use a boundary box search to dramatically reduce the candidates we need to consider. Let’s create an index against our Geometry column:
SELECT CreateSpatialIndex('timezones', 'geometry');
To take advantage of this index, we need to expand our original SQL to first filter by geometries where their bounding box contains the point we are searching for. SpatiaLite has created an index table called idx_timezones_Geometry against which we can run an R-Tree optimized query. Here’s the SQL we will use:
select tzid
from
    timezones
where
    within(GeomFromText('POINT(139.7819661 35.6631424)'), timezones.Geometry)
    and rowid in (
        SELECT pkid FROM idx_timezones_Geometry
        where xmin < 139.7819661
        and xmax > 139.7819661
        and ymin < 35.6631424
        and ymax > 35.6631424
    );
How does this affect our performance?
spatialite> select tzid
   ...> from
   ...>     timezones
   ...> where
   ...>     within(GeomFromText('POINT(139.7819661 35.6631424)'), timezones.Geometry)
   ...>     and rowid in (
   ...>         SELECT pkid FROM idx_timezones_Geometry
   ...>         where xmin < 139.7819661
   ...>         and xmax > 139.7819661
   ...>         and ymin < 35.6631424
   ...>         and ymax > 35.6631424
   ...>     );
Asia/Tokyo
CPU Time: user 0.001541 sys 0.000111
From 100ms down to 1.5ms—nearly a 70x speedup! Not bad at all.
Building and publishing the API with Datasette
Now that we have a fast SQL query for finding a time zone for a latitude and longitude we can use Datasette to turn it into a JSON API.
The simplest way to do that looks like this:
datasette timezones.db \
    --load-extension=/usr/local/lib/mod_spatialite.dylib
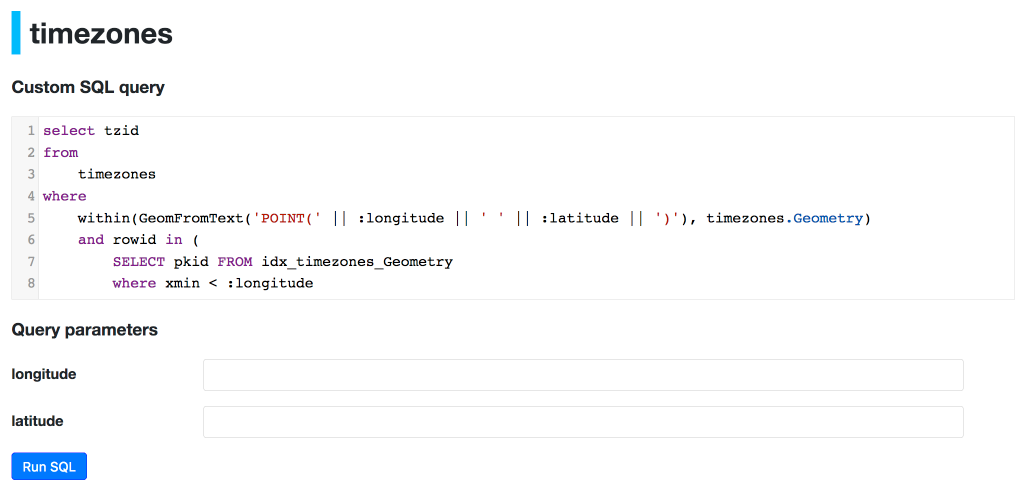
This will start Datasette on port 8001 and load the SpatiaLite extension. You can then navigate to localhost:8001/timezones in your browser and paste in the SQL query… which should look something like this:
This works (click the JSON link to get the result as JSON) but it’s a little inconvenient to use: you have to construct a URL with the same latitude and longitude repeated in multiple places.
We can improve things using Datasette’s support for SQLite named parameters. Here’s that same SQL query using parameters instead of hard-coded latitude and longitude points:
select tzid
from
    timezones
where
    within(GeomFromText('POINT(' || :longitude || ' ' || :latitude || ')'), timezones.Geometry)
    and rowid in (
        SELECT pkid FROM idx_timezones_Geometry
        where xmin < :longitude
        and xmax > :longitude
        and ymin < :latitude
        and ymax > :latitude)
If you paste this into Datasette it will detect the named parameters and turn them into URL querystring parameters hooked up (in thu UI) to HTML form fields.
To save us from having to include the full SQL in the URL every time we call our new API, let’s take advantage of a new feature introduced in Datasette 0.14: canned queries. These are named, pre-packaged queries that can be defined in a metadata.json file. The file looks like this:
{
    "title": "OpenStreetMap Time Zone Boundaries",
    "license": "ODbL",
    "license_url": "http://opendatacommons.org/licenses/odbl/",
    "source": "timezone-boundary-builder",
    "source_url": "https://github.com/evansiroky/timezone-boundary-builder",
    "databases": {
        "timezones": {
            "queries": {
                "by_point": "select tzid\nfrom\n    timezones\nwhere\n    within(GeomFromText('POINT(' || :longitude || ' ' || :latitude || ')'), timezones.Geometry)\n    and rowid in (\n        SELECT pkid FROM idx_timezones_Geometry\n        where xmin < :longitude\n        and xmax > :longitude\n        and ymin < :latitude\n        and ymax > :latitude\n    )"
            }
        }
    }
}
The canned query is defined as the by_point key in the queries nested object. I’m also adding license and source information here for the project, because it’s good manners.
We can try this in Datasette on our local machine like so:
datasette timezones.db -m metadata.json \
    --load-extension=/usr/local/lib/mod_spatialite.dylib
Now visiting localhost:8001/timezones/by_point will provide the interface for the query—and adding .json to the URL will turn it into an API.
Vizualizing time zones with Leaflet and GeoJSON
If you browse around in Datasette you’ll quickly run into a rather unfortunate problem. The localhost:8001/timezones/timezones page, which shows the first 100 rows in the table, takes a shockingly long time to load. When it eventually does load you’ll see why: each record includes an enormous binary string containing its the geometry. On my machine just that one page weighs in at 62MB of HTML!
This is bad: rendering that much HTML in one go can block the event loop and cause the application to become unresponsive. That giant blob of binary data isn’t exactly useful for humans, either.
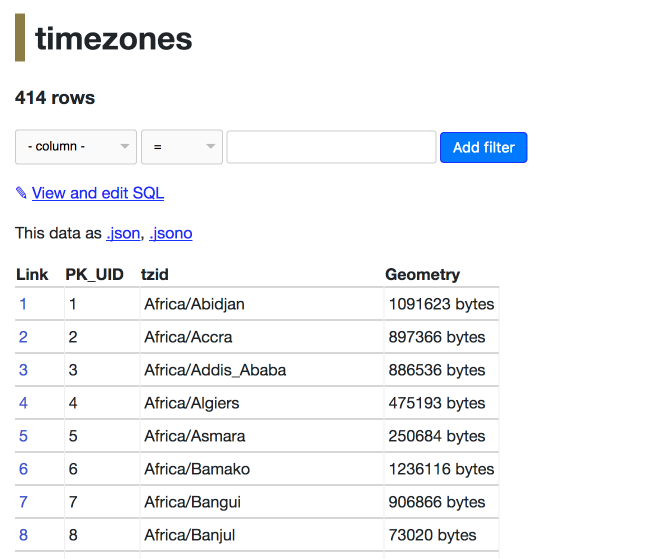
We can make some major improvements here using another Datasette 0.14 feature: custom templates. Let’s start with a replacement template that shows just the length of the binary string instead of attempting to render it.
We’ll do that by over-riding the _rows_and_columns.html include template, which is used by Datasette on both the table page and the page used to display individual rows. Since we only want to over-ride this template for one particular table we’ll create a file called _rows_and_columns-timezones-timezones.html—the file name means this will only over-ride the template timezones table in our timezones database. Here’s our new template:
<table>
    <thead>
        <tr>
            {% for column in display_columns %}
                <th scope="col">{{ column }}</th>
            {% endfor %}
        </tr>
    </thead>
    <tbody>
    {% for row in display_rows %}
        <tr>
            {% for cell in row %}
                <td>
                    {% if cell.column == 'Geometry' %}
                        {{ cell.value|length }} bytes
                    {% else %}
                        {{ cell.value }}
                    {% endif %}
                </td>
            {% endfor %}
        </tr>
    {% endfor %}
    </tbody>
</table>
If we put that in a directory called templates/ we can tell Datasette to use it like this:
datasette timezones.db -m metadata.json \
    --load-extension=/usr/local/lib/mod_spatialite.dylib \
    --template-dir=templates/
Our localhost:8001/timezones/timezones page now looks like this:
But wouldn’t it be neat if we could see the actual shapes of these time zones? It turns out that’s actually pretty easy, using the combination of GeoJSON and the Leaflet mapping library.
GeoJSON is a neat, widely supported standard for encoding geographic information such as polygon shapes as JSON. SpatiaLite ships with built-in GeoJSON support in the form of the AsGeoJSON SQL function. We can use that function to turn any of our time zone geometries into a GeoJSON string:
select AsGeoJSON(Geometry) from timezones where tzid = 'Asia/Tokyo';
If you run that with Datasette you’ll get back a string of GeoJSON. You can paste that into geojson.io to instantly visualize it.
The Leaflet mapping library supports GeoJSON out of the box. We can construct a custom row.html template for our Datasette that loads Leaflet from unpkg.com, uses fetch() to execute the AsGeoJSON query and renders the result in a map on the page. Here’s the result:
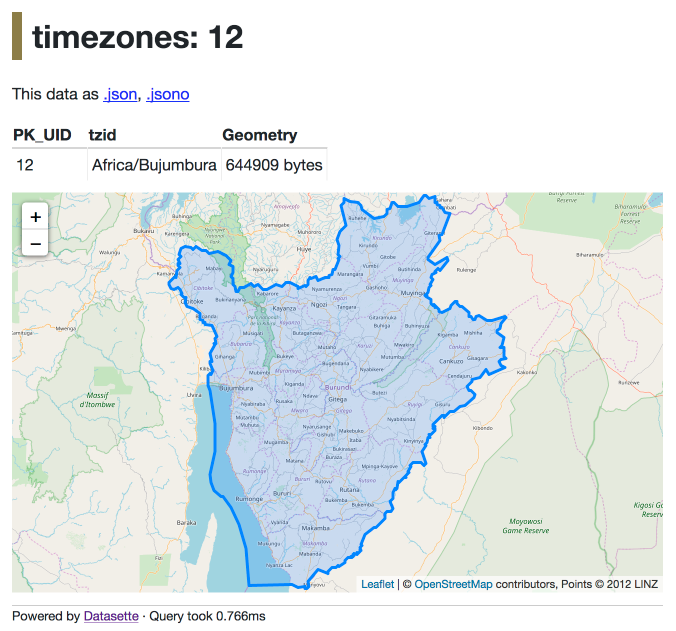
And here’s the row-timezones-timezones.html template:
{% extends "row.html" %}
{% block extra_head %}
<link rel="stylesheet" href="https://unpkg.com/leaflet@1.2.0/dist/leaflet.css" integrity="sha512-M2wvCLH6DSRazYeZRIm1JnYyh22purTM+FDB5CsyxtQJYeKq83arPe5wgbNmcFXGqiSH2XR8dT/fJISVA1r/zQ==" crossorigin=""/>
<script src="https://unpkg.com/leaflet@1.2.0/dist/leaflet.js" integrity="sha512-lInM/apFSqyy1o6s89K4iQUKg6ppXEgsVxT35HbzUupEVRh2Eu9Wdl4tHj7dZO0s1uvplcYGmt3498TtHq+log==" crossorigin=""></script>
<style>
#map {
margin-top: 1em;
width: 100%;
height: 400px;
}
</style>
{% endblock %}
{% block content %}
{{ super() }}
<div id="map"></div>
<script>
var pk = location.pathname.split('/').slice(-1)[0];
var tiles = L.tileLayer('https://{s}.tile.openstreetmap.org/{z}/{x}/{y}.png', {
maxZoom: 19,
detectRetina: true,
attribution: '© <a href="https://www.openstreetmap.org/copyright">OpenStreetMap</a> contributors, Points © 2012 LINZ'
});
var sql = 'select AsGeoJSON(Geometry) from timezones where PK_UID = ' + pk;
fetch('/timezones.json?sql=' + encodeURIComponent(sql)).then(r => r.json()).then(d => {
var map = L.map('map', {layers: [tiles]});
var geoJSON = JSON.parse(d.rows[0][0]);
var layer = L.geoJSON(geoJSON)
layer.addTo(map);
map.fitBounds(layer.getBounds());
});
</script>
{% endblock %}
Publishing it to the internet
Normally we would use the datasette publish command to publish our database to Heroku or Zeit Now, but the SpatiaLite dependency means that won’t work for this case. Instead, we need to construct a custom Dockerfile that builds the SpatiaLite module.
Since we’re using Docker, we may as well have the Dockerfile download the shapefiles and build the SpatiaLite database for us all in one go. Here’s a Dockerfile that does exactly that:
FROM python:3.6-slim-stretch

RUN apt update
RUN apt install -y python3-dev gcc spatialite-bin libsqlite3-mod-spatialite wget unzip

RUN pip install https://github.com/simonw/datasette/archive/master.zip

# Download and import the shapefiles
RUN wget https://github.com/evansiroky/timezone-boundary-builder/releases/download/2017c/timezones.shapefile.zip \
    && unzip timezones.shapefile.zip && \
    cd dist && \
    echo ".loadshp combined_shapefile timezones CP1252 23032\nSELECT CreateSpatialIndex('timezones', 'geometry');" | spatialite timezones.db && \
    mv timezones.db .. && \
    cd .. && rm -rf dist && rm timezones.shapefile.zip

ENV SQLITE_EXTENSIONS /usr/lib/x86_64-linux-gnu/mod_spatialite.so

ADD metadata.json metadata.json

ADD templates templates

RUN datasette inspect timezones.db --inspect-file inspect-data.json

EXPOSE 8001

CMD ["datasette", "serve", "timezones.db", "--host", "0.0.0.0", "--cors", "--port", "8001", "--inspect-file", "inspect-data.json", "-m", "metadata.json", "--template-dir", "templates"]
The full code, including the supporting templates, can be found in simonw/timezones-api on GitHub.
If you have Docker installed (Docker for Mac is a one-click install package these days, it’s impressively painless) you can build the container like this:
docker build . -t timezones-api
# Wait for the image to build
docker run -p 8001:8001 timezones-api
Then you can visit http://localhost:8001/ to see your freshly built Datasette in your browser.
The easiest way to publish it online is using Zeit Now. Simply run the now command in the directory containing the Dockerfile and Zeit will upload the entire directory, build the container in the cloud and deploy it with a fresh URL. It’s by far the easiest Docker deployment environment I’ve ever used.
Now can even deploy directly from a public GitHub repository… so you can deploy your own copy of the API by running the following command:
$ now simonw/timezones-api
> Didn't find directory. Searching on GitHub...
> Deploying GitHub repository "simonw/timezones-api" under simonw
> Ready! https://simonw-timezones-api-fbihjcbnog.now.sh (copied to clipboard) [2s]
> Initializing…
Canned queries + SpatiaLite = instant geospatial APIs
Hopefully this has helped illustrate the ease with which Datasette, SpatiaLite and canned queries can be used to create and publish geospatial APIs. Thanks to projects like OpenStreetMap the world is full of high quality open geospatial data. Go build something cool with it!
More recent articles
- Kimi K3, and what we can still learn from the pelican benchmark - 16th July 2026
- The new GPT-5.6 family: Luna, Terra, Sol - 9th July 2026
- sqlite-utils 4.0, now with database schema migrations - 7th July 2026