Simon Willison’s Weblog

Newsletter

Saturday, 14th November 2026

A new release of Datasette's longest untouched plugin, for rendering charts (using Vega-Lite against data in a table or custom query. The last release was in July 2018!

I finally bumped it for compatibility with the latest Datasette alphas, plus some cosmetic tweaks to make it work better with Datasette Lite.

(Datasette Lite just gained the ability to run JavaScript plugins like this! I'll write more about that soon.)

Since it works with Datasette Lite, the live demo in the README now links to this demo on Datasette Lite.
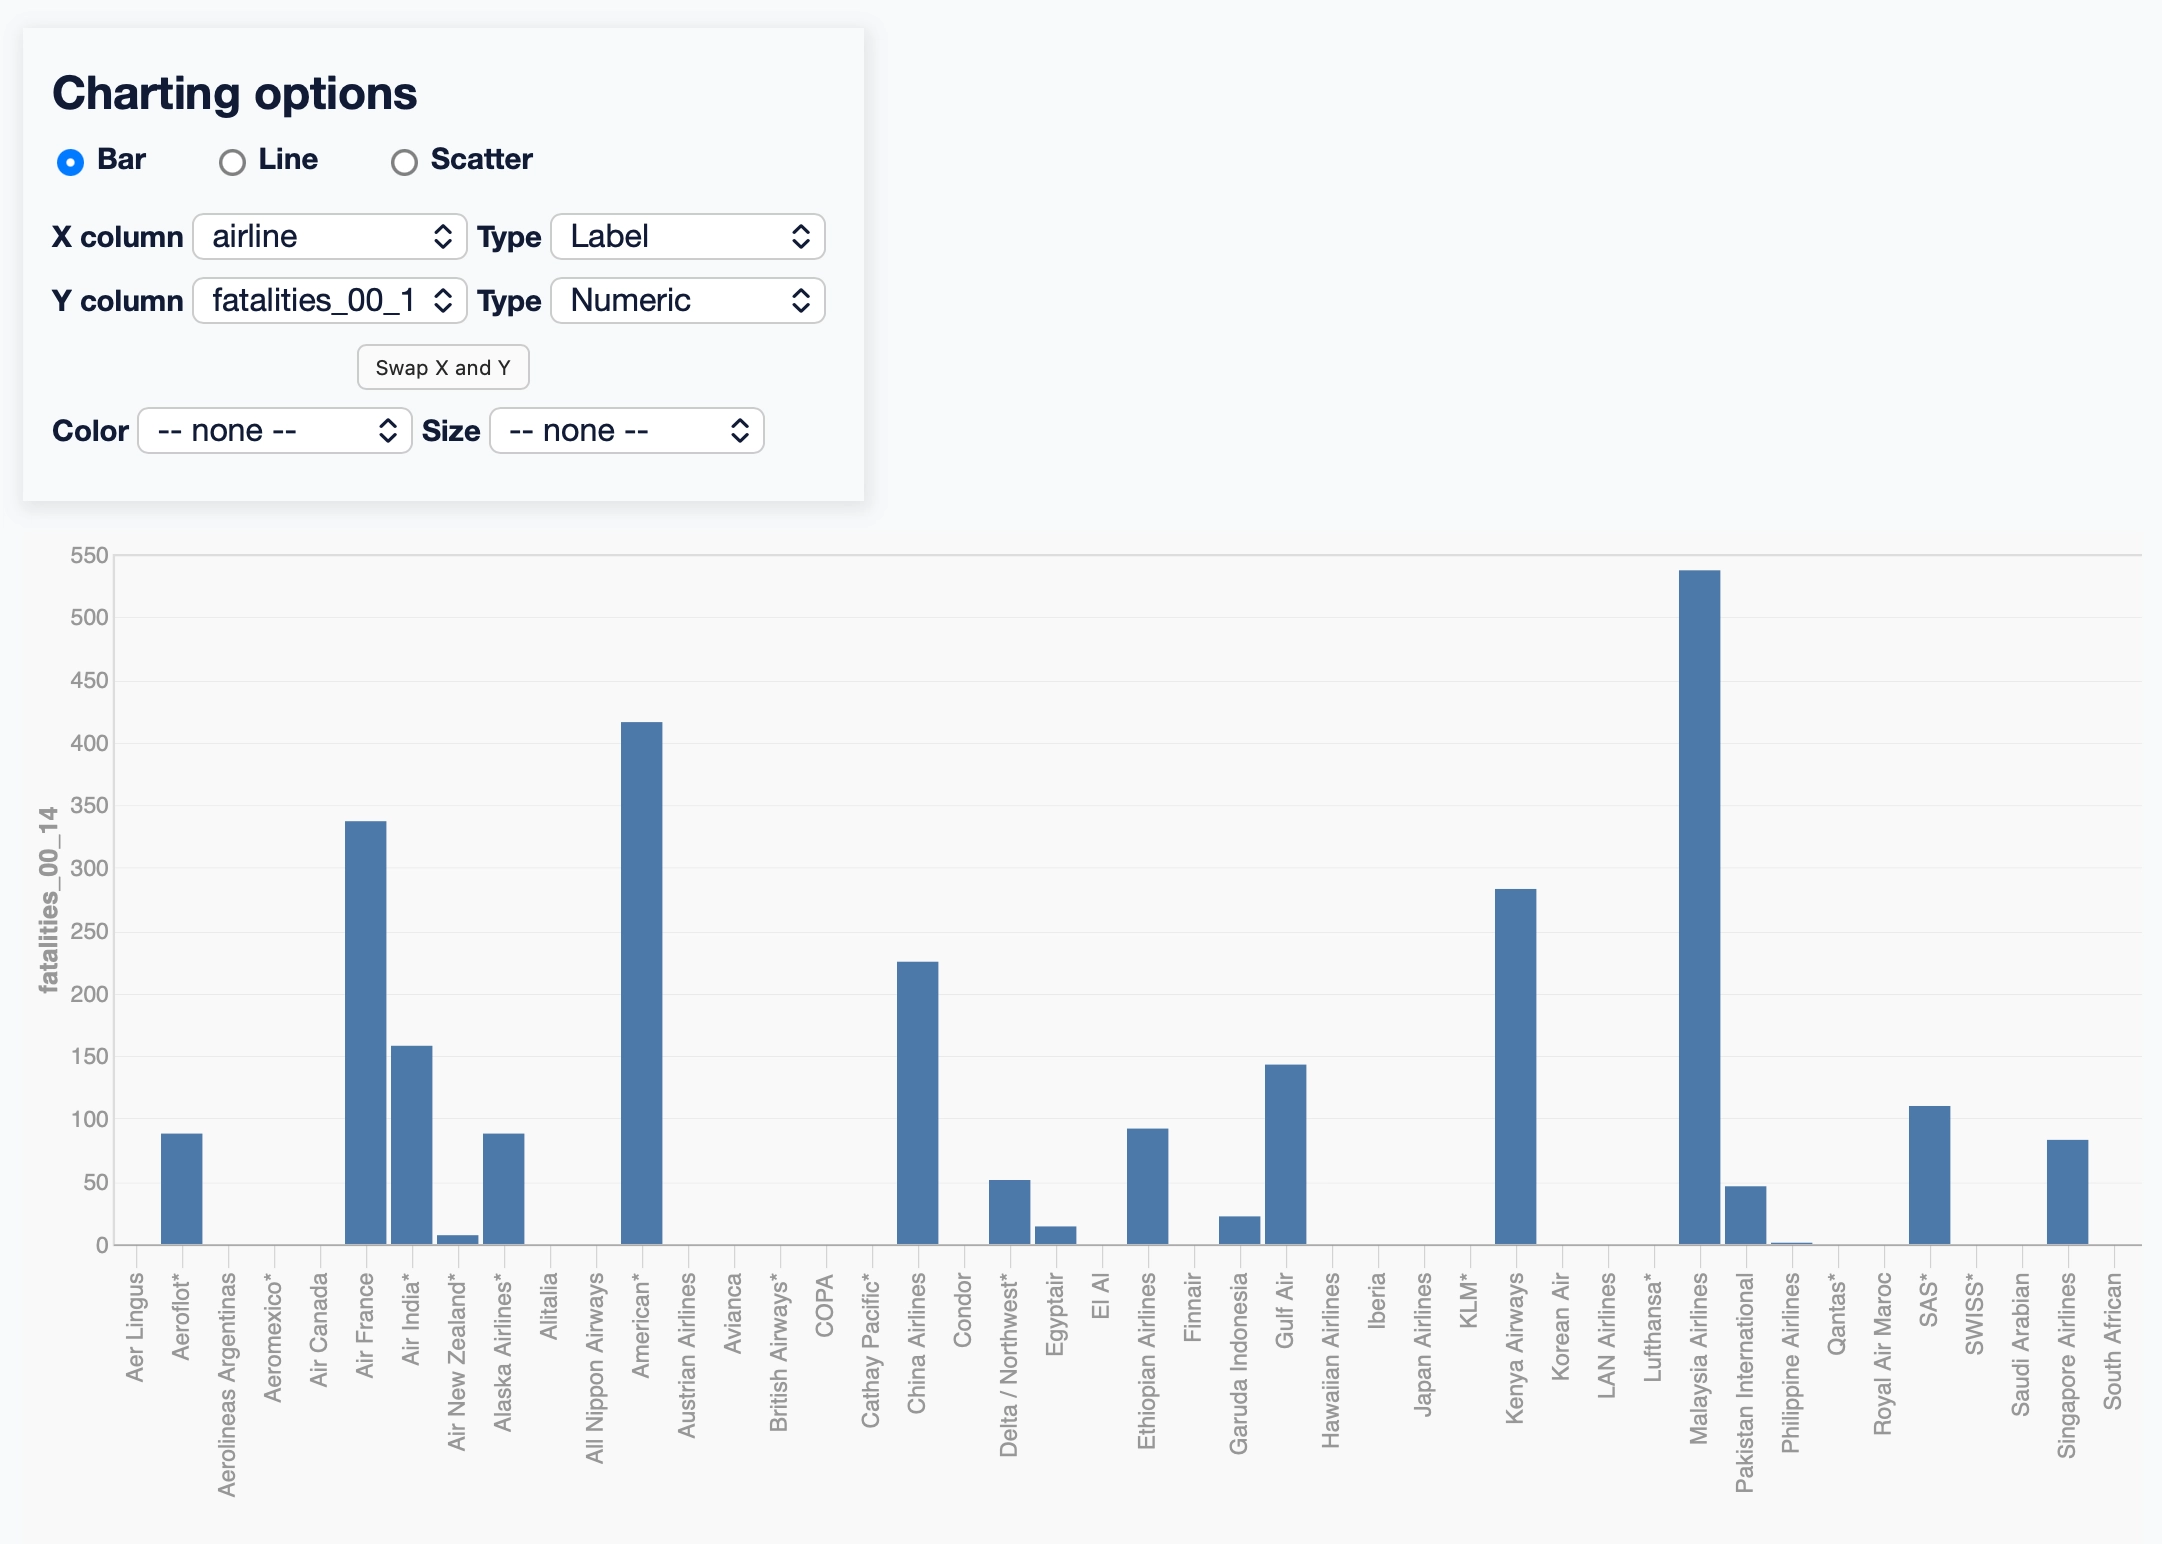
Screenshot of a charting tool. A panel headed "Charting options" has radio buttons for "Bar" (selected), "Line" and "Scatter". Below are select menus: "X column" set to "airline" with "Type" set to "Label", and "Y column" set to "fatalities_00_14" with "Type" set to "Numeric". A "Swap X and Y" button sits beneath those, followed by "Color" and "Size" menus both set to "-- none --". Underneath the panel is a blue bar chart with airline names along the X axis and fatalities_00_14 on the Y axis, running from 0 to 550 - most airlines have no bar, a handful have bars, and Malaysia Airlines is the tallest.

← Friday, 13th November 2026

2026 » November

MTWTFSS
      1
2345678
9101112131415
16171819202122
23242526272829
30