14th November 2026
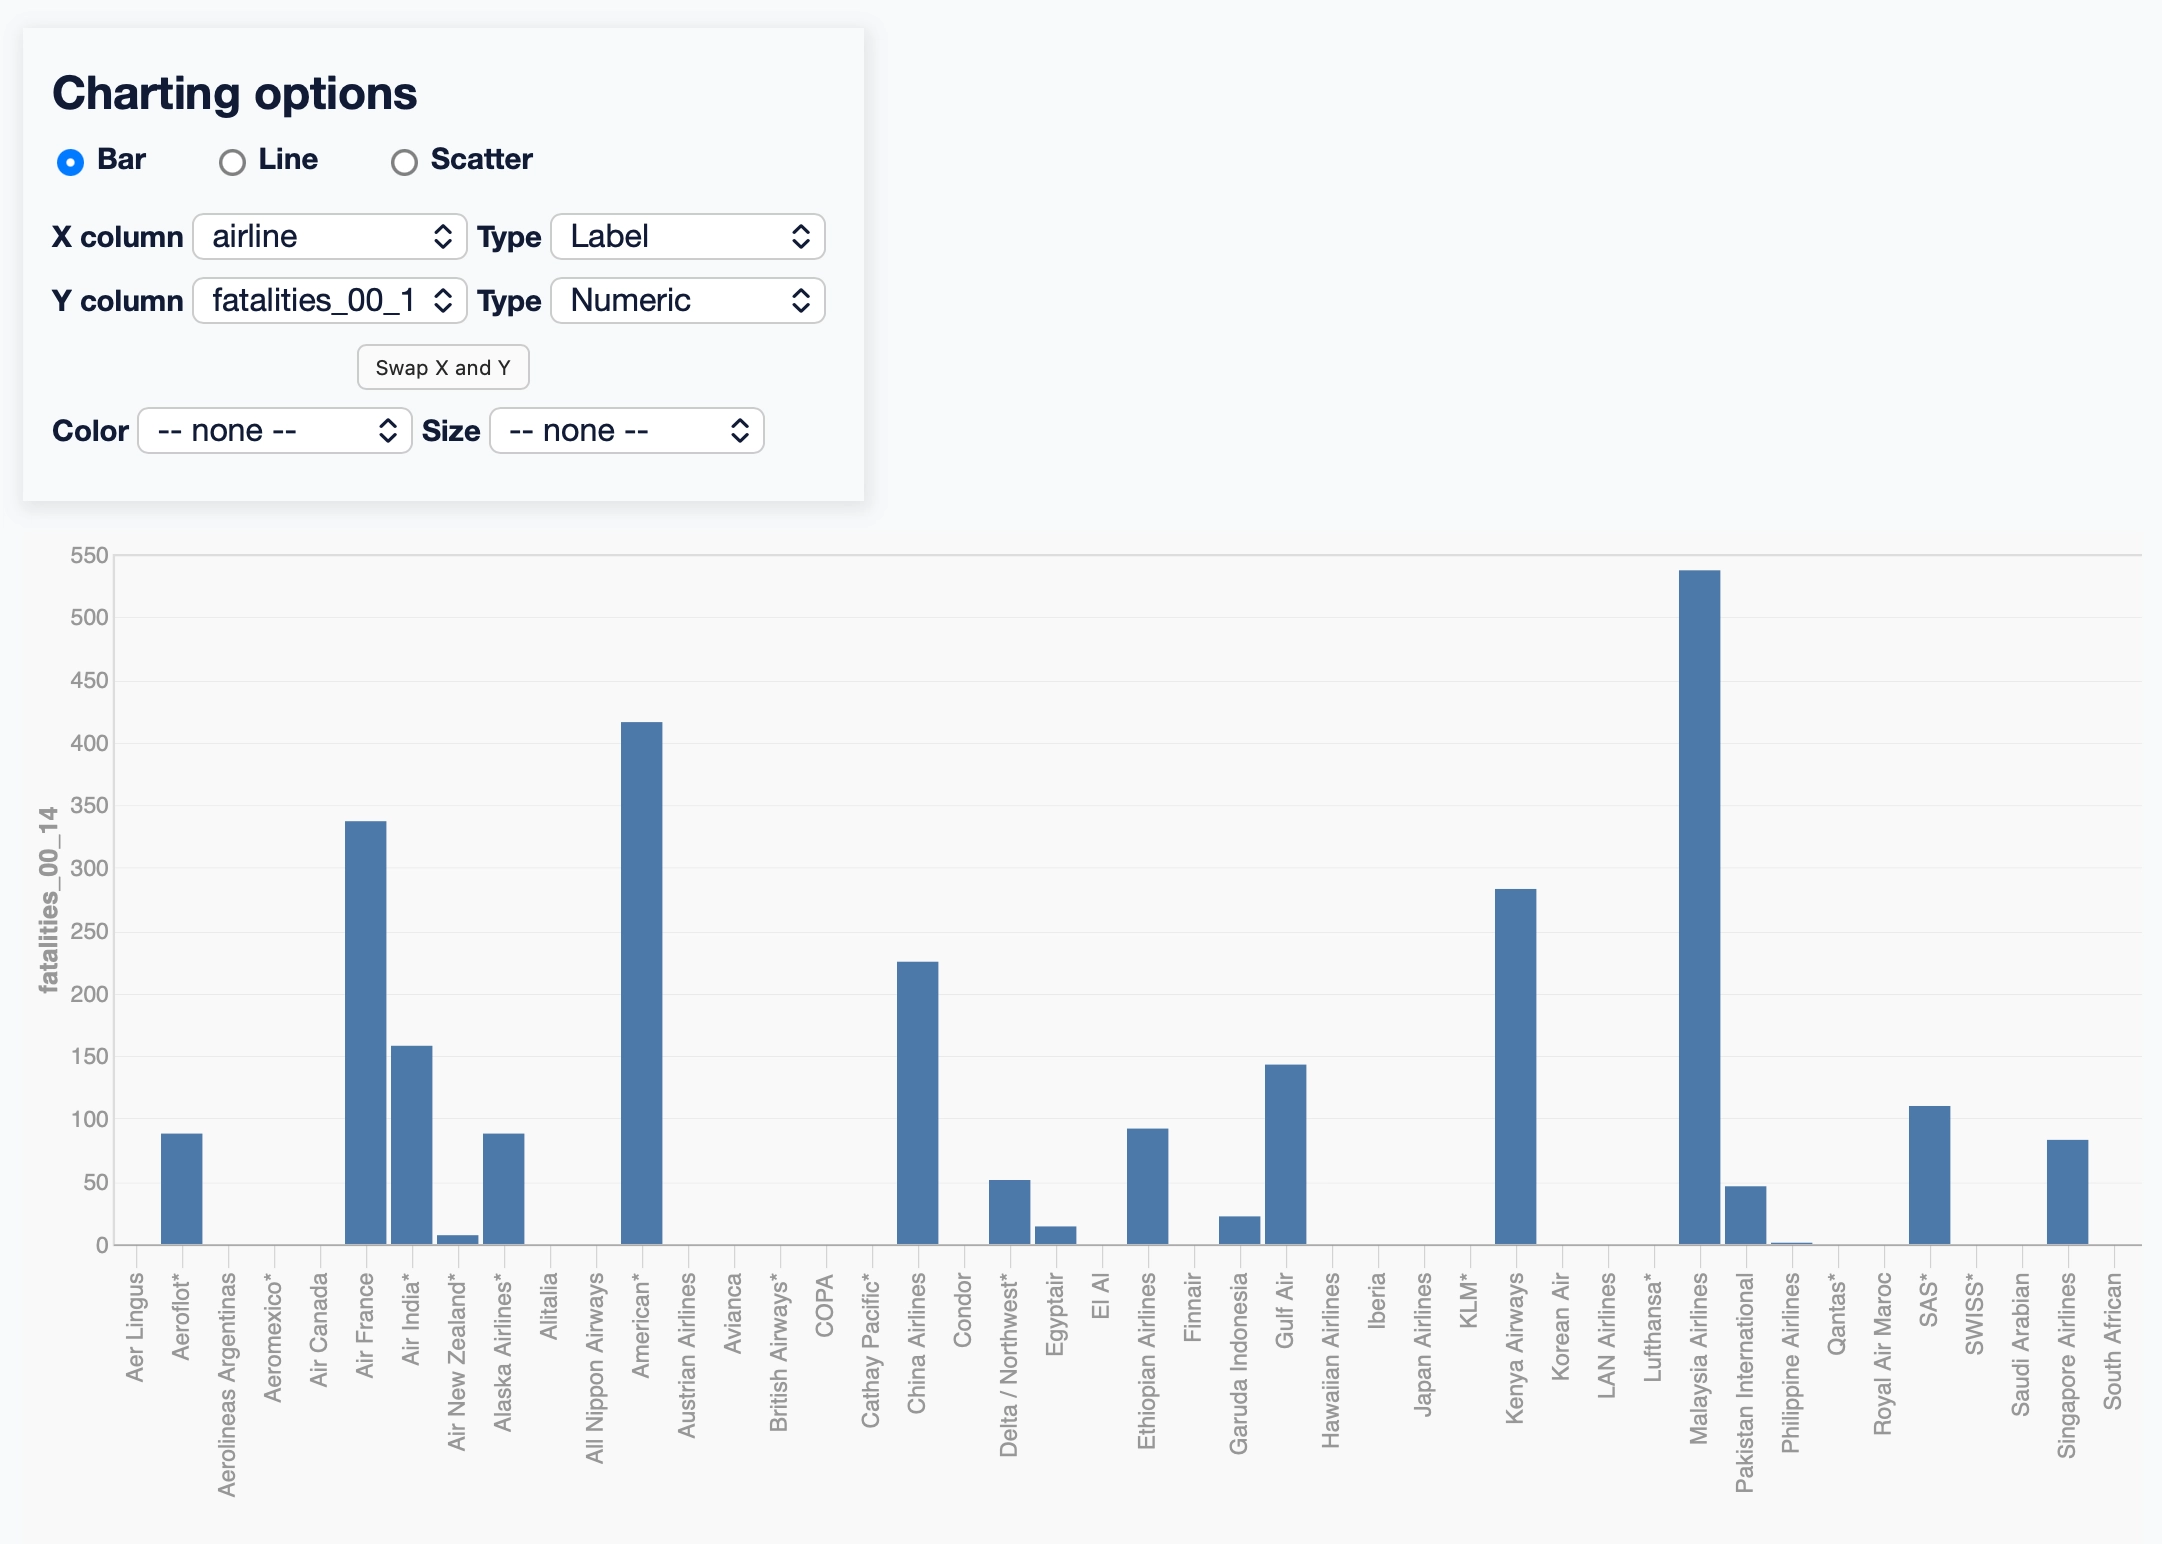
A new release of Datasette's longest untouched plugin, for rendering charts (using Vega-Lite against data in a table or custom query. The last release was in July 2018!
I finally bumped it for compatibility with the latest Datasette alphas, plus some cosmetic tweaks to make it work better with Datasette Lite.
(Datasette Lite just gained the ability to run JavaScript plugins like this! I'll write more about that soon.)
Since it works with Datasette Lite, the live demo in the README now links to this demo on Datasette Lite.
Recent articles
- Locating the source of a mysterious beep with Claude - 9th November 2026
- Hide your slop PR descriptions behind <details><summary> - 9th November 2026
- Qwen 3.8 27B on my laptop can interpret model weights, too - 3rd November 2026
- The U.S. Census Bureau and “Super Intelligence” - 2nd November 2026