Two new Showboat tools: Chartroom and datasette-showboat
17th February 2026
I introduced Showboat a week ago—my CLI tool that helps coding agents create Markdown documents that demonstrate the code that they have created. I’ve been finding new ways to use it on a daily basis, and I’ve just released two new tools to help get the best out of the Showboat pattern. Chartroom is a CLI charting tool that works well with Showboat, and datasette-showboat lets Showboat’s new remote publishing feature incrementally push documents to a Datasette instance.
- Showboat remote publishing
- datasette-showboat
- Chartroom
- How I built Chartroom
- The burgeoning Showboat ecosystem
Showboat remote publishing
I normally use Showboat in Claude Code for web (see note from this morning). I’ve used it in several different projects in the past few days, each of them with a prompt that looks something like this:
Use "uvx showboat --help" to perform a very thorough investigation of what happens if you use the Python sqlite-chronicle and sqlite-history-json libraries against the same SQLite database table
Here’s the resulting document.
Just telling Claude Code to run uvx showboat --help is enough for it to learn how to use the tool—the help text is designed to work as a sort of ad-hoc Skill document.
The one catch with this approach is that I can’t see the new Showboat document until it’s finished. I have to wait for Claude to commit the document plus embedded screenshots and push that to a branch in my GitHub repo—then I can view it through the GitHub interface.
For a while I’ve been thinking it would be neat to have a remote web server of my own which Claude instances can submit updates to while they are working. Then this morning I realized Showboat might be the ideal mechanism to set that up...
Showboat v0.6.0 adds a new “remote” feature. It’s almost invisible to users of the tool itself, instead being configured by an environment variable.
Set a variable like this:
export SHOWBOAT_REMOTE_URL=https://www.example.com/submit?token=xyzAnd every time you run a showboat init or showboat note or showboat exec or showboat image command the resulting document fragments will be POSTed to that API endpoint, in addition to the Showboat Markdown file itself being updated.
There are full details in the Showboat README—it’s a very simple API format, using regular POST form variables or a multipart form upload for the image attached to showboat image.
datasette-showboat
It’s simple enough to build a webapp to receive these updates from Showboat, but I needed one that I could easily deploy and would work well with the rest of my personal ecosystem.
So I had Claude Code write me a Datasette plugin that could act as a Showboat remote endpoint. I actually had this building at the same time as the Showboat remote feature, a neat example of running parallel agents.
datasette-showboat is a Datasette plugin that adds a /-/showboat endpoint to Datasette for viewing documents and a /-/showboat/receive endpoint for receiving updates from Showboat.
Here’s a very quick way to try it out:
uvx --with datasette-showboat --prerelease=allow \
  datasette showboat.db --create \
  -s plugins.datasette-showboat.database showboat \
  -s plugins.datasette-showboat.token secret123 \
  --root --secret cookie-secret-123
Click on the sign in as root link that shows up in the console, then navigate to http://127.0.0.1:8001/-/showboat to see the interface.
Now set your environment variable to point to this instance:
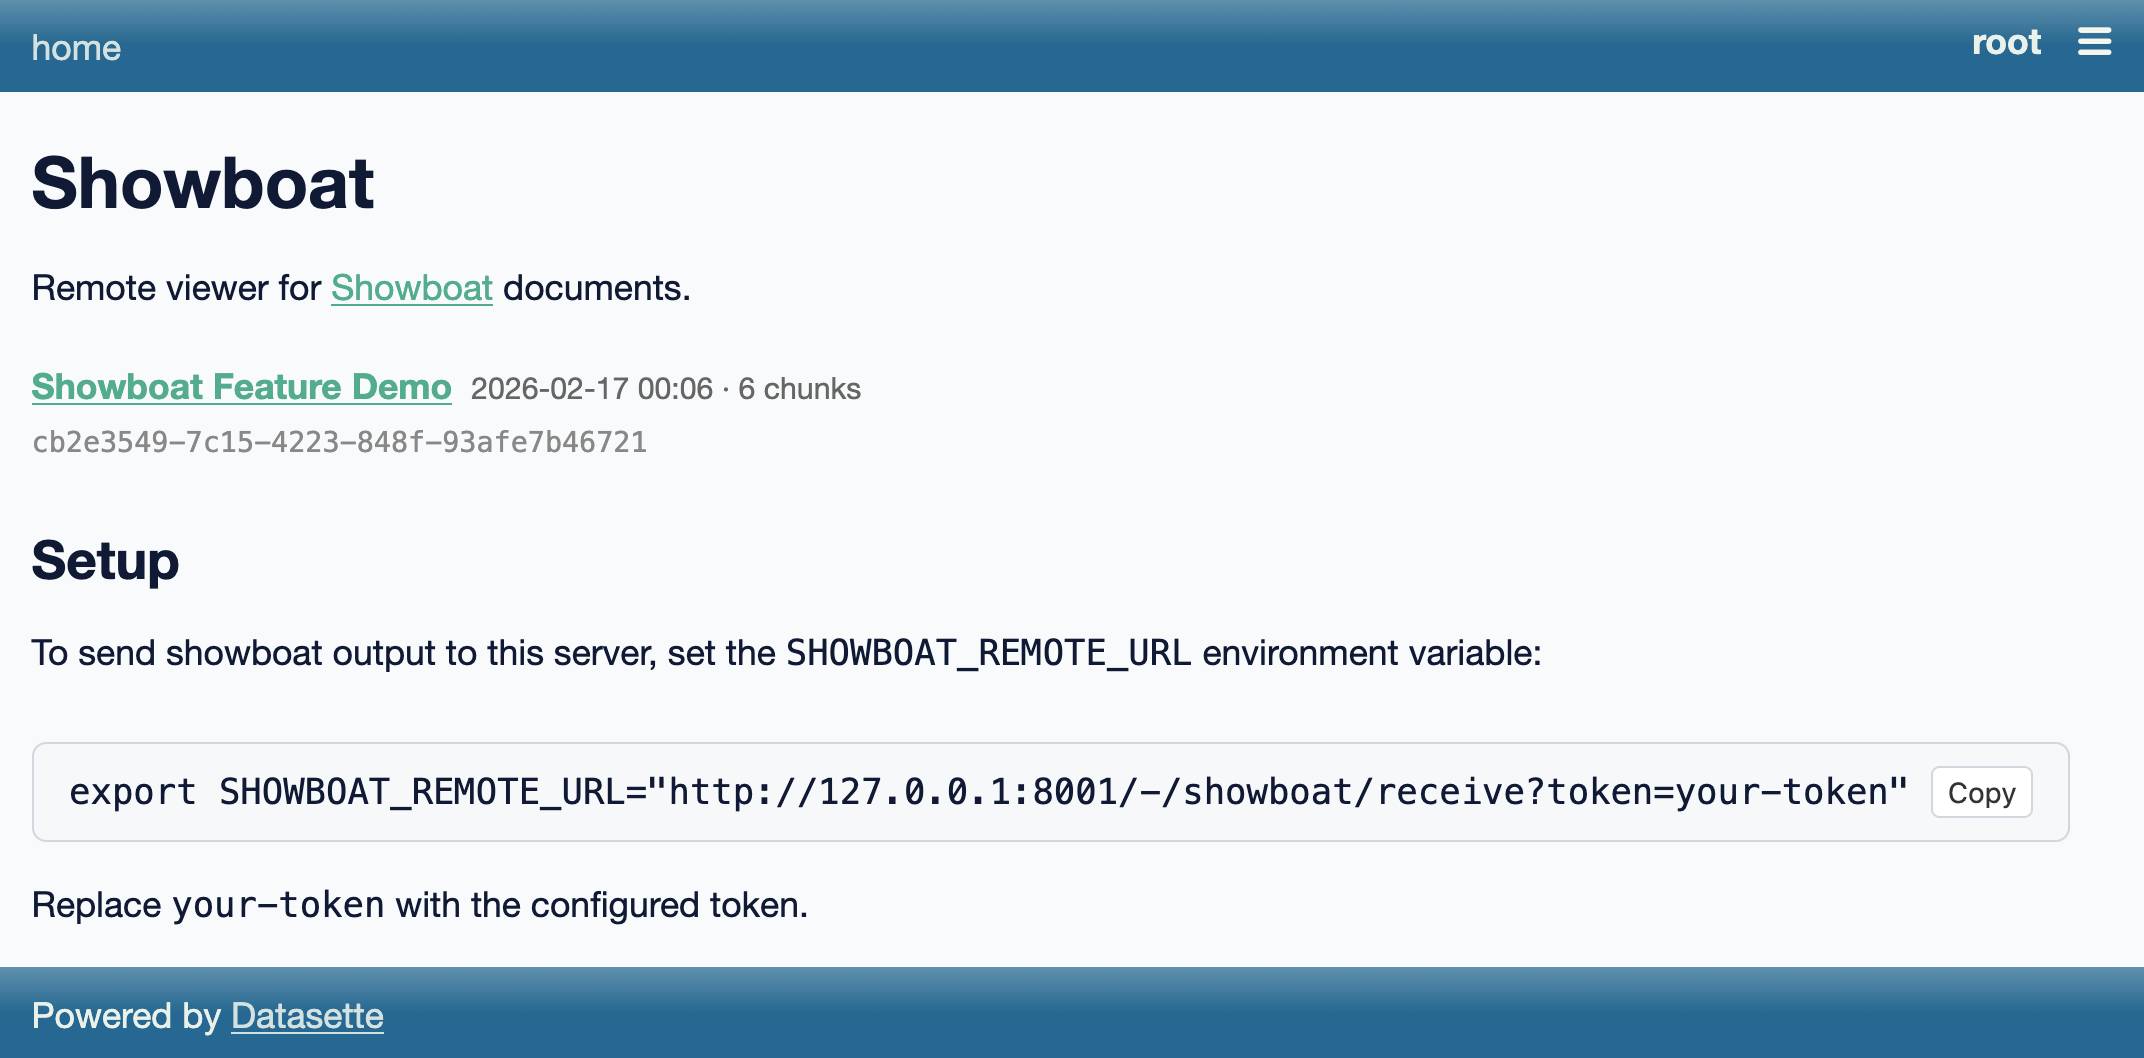
export SHOWBOAT_REMOTE_URL="http://127.0.0.1:8001/-/showboat/receive?token=secret123"And run Showboat like this:
uvx showboat init demo.md "Showboat Feature Demo"Refresh that page and you should see this:
Click through to the document, then start Claude Code or Codex or your agent of choice and prompt:
Run 'uvx showboat --help' and then use showboat to add to the existing demo.md document with notes and exec and image to demonstrate the tool - fetch a placekitten for the image demo.
The init command assigns a UUID and title and sends those up to Datasette.
The best part of this is that it works in Claude Code for web. Run the plugin on a server somewhere (an exercise left up to the reader—I use Fly.io to host mine) and set that SHOWBOAT_REMOTE_URL environment variable in your Claude environment, then any time you tell it to use Showboat the document it creates will be transmitted to your server and viewable in real time.
I built Rodney, a CLI browser automation tool, specifically to work with Showboat. It makes it easy to have a Showboat document load up web pages, interact with them via clicks or injected JavaScript and captures screenshots to embed in the Showboat document and show the effects.
This is wildly useful for hacking on web interfaces using Claude Code for web, especially when coupled with the new remote publishing feature. I only got this stuff working this morning and I’ve already had several sessions where Claude Code has published screenshots of its work in progress, which I’ve then been able to provide feedback on directly in the Claude session while it’s still working.
Chartroom
A few days ago I had another idea for a way to extend the Showboat ecosystem: what if Showboat documents could easily include charts?
I sometimes fire up Claude Code for data analysis tasks, often telling it to download a SQLite database and then run queries against it to figure out interesting things from the data.
With a simple CLI tool that produced PNG images I could have Claude use Showboat to build a document with embedded charts to help illustrate its findings.
Chartroom is exactly that. It’s effectively a thin wrapper around the excellent matplotlib Python library, designed to be used by coding agents to create charts that can be embedded in Showboat documents.
Here’s how to render a simple bar chart:
echo 'name,value
Alice,42
Bob,28
Charlie,35
Diana,51
Eve,19' | uvx chartroom bar --csv \
  --title 'Sales by Person' --ylabel 'Sales'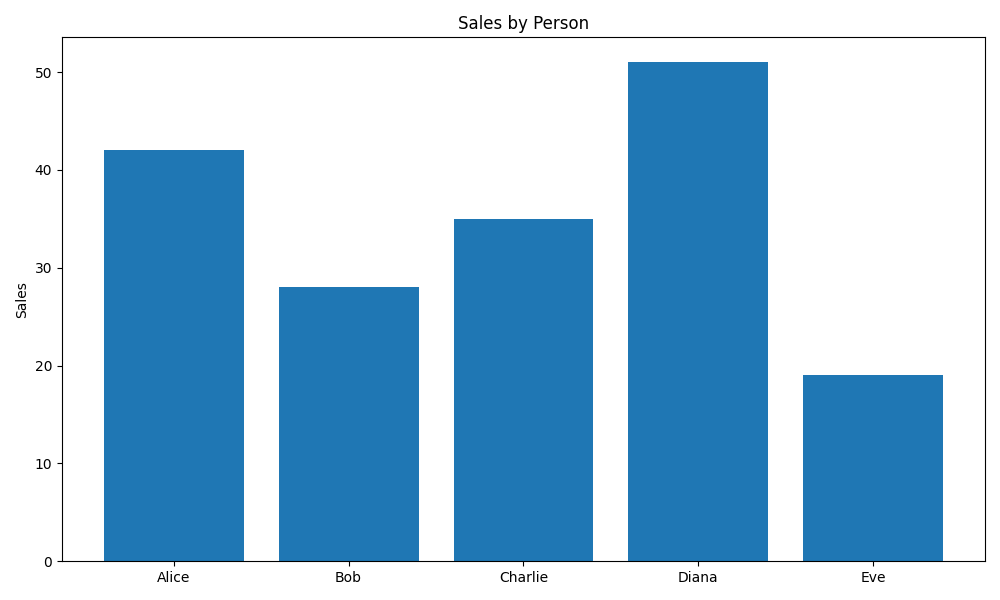
It can also do line charts, bar charts, scatter charts, and histograms—as seen in this demo document that was built using Showboat.
Chartroom can also generate alt text. If you add -f alt to the above it will output the alt text for the chart instead of the image:
echo 'name,value
Alice,42
Bob,28
Charlie,35
Diana,51
Eve,19' | uvx chartroom bar --csv \
  --title 'Sales by Person' --ylabel 'Sales' -f alt
Outputs:
Sales by Person. Bar chart of value by name — Alice: 42, Bob: 28, Charlie: 35, Diana: 51, Eve: 19
Or you can use -f html or -f markdown to get the image tag with alt text directly:
I added support for Markdown images with alt text to Showboat in v0.5.0, to complement this feature of Chartroom.
Finally, Chartroom has support for different matplotlib styles. I had Claude build a Showboat document to demonstrate these all in one place—you can see that at demo/styles.md.
How I built Chartroom
I started the Chartroom repository with my click-app cookiecutter template, then told a fresh Claude Code for web session:
We are building a Python CLI tool which uses matplotlib to generate a PNG image containing a chart. It will have multiple sub commands for different chart types, controlled by command line options. Everything you need to know to use it will be available in the single “chartroom --help” output.
It will accept data from files or standard input as CSV or TSV or JSON, similar to how sqlite-utils accepts data—clone simonw/sqlite-utils to /tmp for reference there. Clone matplotlib/matplotlib for reference as well
It will also accept data from --sql path/to/sqlite.db “select ...” which runs in read-only mode
Start by asking clarifying questions—do not use the ask user tool though it is broken—and generate a spec for me to approve
Once approved proceed using red/green TDD running tests with “uv run pytest”
Also while building maintain a demo/README.md document using the “uvx showboat --help” tool—each time you get a new chart type working commit the tests, implementation, root level README update and a new version of that demo/README.md document with an inline image demo of the new chart type (which should be a UUID image filename managed by the showboat image command and should be stored in the demo/ folder
Make sure “uv build” runs cleanly without complaining about extra directories but also ensure dist/ and uv.lock are in gitignore
This got most of the work done. You can see the rest in the PRs that followed.
The burgeoning Showboat ecosystem
The Showboat family of tools now consists of Showboat itself, Rodney for browser automation, Chartroom for charting and datasette-showboat for streaming remote Showboat documents to Datasette.
I’m enjoying how these tools can operate together based on a very loose set of conventions. If a tool can output a path to an image Showboat can include that image in a document. Any tool that can output text can be used with Showboat.
I’ll almost certainly be building more tools that fit this pattern. They’re very quick to knock out!
The environment variable mechanism for Showboat’s remote streaming is a fun hack too—so far I’m just using it to stream documents somewhere else, but it’s effectively a webhook extension mechanism that could likely be used for all sorts of things I haven’t thought of yet.
More recent articles
- Vibe coding SwiftUI apps is a lot of fun - 27th March 2026
- Experimenting with Starlette 1.0 with Claude skills - 22nd March 2026
- Profiling Hacker News users based on their comments - 21st March 2026