Measuring traffic during the Half Moon Bay Pumpkin Festival
19th October 2022
This weekend was the 50th annual Half Moon Bay Pumpkin Festival.
We live in El Granada, a tiny town 8 minutes drive from Half Moon Bay. There is a single road (coastal highway one) between the two towns, and the festival is locally notorious for its impact on traffic.
Natalie suggested that we measure the traffic and try and see the impact for ourselves!
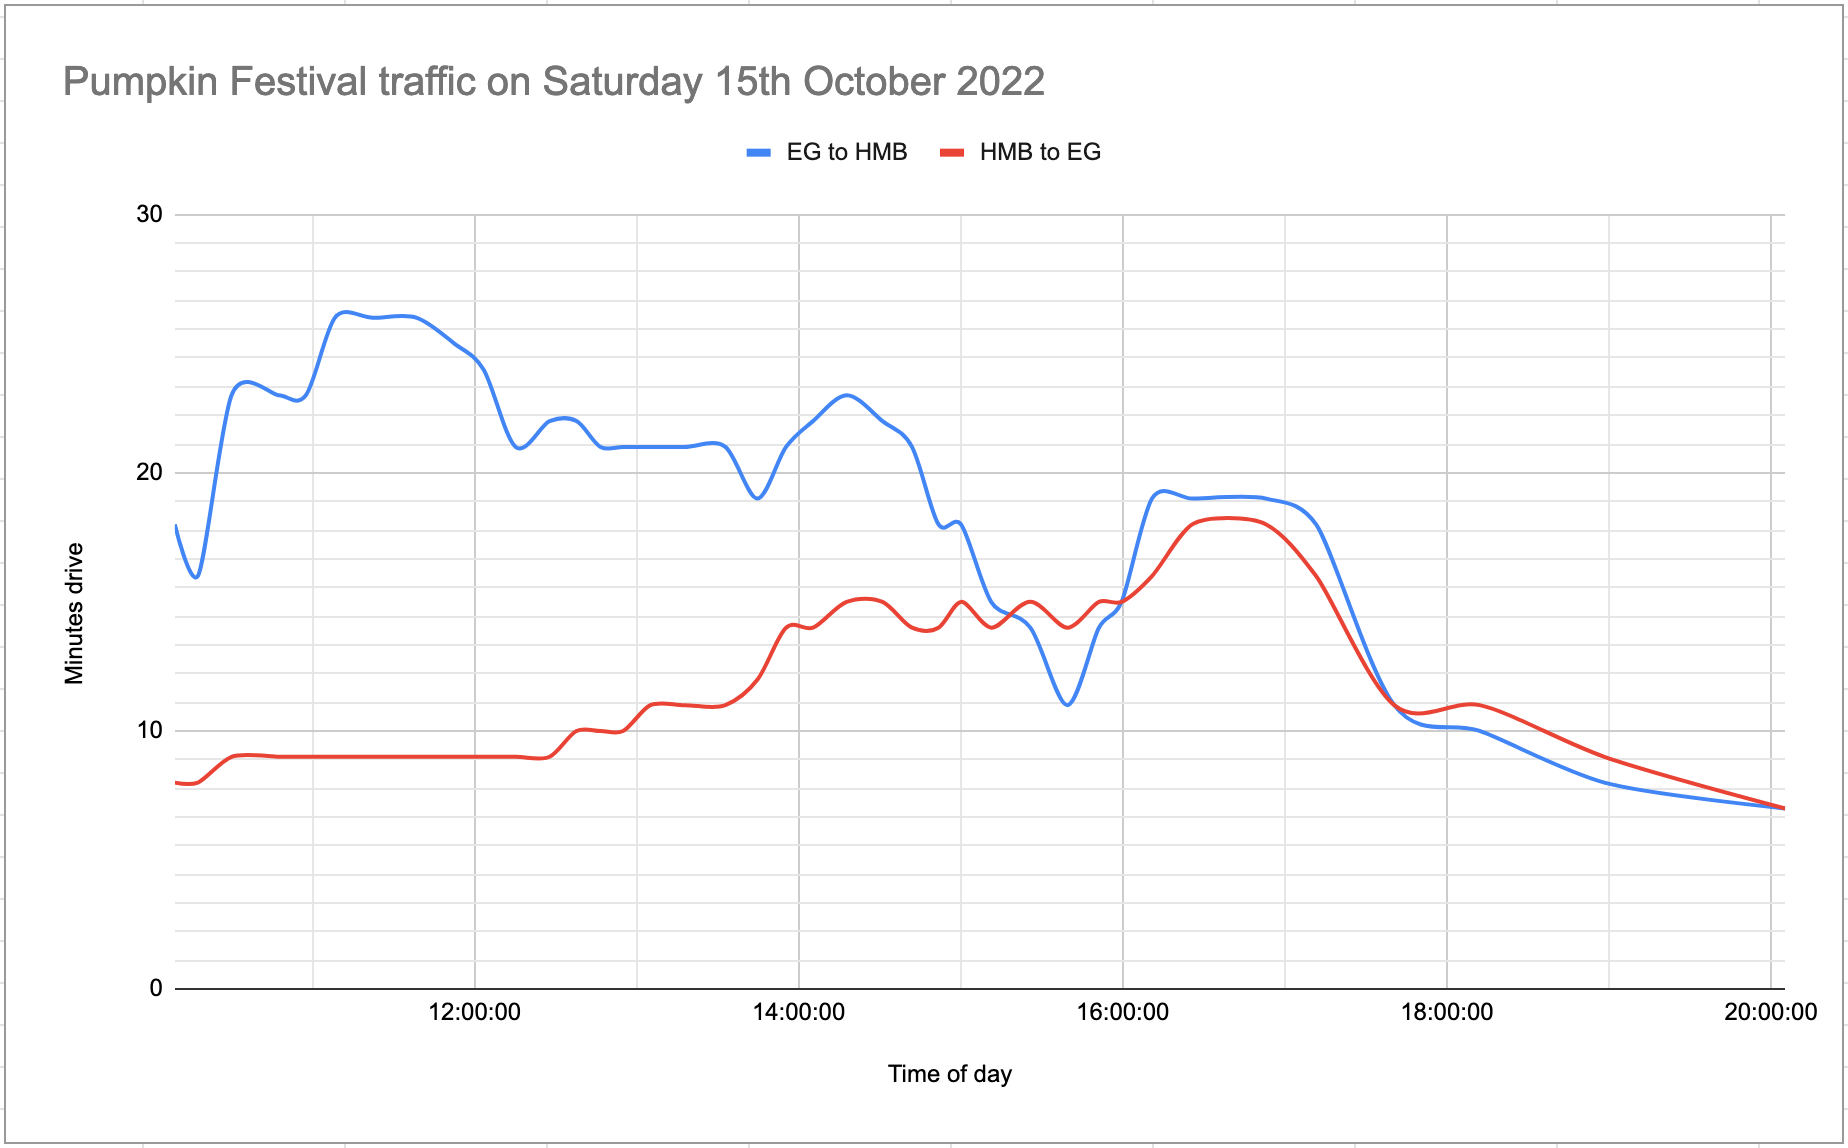
Here’s the end result for Saturday. Read on for details on how we created it.
Collecting the data
I built a git scraper to gather data from the Google Maps Directions API. It turns out if you pass departure_time=now to that API it returns the current estimated time in traffic as part of the response.
I picked a location in Half Moon Bay an a location in El Granada and constructed the following URL (pretty-printed):
https://maps.googleapis.com/maps/api/directions/json?
  origin=GG49%2BCH,%20Half%20Moon%20Bay%20CA
  &destination=FH78%2BQJ,%20Half%20Moon%20Bay,%20CA
  &departure_time=now
  &key=$GOOGLE_MAPS_KEY
The two locations here are defined using Google Plus codes. Here they are on Google Maps:
I constructed the reverse of the URL too, to track traffic in the other direction. Then I rigged up a scheduled GitHub Actions workflow in this repository to fetch this API data, pretty-print it with jq and write it to the repsoitory:
name: Scrape traffic

on:
  push:
  workflow_dispatch:
  schedule:
  - cron:  '*/5 * * * *'

jobs:
  shot-scraper:
    runs-on: ubuntu-latest
    steps:
    - uses: actions/checkout@v2
    - name: Scrape
      env:
        GOOGLE_MAPS_KEY: ${{ secrets.GOOGLE_MAPS_KEY }}
      run: |
        curl "https://maps.googleapis.com/maps/api/directions/json?origin=GG49%2BCH,%20Half%20Moon%20Bay%20CA&destination=FH78%2BQJ,%20Half%20Moon%20Bay,%20California&departure_time=now&key=$GOOGLE_MAPS_KEY" | jq > one.json
        sleep 3
        curl "https://maps.googleapis.com/maps/api/directions/json?origin=FH78%2BQJ,%20Half%20Moon%20Bay%20CA&destination=GG49%2BCH,%20Half%20Moon%20Bay,%20California&departure_time=now&key=$GOOGLE_MAPS_KEY" | jq > two.json
    - name: Commit and push
      run: |-
        git config user.name "Automated"
        git config user.email "actions@users.noreply.github.com"
        git add -A
        timestamp=$(date -u)
        git commit -m "${timestamp}" || exit 0
        git pull --rebase
        git push
I’m using a GitHub Actions secret called GOOGLE_MAPS_KEY to store the Google Maps API key.
This workflow runs every 5 minutes (more-or-less—GitHub Actions doesn’t necessarily stick to the schedule). It fetches the two JSON results and writes them to files called one.json and two.json
... and that was the initial setup for the project. This took me about fifteen minutes to put in place, because I’ve built systems like this so many times before. I launched it at about 10am on Saturday and left it to collect data.
Analyzing the data and drawing some charts
The trick with git scraping is that the data you care about ends up captured in the git commit log. The challenge is how to extract that back out again and turn it into something useful.
My git-history tool is designed to solve this. It’s a command-line utility which can iterate through every version of a file stored in a git repository, extracting information from that file out into a SQLite database table and creating a new row for every commit.
Normally I run it against CSV or JSON files containing an array of rows—effectively tabular data already, where I just want to record what has changed in between commits.
For this project, I was storing the raw JSON output by the Google Maps API. I didn’t care about most of the information in there: I really just wanted the duration_in_traffic value.
git-history can accept a snippet of Python code that will be run against each stored copy of a file. The snippet should return a list of JSON objects (as Python dictionaries) which the rest of the tool can then use to figure out what has changed.
To cut a long story short, here’s the incantation that worked:
git-history file hmb.db one.json \
--convert '
try:
    duration_in_traffic = json.loads(content)["routes"][0]["legs"][0]["duration_in_traffic"]["value"]
    return [{"id": "one", "duration_in_traffic": duration_in_traffic}]
except Exception as ex:
    return []
' \
  --full-versions \
  --id id
The git-history file command is used to load the history for a specific file—in this case it’s the file one.json, which will be loaded into a new SQLite database file called hm.db.
The --convert code uses json.loads(content) to load the JSON for the current file version, then pulls out the ["routes"][0]["legs"][0]["duration_in_traffic"]["value"] nested value from it.
If that’s missing (e.g. in an earlier commit, when I hadn’t yet added the departure_time=now parameter to the URL) an exception will be caught and the function will return an empty list.
If the duration_in_traffic value is present, the function returns the following:
[{"id": "one", "duration_in_traffic": duration_in_traffic}]
git-history likes lists of dictionaries. It’s usually being run against files that contain many different rows, where the id column can be used to de-dupe rows across commits and spot what has changed.
In this case, each file only has a single interesting value.
Two more options are used here:
-
--full-versions—tellsgit-historyto store all of the columns, not just columns that have changed since the last run. The default behaviour here is to store anullif a value has not changed in order to save space, but our data is tiny here so we don’t need any clever optimizations. -
--id idspecifies the ID column that should be used to de-dupe changes. Again, not really important for this tiny project.
After running the above command, the resulting schema includes these tables:
CREATE TABLE [commits] (
   [id] INTEGER PRIMARY KEY,
   [namespace] INTEGER REFERENCES [namespaces]([id]),
   [hash] TEXT,
   [commit_at] TEXT
);
CREATE TABLE [item_version] (
   [_id] INTEGER PRIMARY KEY,
   [_item] INTEGER REFERENCES [item]([_id]),
   [_version] INTEGER,
   [_commit] INTEGER REFERENCES [commits]([id]),
   [id] TEXT,
   [duration_in_traffic] INTEGER
);
The commits table includes the date of the commit—commit_at.
The item_version table has that duration_in_traffic value.
So... to get back the duration in traffic at different times of day I can run this SQL query to join those two tables together:
select
    commits.commit_at,
    duration_in_traffic
from
    item_version
join
    commits on item_version._commit = commits.id
order by
    commits.commit_at
That query returns data that looks like this:
| commit_at | duration_in_traffic |
|---|---|
| 2022-10-15T17:09:06+00:00 | 1110 |
| 2022-10-15T17:17:38+00:00 | 1016 |
| 2022-10-15T17:30:06+00:00 | 1391 |
A couple of problems here. First, the commit_at column is in UTC, not local time. And duration_in_traffic is in seconds, which aren’t particularly easy to read.
Here’s a SQLite fix for these two issues:
select
    time(datetime(commits.commit_at, '-7 hours')) as t,
    duration_in_traffic / 60 as mins_in_traffic
from
    item_version
join
    commits on item_version._commit = commits.id
order by
    commits.commit_at
| t | mins_in_traffic |
|---|---|
| 10:09:06 | 18 |
| 10:17:38 | 16 |
| 10:30:06 | 23 |
datetime(commits.commit_at, '-7 hours') parses the UTC string as a datetime, and then subsracts 7 hours from it to get the local time in California converted from UTC.
I wrap that in time() here because for the chart I want to render I know everything will be on the same day.
mins_in_traffic now shows minutes, not seconds.
We now have enough data to render a chart!
But... we only have one of the two directions of traffic here. To process the numbers from two.json as well I ran this:
git-history file hmb.db two.json \
--convert '
try:
    duration_in_traffic = json.loads(content)["routes"][0]["legs"][0]["duration_in_traffic"]["value"]
    return [{"id": "two", "duration_in_traffic": duration_in_traffic}]
except Exception as ex:
    return []
' \
  --full-versions \
  --id id --namespace item2
This is almost the same as the previous command. It’s running against two.json instead of one.json, and it’s using the --namespace item2 option.
This causes it to populate a new table called item2_version instead of item_version, which is a cheap trick to avoid having to figure out how to load both files into the same table.
Two lines on one chart
I rendered an initial single line chart using datasette-vega, but Natalie suggested that putting lines on the same chart for the two directions of traffic would be more interesting.
Since I now had one table for each direction of traffic (item_version and item_version2) I decided to combine those into a single table, suitable for pasting into Google Sheets.
Here’s the SQL I came up with to do that:
with item1 as (
  select
    time(datetime(commits.commit_at, '-7 hours')) as t,
    duration_in_traffic / 60 as mins_in_traffic
  from
    item_version
    join commits on item_version._commit = commits.id
  order by
    commits.commit_at
),
item2 as (
  select
    time(datetime(commits.commit_at, '-7 hours')) as t,
    duration_in_traffic / 60 as mins_in_traffic
  from
    item2_version
    join commits on item2_version._commit = commits.id
  order by
    commits.commit_at
)
select
  item1.*,
  item2.mins_in_traffic as mins_in_traffic_other_way
from
  item1
  join item2 on item1.t = item2.t
This uses two CTEs (Common Table Expressions—the with X as pieces) using the pattern I explained earlier—now called item1 and item2. Having defined these two CTEs, I can join them together on the t column, which is the time of day.
Try running this query in Datasette Lite.
Here’s the output of that query for Saturday (10am to 8pm):
| t | mins_in_traffic | mins_in_traffic_other_way |
|---|---|---|
| 10:09:06 | 18 | 8 |
| 10:17:38 | 16 | 8 |
| 10:30:06 | 23 | 9 |
| 10:47:38 | 23 | 9 |
| 10:57:37 | 23 | 9 |
| 11:08:20 | 26 | 9 |
| 11:22:27 | 26 | 9 |
| 11:38:42 | 26 | 9 |
| 11:52:35 | 25 | 9 |
| 12:03:23 | 24 | 9 |
| 12:15:16 | 21 | 9 |
| 12:27:51 | 22 | 9 |
| 12:37:48 | 22 | 10 |
| 12:46:41 | 21 | 10 |
| 12:55:03 | 21 | 10 |
| 13:05:10 | 21 | 11 |
| 13:17:57 | 21 | 11 |
| 13:32:55 | 21 | 11 |
| 13:44:53 | 19 | 12 |
| 13:55:22 | 21 | 14 |
| 14:05:21 | 22 | 14 |
| 14:17:48 | 23 | 15 |
| 14:31:04 | 22 | 15 |
| 14:41:59 | 21 | 14 |
| 14:51:48 | 18 | 14 |
| 15:00:09 | 18 | 15 |
| 15:11:17 | 15 | 14 |
| 15:25:48 | 14 | 15 |
| 15:39:41 | 11 | 14 |
| 15:51:11 | 14 | 15 |
| 15:59:34 | 15 | 15 |
| 16:10:50 | 19 | 16 |
| 16:25:43 | 19 | 18 |
| 16:53:06 | 19 | 18 |
| 17:11:34 | 18 | 16 |
| 17:40:29 | 11 | 11 |
| 18:12:07 | 10 | 11 |
| 18:58:17 | 8 | 9 |
| 20:05:13 | 7 | 7 |
I copied and pasted this table into Google Sheets and messed around with the charting tools there until I had the following chart:
Here’s the same chart for Sunday:
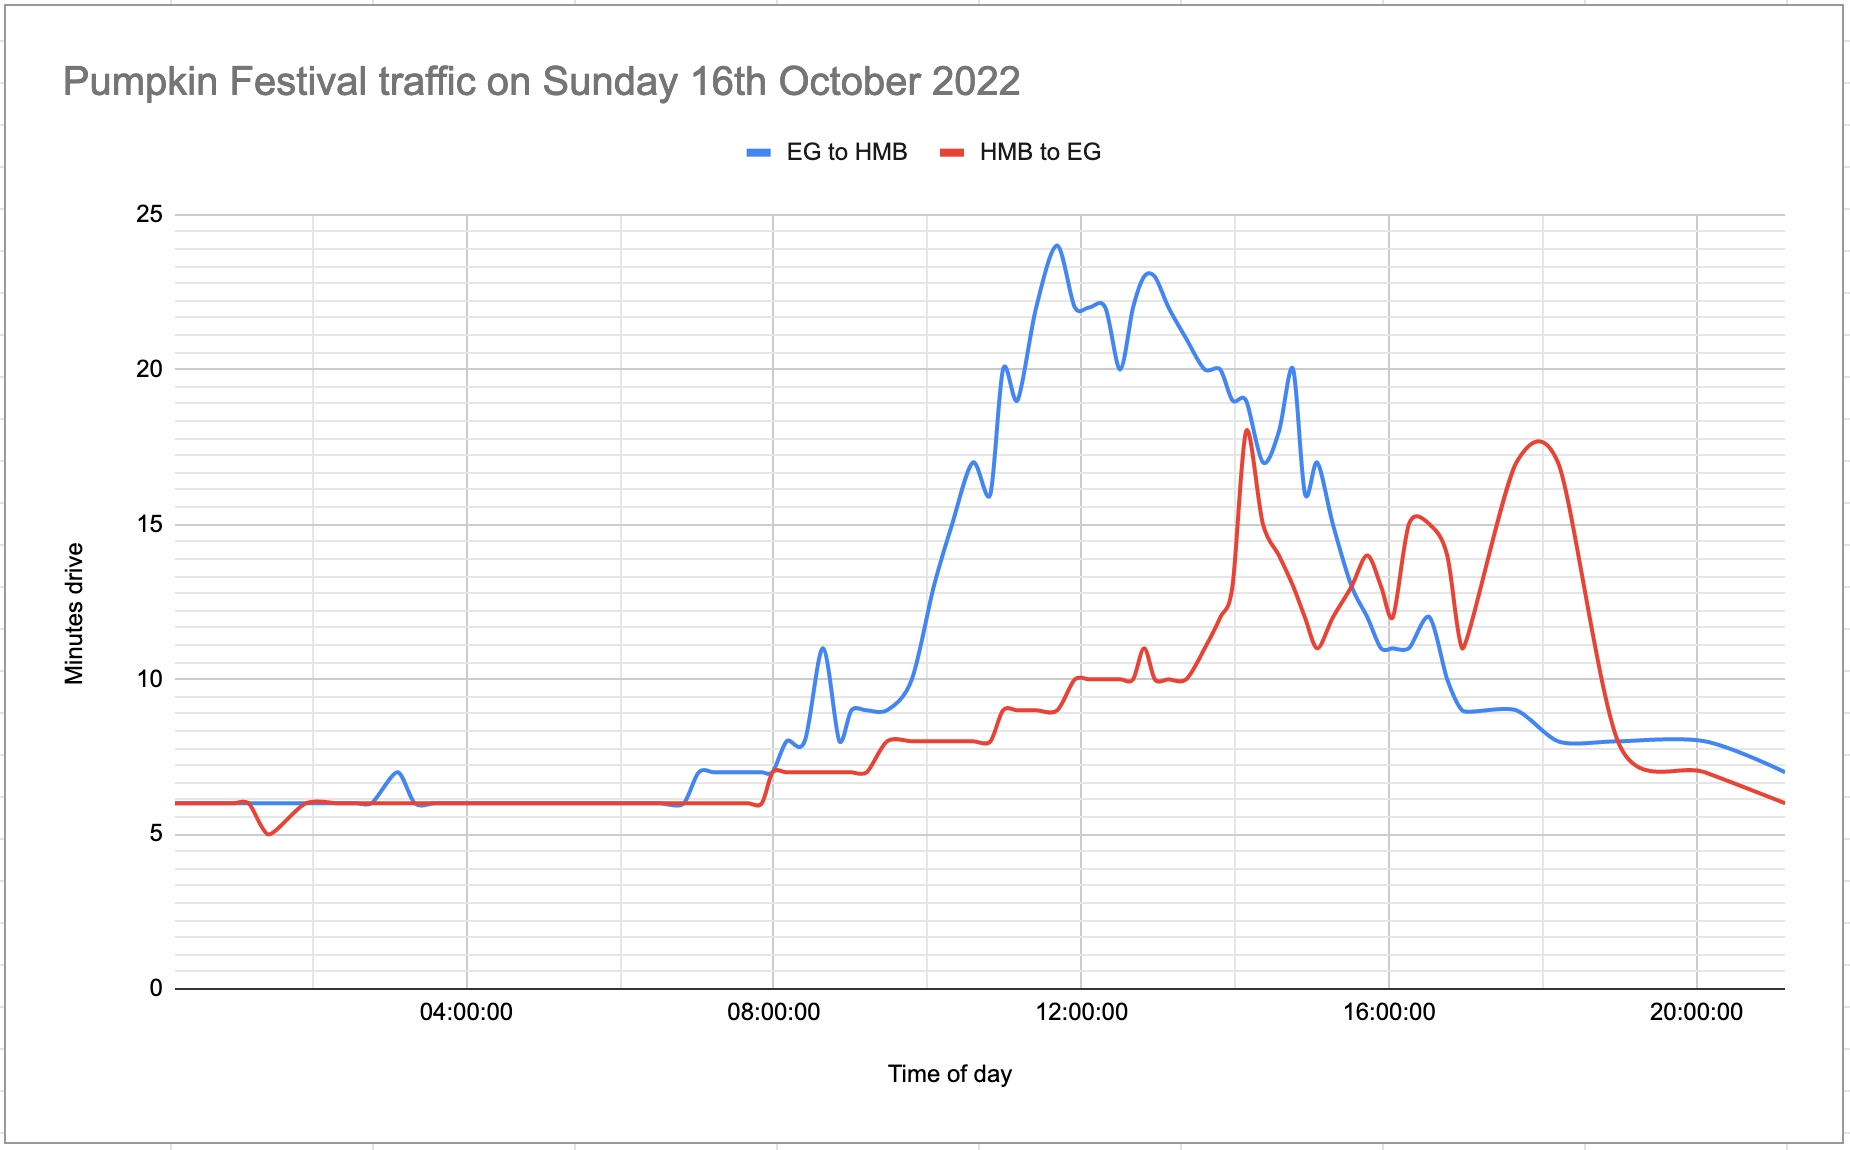
Our Google Sheet is here—the two days have two separate tabs within the sheet.
Building the SQLite database in GitHub Actions
I did most of the development work for this project on my laptop, running git-history and datasette locally for speed of iteration.
Once I had everything working, I decided to automate the process of building the SQLite database as well.
I made the following changes to my GitHub Actions workflow:
jobs:
  shot-scraper:
    runs-on: ubuntu-latest
    steps:
    - uses: actions/checkout@v3
      with:
        fetch-depth: 0 # Needed by git-history
    - name: Set up Python 3.10
      uses: actions/setup-python@v4
      with:
        python-version: "3.10"
        cache: "pip"
    - run: pip install -r requirements.txt
    - name: Scrape
      # Same as before...
      # env:
      # run
    - name: Build SQLite database
      run: |
        rm -f hmb.db # Recreate from scratch each time
        git-history file hmb.db one.json \
        --convert '
        try:
            duration_in_traffic = json.loads(content)["routes"][0]["legs"][0]["duration_in_traffic"]["value"]
            return [{"id": "one", "duration_in_traffic": duration_in_traffic}]
        except Exception as ex:
            return []
        ' \
          --full-versions \
          --id id
        git-history file hmb.db two.json \
        --convert '
        try:
            duration_in_traffic = json.loads(content)["routes"][0]["legs"][0]["duration_in_traffic"]["value"]
            return [{"id": "two", "duration_in_traffic": duration_in_traffic}]
        except Exception as ex:
            return []
        ' \
          --full-versions \
          --id id --namespace item2
    - name: Commit and push
      # Same as before...
I also added a requirements.txt file containing just git-history.
Note how the actions/checkout@v3 step now has fetch-depth: 0—this is necessary because git-history needs to loop through the entire repository history, but actions/checkout@v3 defaults to only fetching the most recent commit.
The setup-python step uses cache: "pip", which causes it to cache installed dependencies from requirements.txt between runs.
Because that big git-history step creates a hmb.db SQLite database, the “Commit and push” step now includes that file in the push to the repository. So every time the workflow runs a new binary SQLite database file is committed.
Normally I wouldn’t do this, because Git isn’t a great place to keep constantly changing binary files... but in this case the SQLite database is only 100KB and won’t continue to be updated beyond the end of the pumpkin festival.
End result: hmb.db is available in the GitHub repository.
Querying it using Datasette Lite
Datasette Lite is my repackaged version of my Datasette server-side Python application which runs entirely in the user’s browser, using WebAssembly.
A neat feature of Datasette Lite is that you can pass it the URL to a SQLite database file and it will load that database in your browser and let you run queries against it.
These database files need to be served with CORS headers. Every file served by GitHub includes these headers!
Which means the following URL can be used to open up the latest hmb.db file directly in Datasette in the browser:
https://lite.datasette.io/?url=https://github.com/simonw/scrape-hmb-traffic/blob/main/hmb.db
(This takes advantage of a feature I added to Datasette Lite where it knows how to convert the URL to the HTML page about a file on GitHub to the URL to the raw file itself.)
URLs to SQL queries work too. This URL will open Datasette Lite, load the SQLite database AND execute the query I constructed above:
And finally... Datasette Lite has plugin support. Adding &install=datasette-copyable to the URL adds the datasette-copyable plugin, which adds a page for easily copying out the query results as TSV (useful for pasting into a spreadsheet) or even as GitHub-flavored Markdown (which I used to add results to this blog post).
Here’s an example of that plugin in action.
This was a fun little project that brought together a whole bunch of things I’ve been working on over the past few years. Here’s some more of my writing on these different techniques and tools:
- Git scraping is the key technique I’m using here to collect the data
- I’ve written a lot about GitHub Actions
- These are my notes about git-history, the tool I used to turn a commit history into a SQLite database
- Here’s my series of posts about Datasette Lite
More recent articles
- Weeknotes: Llama 3, AI for Data Journalism, llm-evals and datasette-secrets - 23rd April 2024
- Options for accessing Llama 3 from the terminal using LLM - 22nd April 2024
- AI for Data Journalism: demonstrating what we can do with this stuff right now - 17th April 2024
- Three major LLM releases in 24 hours (plus weeknotes) - 10th April 2024
- Building files-to-prompt entirely using Claude 3 Opus - 8th April 2024
- Running OCR against PDFs and images directly in your browser - 30th March 2024
- llm cmd undo last git commit - a new plugin for LLM - 26th March 2024
- Building and testing C extensions for SQLite with ChatGPT Code Interpreter - 23rd March 2024
- Claude and ChatGPT for ad-hoc sidequests - 22nd March 2024
- Weeknotes: the aftermath of NICAR - 16th March 2024