19th February 2026 - Link Blog
SWE-bench February 2026 leaderboard update (via) SWE-bench is one of the benchmarks that the labs love to list in their model releases. The official leaderboard is infrequently updated but they just did a full run of it against the current generation of models, which is notable because it's always good to see benchmark results like this that weren't self-reported by the labs.
The fresh results are for their "Bash Only" benchmark, which runs their mini-swe-bench agent (~9,000 lines of Python, here are the prompts they use) against the SWE-bench dataset of coding problems - 2,294 real-world examples pulled from 12 open source repos: django/django (850), sympy/sympy (386), scikit-learn/scikit-learn (229), sphinx-doc/sphinx (187), matplotlib/matplotlib (184), pytest-dev/pytest (119), pydata/xarray (110), astropy/astropy (95), pylint-dev/pylint (57), psf/requests (44), mwaskom/seaborn (22), pallets/flask (11).
Correction: The Bash only benchmark runs against SWE-bench Verified, not original SWE-bench. Verified is a manually curated subset of 500 samples described here, funded by OpenAI. Here's SWE-bench Verified on Hugging Face - since it's just 2.1MB of Parquet it's easy to browse using Datasette Lite, which cuts those numbers down to django/django (231), sympy/sympy (75), sphinx-doc/sphinx (44), matplotlib/matplotlib (34), scikit-learn/scikit-learn (32), astropy/astropy (22), pydata/xarray (22), pytest-dev/pytest (19), pylint-dev/pylint (10), psf/requests (8), mwaskom/seaborn (2), pallets/flask (1).
Here's how the top ten models performed:
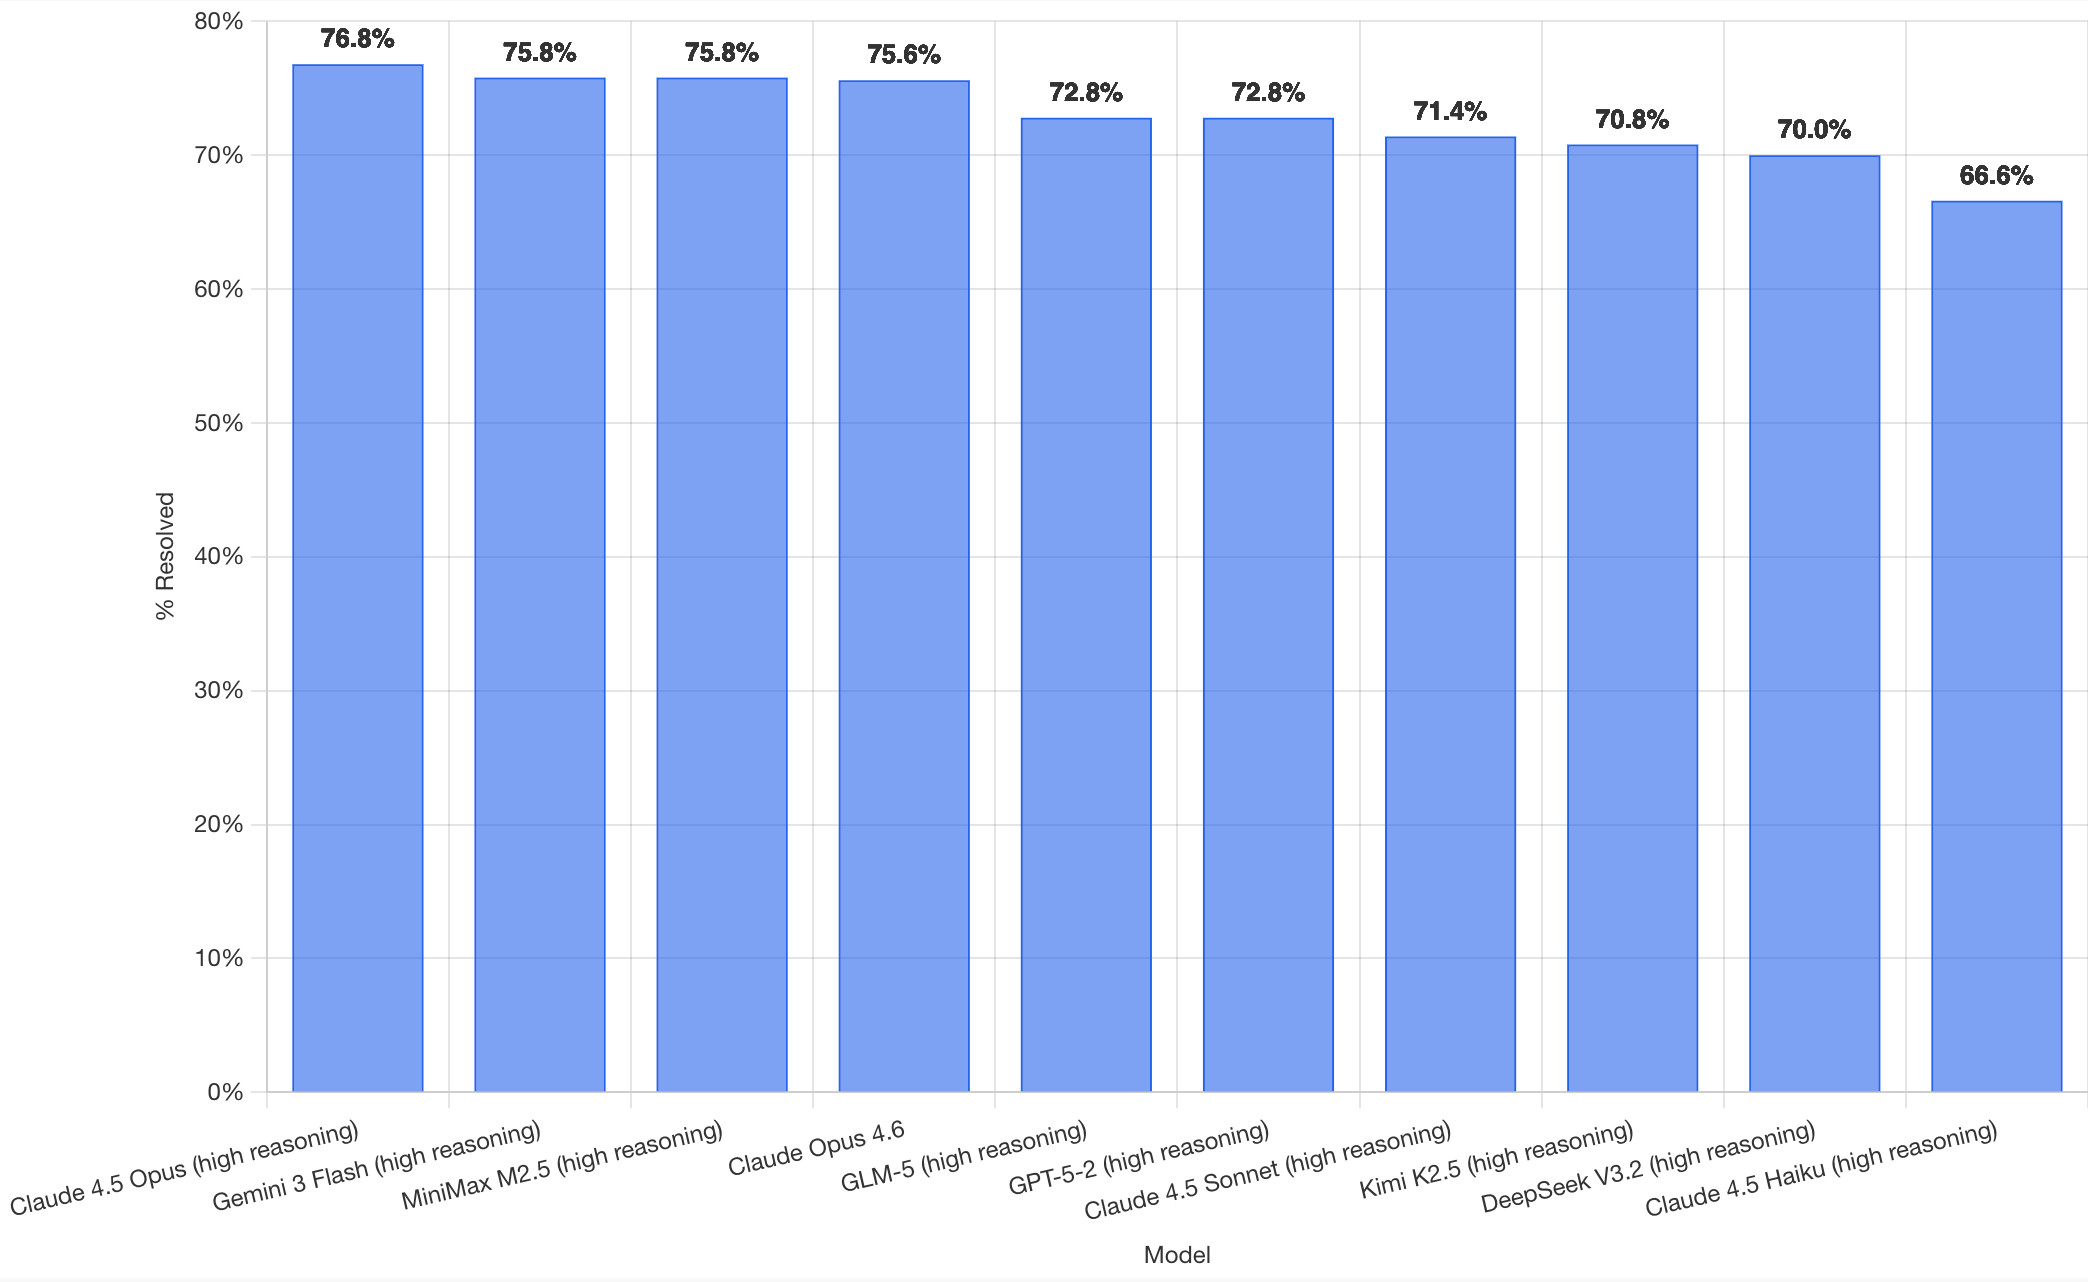
It's interesting to see Claude Opus 4.5 beat Opus 4.6, though only by about a percentage point. 4.5 Opus is top, then Gemini 3 Flash, then MiniMax M2.5 - a 229B model released last week by Chinese lab MiniMax. GLM-5, Kimi K2.5 and DeepSeek V3.2 are three more Chinese models that make the top ten as well.
OpenAI's GPT-5.2 is their highest performing model at position 6, but it's worth noting that their best coding model, GPT-5.3-Codex, is not represented - maybe because it's not yet available in the OpenAI API.
This benchmark uses the same system prompt for every model, which is important for a fair comparison but does mean that the quality of the different harnesses or optimized prompts is not being measured here.
The chart above is a screenshot from the SWE-bench website, but their charts don't include the actual percentage values visible on the bars. I successfully used Claude for Chrome to add these - transcript here. My prompt sequence included:
Use claude in chrome to open https://www.swebench.com/
Click on "Compare results" and then select "Select top 10"
See those bar charts? I want them to display the percentage on each bar so I can take a better screenshot, modify the page like that
I'm impressed at how well this worked - Claude injected custom JavaScript into the page to draw additional labels on top of the existing chart.
![Screenshot of a Claude AI conversation showing browser automation. A thinking step reads "Pivoted strategy to avoid recursion issues with chart labeling >" followed by the message "Good, the chart is back. Now let me carefully add the labels using an inline plugin on the chart instance to avoid the recursion issue." A collapsed "Browser_evaluate" section shows a browser_evaluate tool call with JavaScript code using Chart.js canvas context to draw percentage labels on bars: meta.data.forEach((bar, index) => { const value = dataset.data[index]; if (value !== undefined && value !== null) { ctx.save(); ctx.textAlign = 'center'; ctx.textBaseline = 'bottom'; ctx.fillStyle = '#333'; ctx.font = 'bold 12px sans-serif'; ctx.fillText(value.toFixed(1) + '%', bar.x, bar.y - 5); A pending step reads "Let me take a screenshot to see if it worked." followed by a completed "Done" step, and the message "Let me take a screenshot to check the result."](https://static.simonwillison.net/static/2026/claude-chrome-draw-on-chart.jpg)
Update: If you look at the transcript Claude claims to have switched to Playwright, which is confusing because I didn't think I had that configured.
Recent articles
- Mr. Chatterbox is a (weak) Victorian-era ethically trained model you can run on your own computer - 30th March 2026
- Vibe coding SwiftUI apps is a lot of fun - 27th March 2026
- Experimenting with Starlette 1.0 with Claude skills - 22nd March 2026