Nano Banana Pro aka gemini-3-pro-image-preview is the best available image generation model
20th November 2025
Hot on the heels of Tuesday’s Gemini 3 Pro release, today it’s Nano Banana Pro, also known as Gemini 3 Pro Image. I’ve had a few days of preview access and this is an astonishingly capable image generation model.
As is often the case, the most useful low-level details can be found in the API documentation:
Designed to tackle the most challenging workflows through advanced reasoning, it excels at complex, multi-turn creation and modification tasks.
- High-resolution output: Built-in generation capabilities for 1K, 2K, and 4K visuals.
- Advanced text rendering: Capable of generating legible, stylized text for infographics, menus, diagrams, and marketing assets.
- Grounding with Google Search: The model can use Google Search as a tool to verify facts and generate imagery based on real-time data (e.g., current weather maps, stock charts, recent events).
- Thinking mode: The model utilizes a “thinking” process to reason through complex prompts. It generates interim “thought images” (visible in the backend but not charged) to refine the composition before producing the final high-quality output.
- Up to 14 reference images: You can now mix up to 14 reference images to produce the final image.
[...] These 14 images can include the following:
- Up to 6 images of objects with high-fidelity to include in the final image
- Up to 5 images of humans to maintain character consistency
There is also a short (6 page) model card PDF which lists the following as “new capabilities” compared to the previous Nano Banana: Multi character editing, Chart editing, Text editing, Factuality—Edu, Multi-input 1-3, Infographics, Doodle editing, Visual design.
Trying out some detailed instruction image prompts
Max Woolf published the definitive guide to prompting Nano Banana just a few days ago. I decided to try his example prompts against the new model, requesting results in 4K.
Here’s what I got for his first test prompt, using Google’s AI Studio:
Create an image of a three-dimensional pancake in the shape of a skull, garnished on top with blueberries and maple syrup.
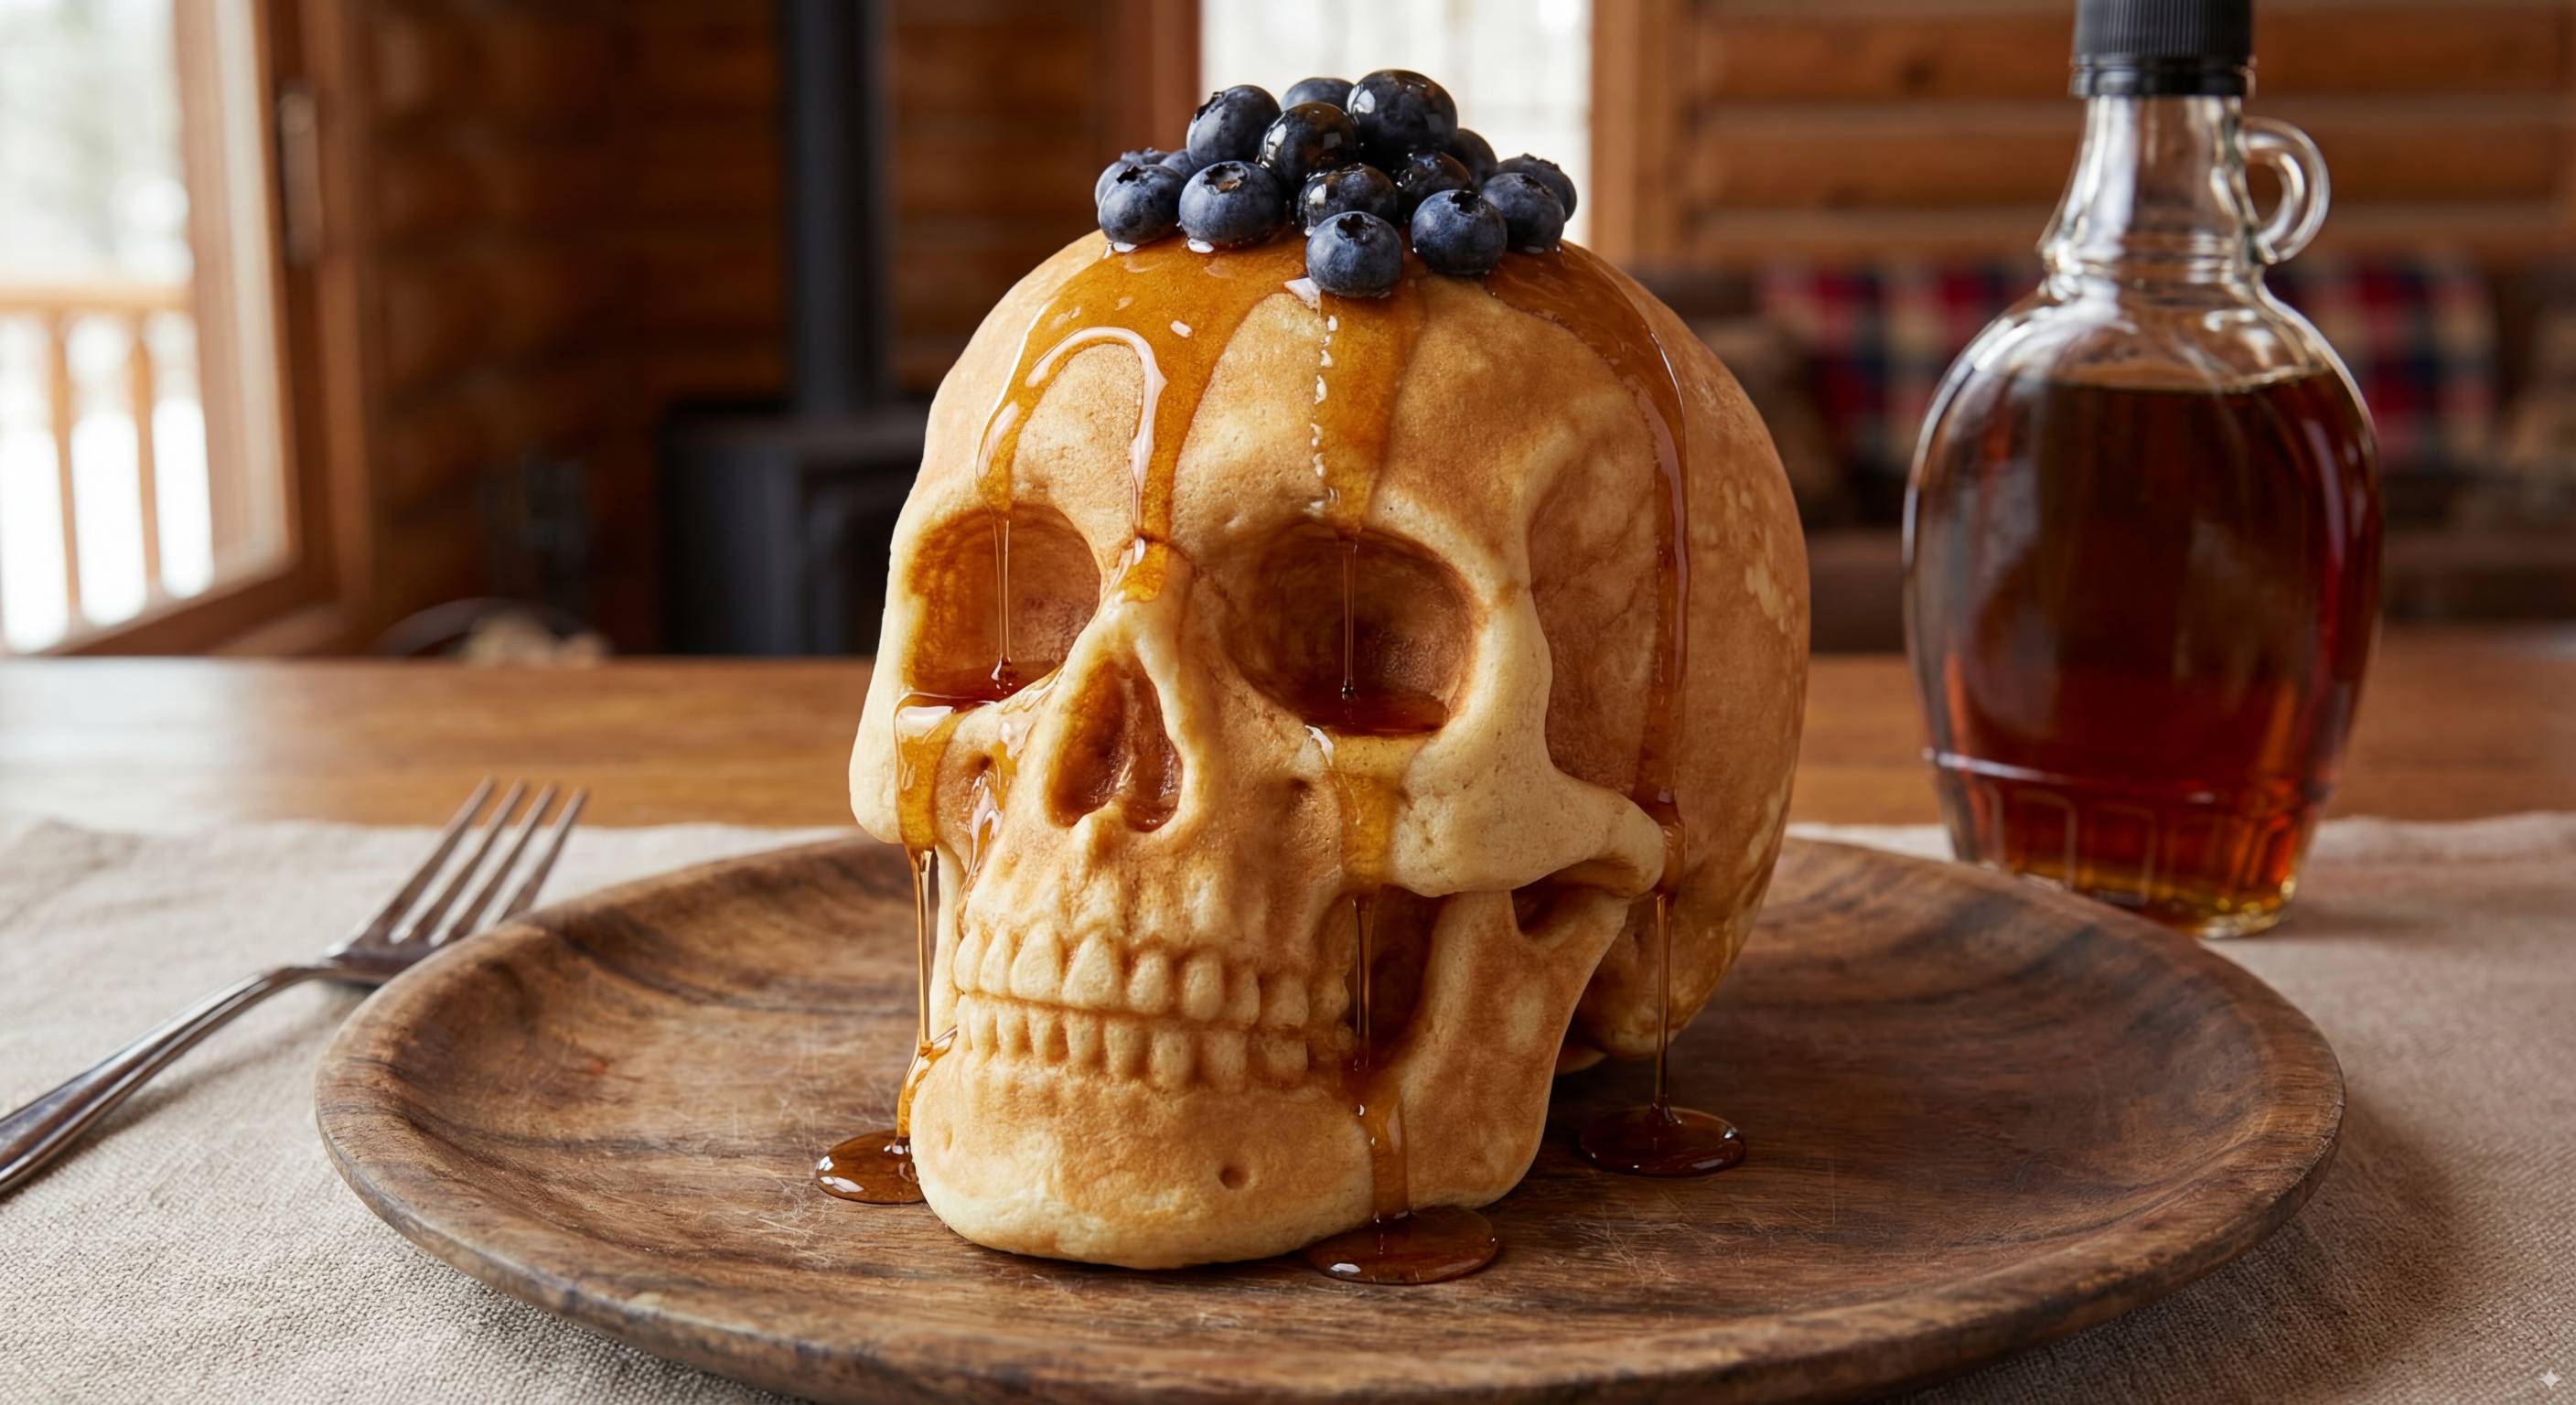
The result came out as a 24.1MB, 5632 × 3072 pixel PNG file. I don’t want to serve that on my own blog so here’s a Google Drive link for the original.
Then I ran his follow-up prompt:
Make ALL of the following edits to the image:
- Put a strawberry in the left eye socket.
- Put a blackberry in the right eye socket.
- Put a mint garnish on top of the pancake.
- Change the plate to a plate-shaped chocolate-chip cookie.
- Add happy people to the background.

I’ll note that it did put the plate-sized cookie on a regular plate. Here’s the 24.9MB PNG.
The new model isn’t cheap. Here’s the API pricing: it’s 24 cents for a 4K image and 13.4 cents for a 1K or 2K image. Image inputs are 0.11 cents (just over 1/10th of a cent) each—an earlier version of their pricing page incorrectly said 6.7 cents each but that’s now been fixed.
Unlike most of Google’s other models it also isn’t available for free via AI Studio: you have to configure an API key with billing in order to use the model there.
Creating an infographic
So this thing is great at following instructions. How about rendering text?
I tried this prompt, this time using the Gemini consumer app in “thinking” mode (which now uses Nano Banana Pro for image generation). Here’s a share link—my prompt was:
Infographic explaining how the Datasette open source project works
This is a great opportunity to test its ability to run searches (aka “Grounding with Google Search”). Here’s what it created based on that 9 word prompt:
![Described by Gemini 3 Pro: A technical architecture diagram titled "How Datasette Works: From Raw Data to Explorable API," illustrating a workflow from left to right. 1. "RAW DATA SOURCES" include "CSV", "JSON", "Excel (XLSX)", and "Log Files". 2. These flow into "DATA PREPARATION & CONVERSION" using tools "csvs-to-sqlite" and "sqlite-utils" to create a "SQLite DATABASE". 3. This feeds into the central "DATASETTE APPLICATION CORE," a stack comprising "Data Ingestion (Read-Only)", "Query Engine (SQL)", "API Layer (JSON)", and "Web UI Rendering". 4. A "PLUGIN ECOSYSTEM" connects below the core, listing "Vega Charts", "Cluster Maps", "Full-Text Search", and "Custom Renderers". 5. To the right, the core branches into "OUTPUT & INTERFACES": an "Interactive Web Interface (Explore, Filter, Facet)", a "JSON API (Programmatic Access)" showing a snippet {"data": [...]}, and a "SQL EDITOR Custom SQL Queries" showing SELECT * FROM.... 6. The API output connects to "PUBLISHING & DEPLOYMENT" via a terminal command datasette publish cloudrun my.db leading to deployment targets "Heroku", "Google Cloud Run", "Fly.io", and "Vercel".](https://static.simonwillison.net/static/2025/nano-banana-datasette.jpg)
That’s a pretty extraordinary result for such a simple prompt. The text is all spelled correctly and rendered without glitches. The content is solid too—it even included logos for the most popular publish platforms, and a tiny thumbnail of the Datasette UI which is close-enough for an infographic.
“Data Ingestion (Read-Only)” is a bit off. Everything else looks great to me.
Here’s the thinking trace for that image generation process:
Initiating Datasette Infographic
I’m starting a detailed infographic about the Datasette project. I plan to use Google Search to gather specific information about its core processes, which I will then visualize in a multi-panel diagram.
Developing the Datasette workflow
I am visualizing the Datasette workflow as described in the search results. I’m focusing on the conversion of data from different formats into a SQLite database, which is then presented as a web application complete with a user interface and JSON output.
Visualizing Datasette Workflow
I’ve sketched out the initial structure for the infographic, focusing on a flowchart style. The key components include data input from diverse sources, conversion to SQLite, the Datasette core application, its main features (web UI, JSON API, SQL querying), ecosystem plugins, and finally, deployment options. I aim for clear icons and labels to represent each step. Now I will focus on refining the flow and clarifying the relationships between the parts.
Defining Core Datasette Stages
I’ve sketched out the initial infographic structure. I have identified the key components, focusing on visual representation of the data flow and the key benefits and features of the system. I have made updates to the flowchart with clear icons and labels. Now I’m working to expand the data input section and refine the visual representation of each step.
Constructing Datasette Infographic
I am translating the current Datasette workflow outline into visual elements. The input section will show icons for different data formats. I’ve sketched the data conversion stage with clear illustrations of the necessary tools. I will add a depiction of the Datasette core application, showcasing its interfaces and functions. The plugin ecosystem and deployment options will follow. Now, I am refining the visual representation.
Analyzing Datasette’s Architecture
I’m currently working on representing the Datasette open-source project’s architecture visually. I’ve broken it down into key components: raw data processing, SQLite conversion, core application functionalities, plugin integration, and deployment methods. I’m focusing on creating a clear, linear representation to show the workflow.
Mapping the Datasette Flow
I’ve crafted a comprehensive graphic to illustrate Datasette’s operation. It spans the data ingestion, SQLite conversion, main application features, plugin interactions, and deployment stages, aiming for clarity and a logical flow.
Detecting generated images with SynthID
This note from the announcement post caught my eye:
We believe it’s critical to know when an image is AI-generated. This is why all media generated by Google’s tools are embedded with our imperceptible SynthID digital watermark.
Today, we are putting a powerful verification tool directly in consumers’ hands: you can now upload an image into the Gemini app and simply ask if it was generated by Google AI, thanks to SynthID technology. We are starting with images, but will expand to audio and video soon.
Last night I used Nano Banana Pro to generate a fake photograph of raccoons stealing our food delivery, then scrubbed out the little diamond icon using the Apple Photos “cleanup” tool. I uploaded that to the Gemini app and asked “Was this image created with AI?”:
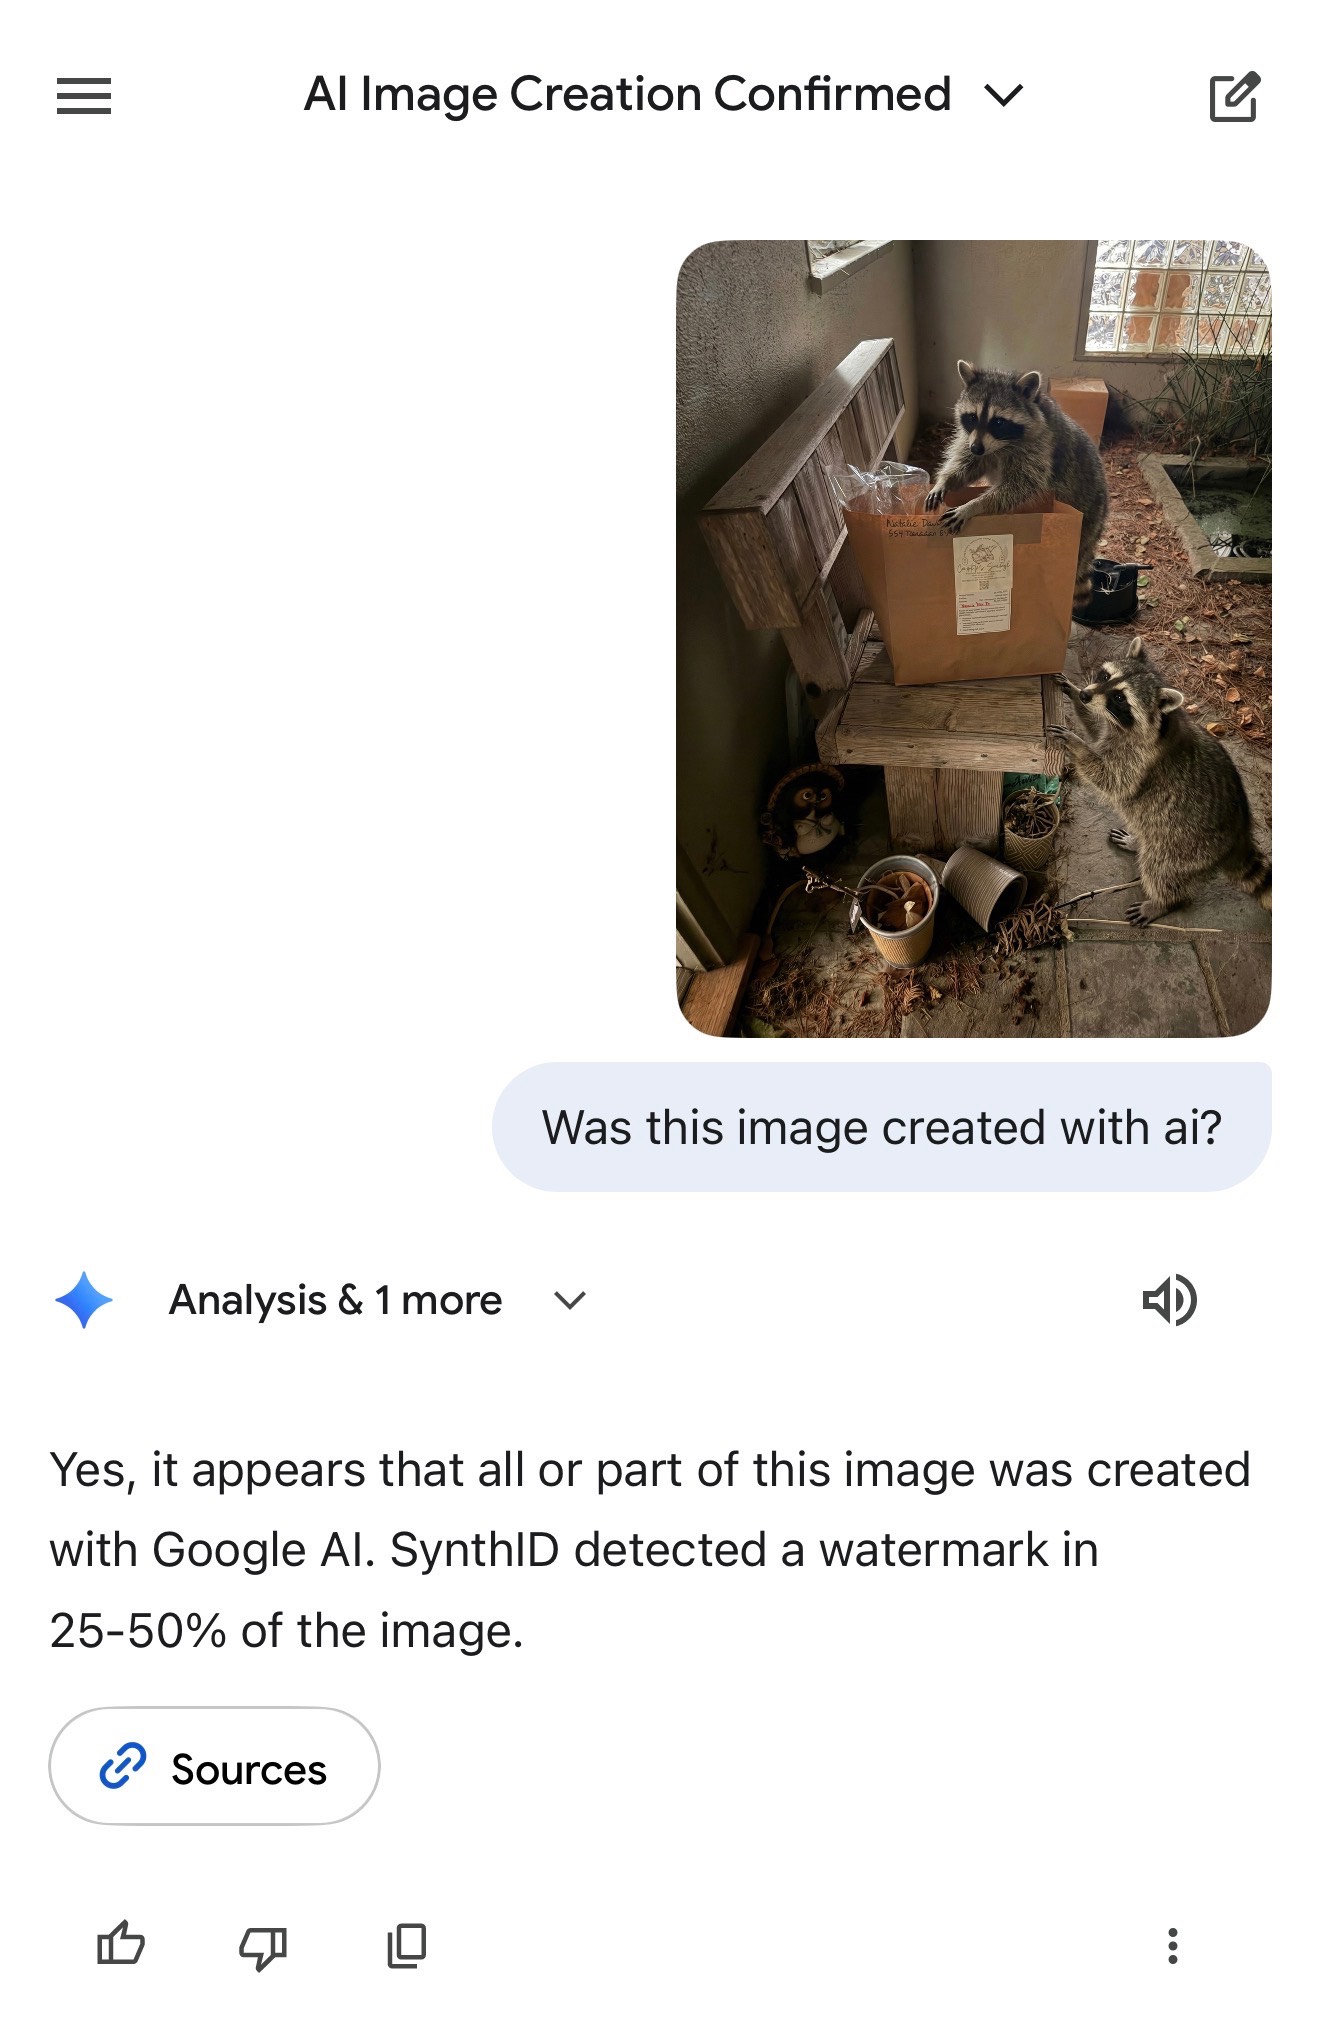
It replied:
Yes, it appears that all or part of this image was created with Google Al. SynthID detected a watermark in 25-50% of the image.
Presumably that 25-50% figure is because the rest of the photo was taken by me—it was just the raccoons that were added by Nano Banana Pro.
More recent articles
- Meta's new model is Muse Spark, and meta.ai chat has some interesting tools - 8th April 2026
- Anthropic's Project Glasswing - restricting Claude Mythos to security researchers - sounds necessary to me - 7th April 2026
- The Axios supply chain attack used individually targeted social engineering - 3rd April 2026