10th October 2024 - Link Blog
Announcing Deno 2. The big focus of Deno 2 is compatibility with the existing Node.js and npm ecosystem:
Deno 2 takes all of the features developers love about Deno 1.x — zero-config, all-in-one toolchain for JavaScript and TypeScript development, web standard API support, secure by default — and makes it fully backwards compatible with Node and npm (in ESM).
The npm support is documented here. You can write a script like this:
import * as emoji from "npm:node-emoji";
console.log(emoji.emojify(`:sauropod: :heart:  npm`));
And when you run it Deno will automatically fetch and cache the required dependencies:
deno run main.js
Another new feature that caught my eye was this:
deno jupyternow supports outputting images, graphs, and HTML
Deno has apparently shipped with a Jupyter notebook kernel for a while, and it's had a major upgrade in this release.
Here's Ryan Dahl's demo of the new notebook support in his Deno 2 release video.
I tried this out myself, and it's really neat. First you need to install the kernel:
deno juptyer --install
I was curious to find out what this actually did, so I dug around in the code and then further in the Rust runtimed dependency. It turns out installing Jupyter kernels, at least on macOS, involves creating a directory in ~/Library/Jupyter/kernels/deno and writing a kernel.json file containing the following:
{
  "argv": [
    "/opt/homebrew/bin/deno",
    "jupyter",
    "--kernel",
    "--conn",
    "{connection_file}"
  ],
  "display_name": "Deno",
  "language": "typescript"
}
That file is picked up by any Jupyter servers running on your machine, and tells them to run deno jupyter --kernel ... to start a kernel.
I started Jupyter like this:
jupyter-notebook /tmp
Then started a new notebook, selected the Deno kernel and it worked as advertised:
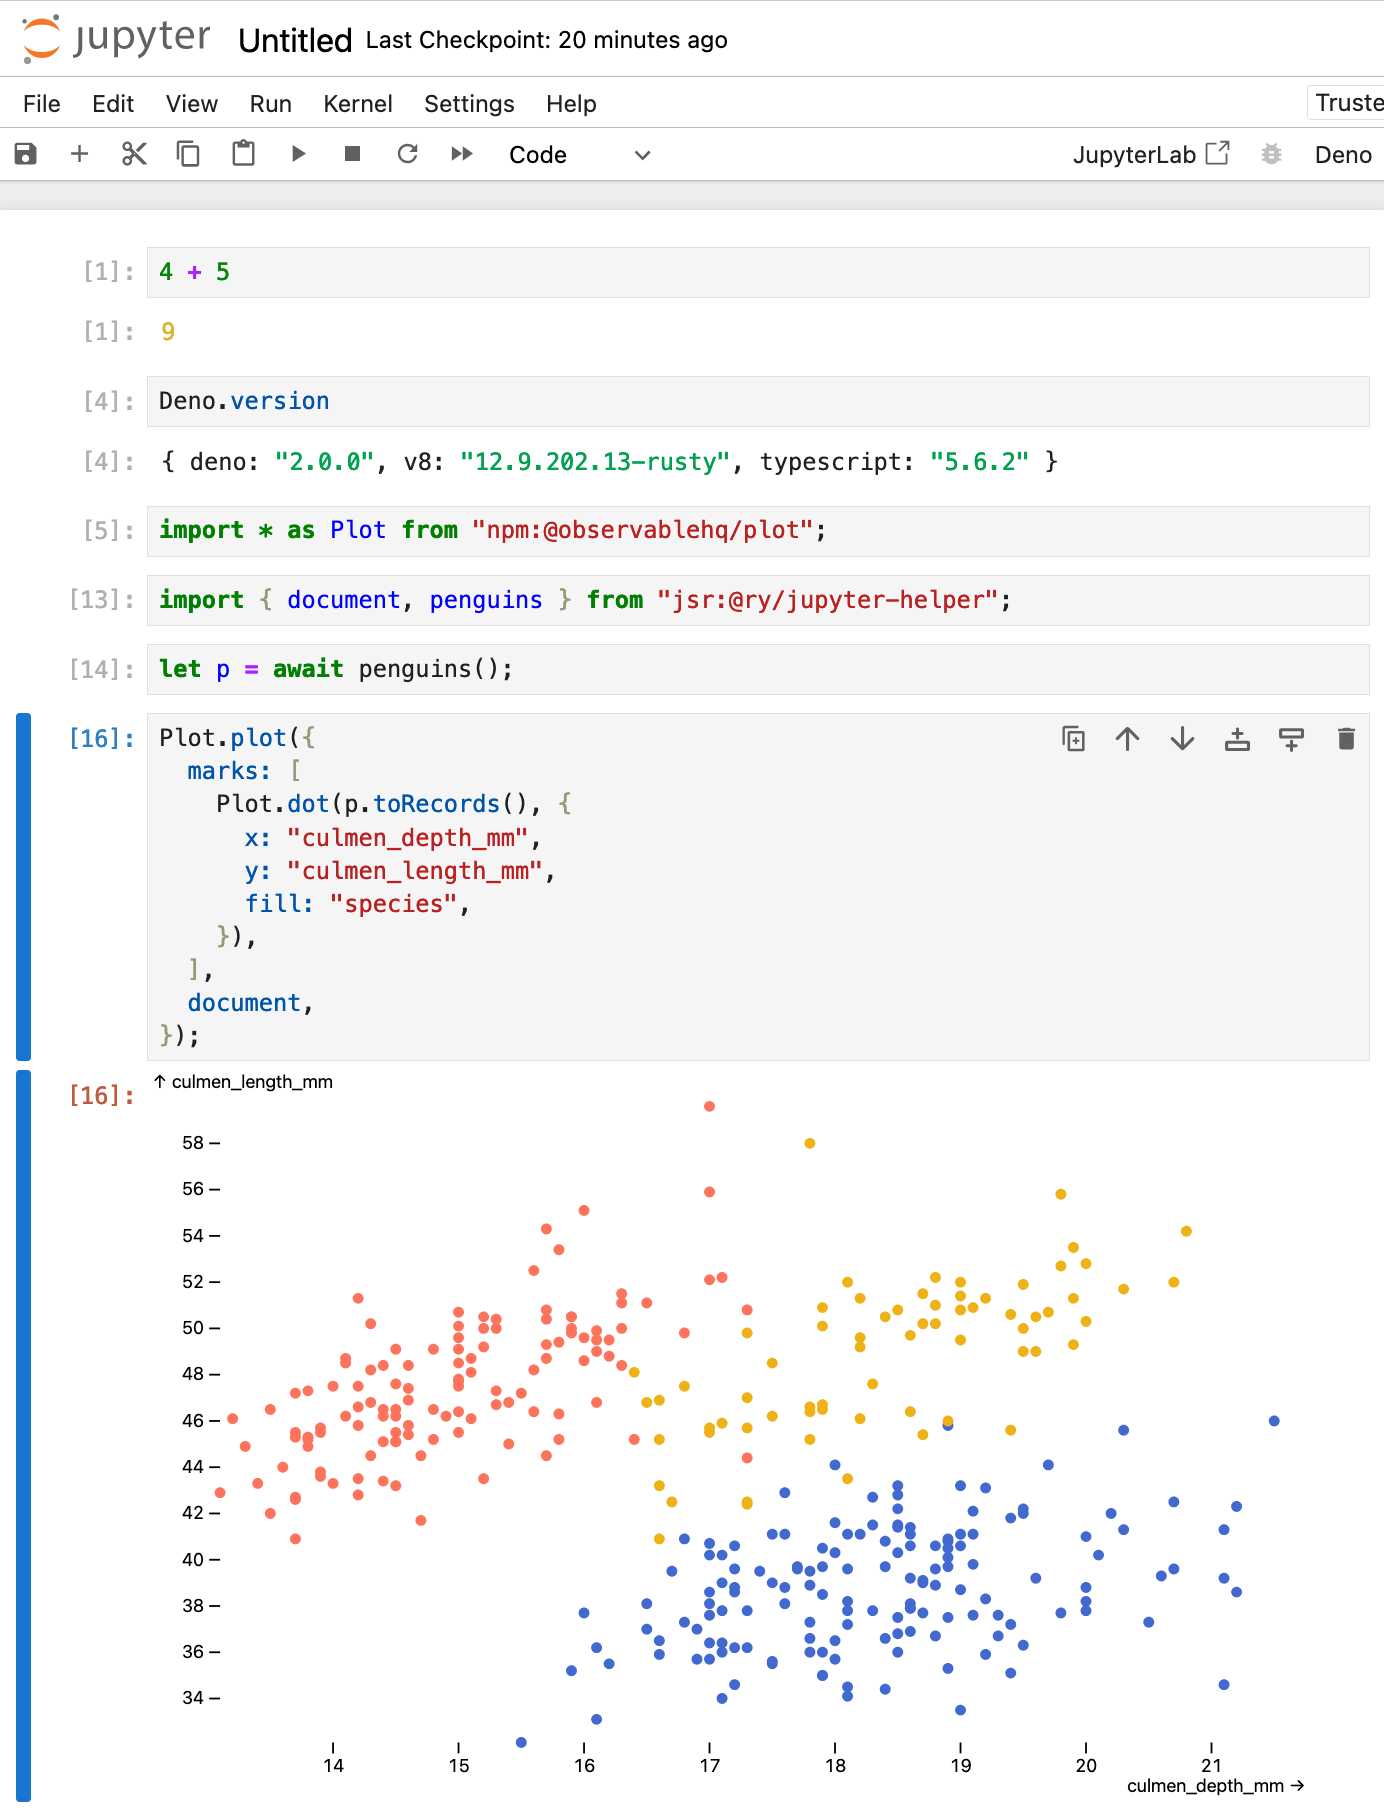
import * as Plot from "npm:@observablehq/plot";
import { document, penguins } from "jsr:@ry/jupyter-helper";
let p = await penguins();

Plot.plot({
  marks: [
    Plot.dot(p.toRecords(), {
      x: "culmen_depth_mm",
      y: "culmen_length_mm",
      fill: "species",
    }),
  ],
  document,
});Recent articles
- Mr. Chatterbox is a (weak) Victorian-era ethically trained model you can run on your own computer - 30th March 2026
- Vibe coding SwiftUI apps is a lot of fun - 27th March 2026
- Experimenting with Starlette 1.0 with Claude skills - 22nd March 2026