Personal Data Warehouses: Reclaiming Your Data
I gave a talk yesterday about personal data warehouses for GitHub’s OCTO Speaker Series, focusing on my Datasette and Dogsheep projects. The video of the talk is now available, and I’m presenting that here along with an annotated summary of the talk, including links to demos and further information.
There’s a short technical glitch with the screen sharing in the first couple of minutes of the talk—I’ve added screenshots to the notes which show what you would have seen if my screen had been correctly shared.

I’m going to be talking about personal data warehouses, what they are, why you want one, how to build them and some of the interesting things you can do once you’ve set one up.
I’m going to start with a demo.

This is my dog, Cleo—when she won first place in a dog costume competition here, dressed as the Golden Gate Bridge!
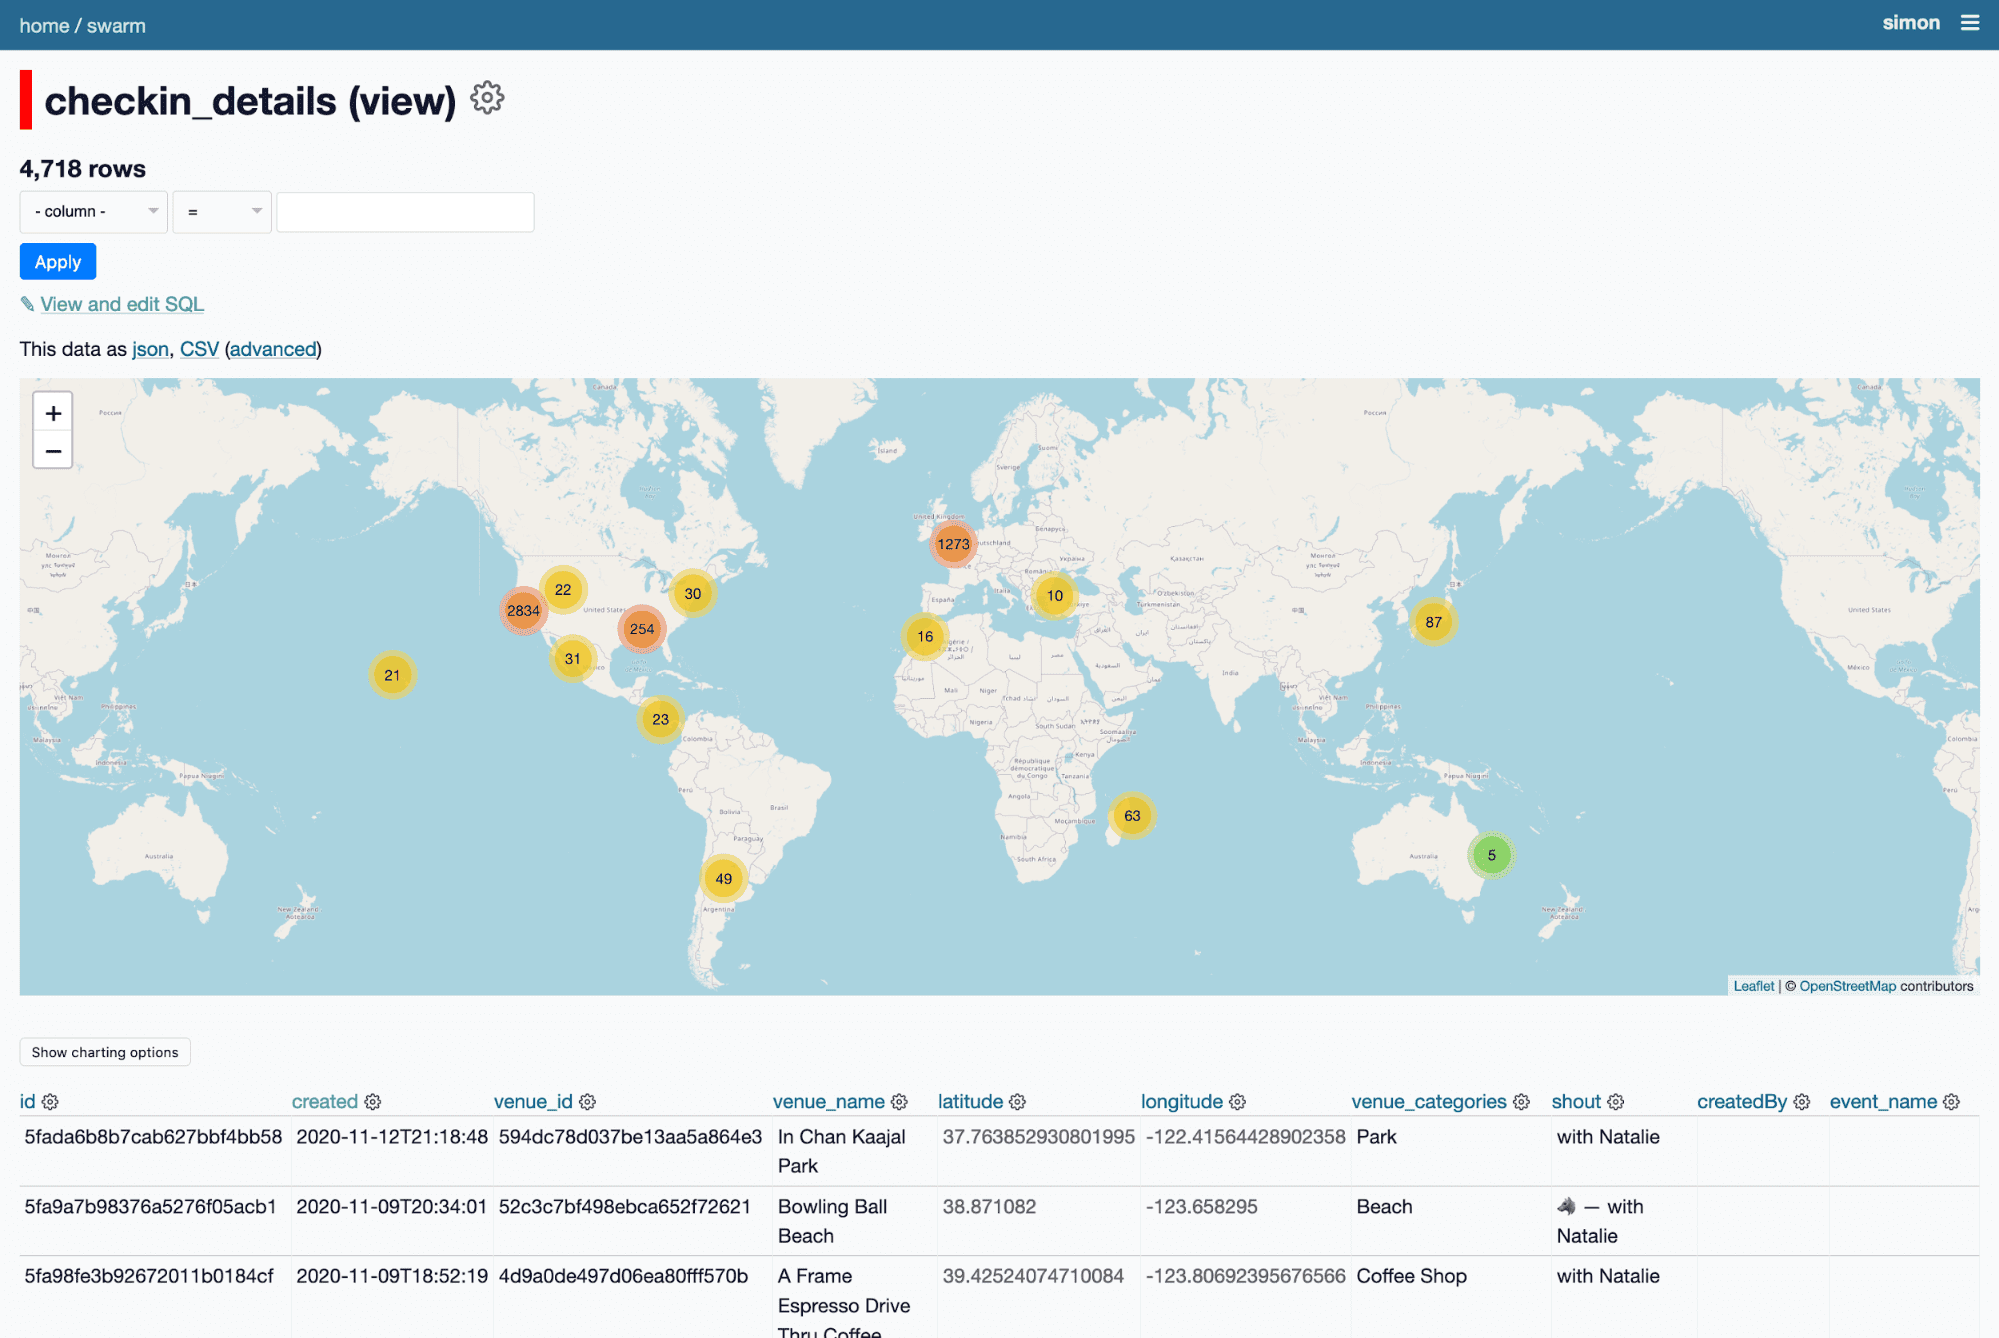
So the question I want to answer is: How much of a San Francisco hipster is Cleo?
I can answer it using my personal data warehouse.
I have a database of ten year’s worth of my checkins on Foursquare Swarm—generated using my swarm-to-sqlite tool. Every time I check in somewhere with Cleo I use the Wolf emoji in the checkin message.
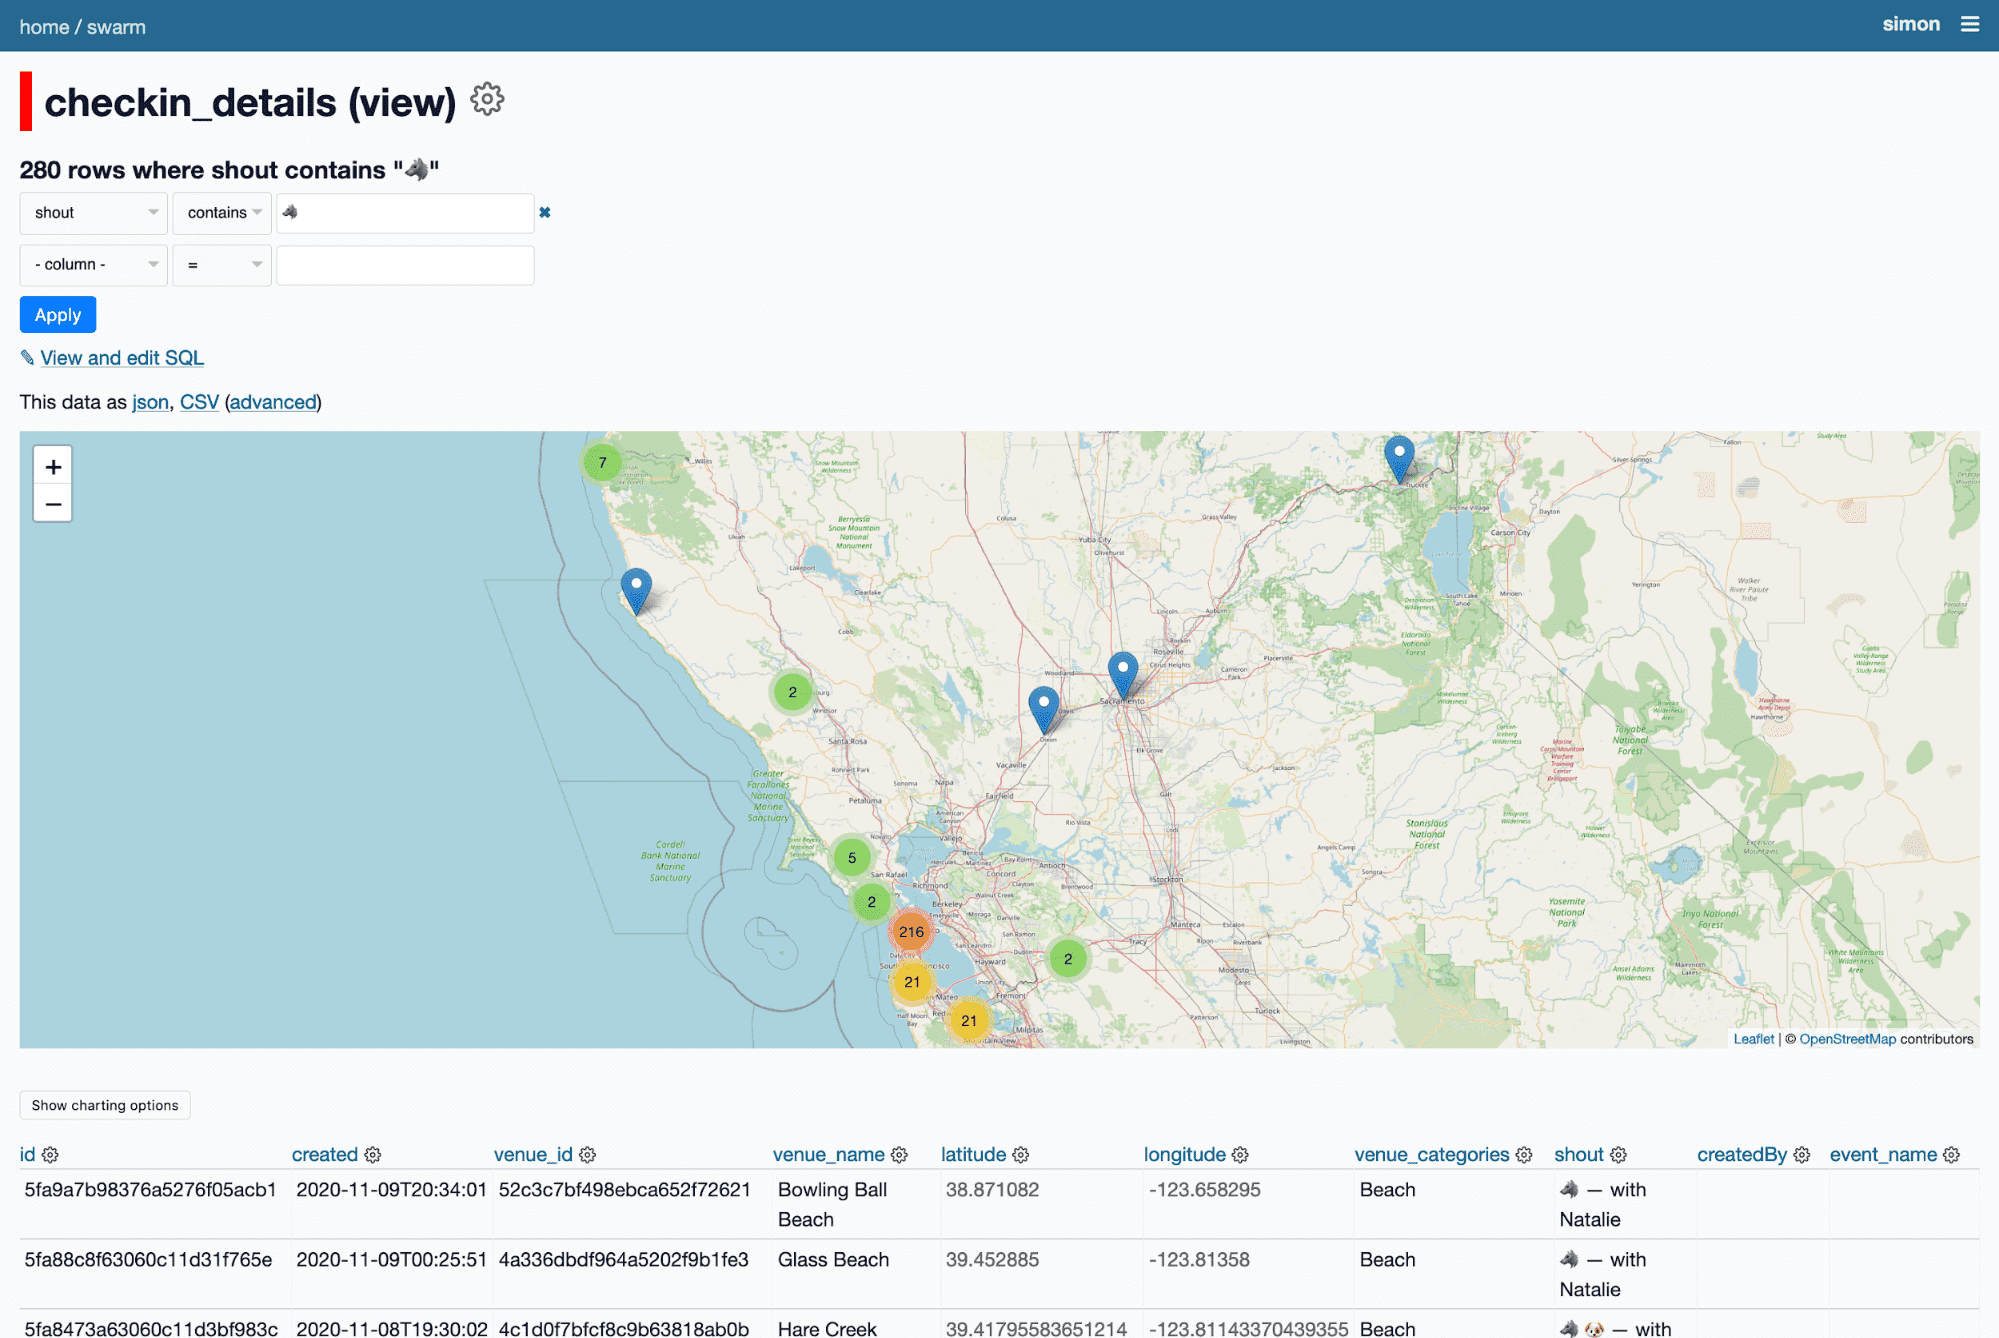
I can filter for just checkins where the checkin message includes the wolf emoji.
Which means I can see just her checkins—all 280 of them.
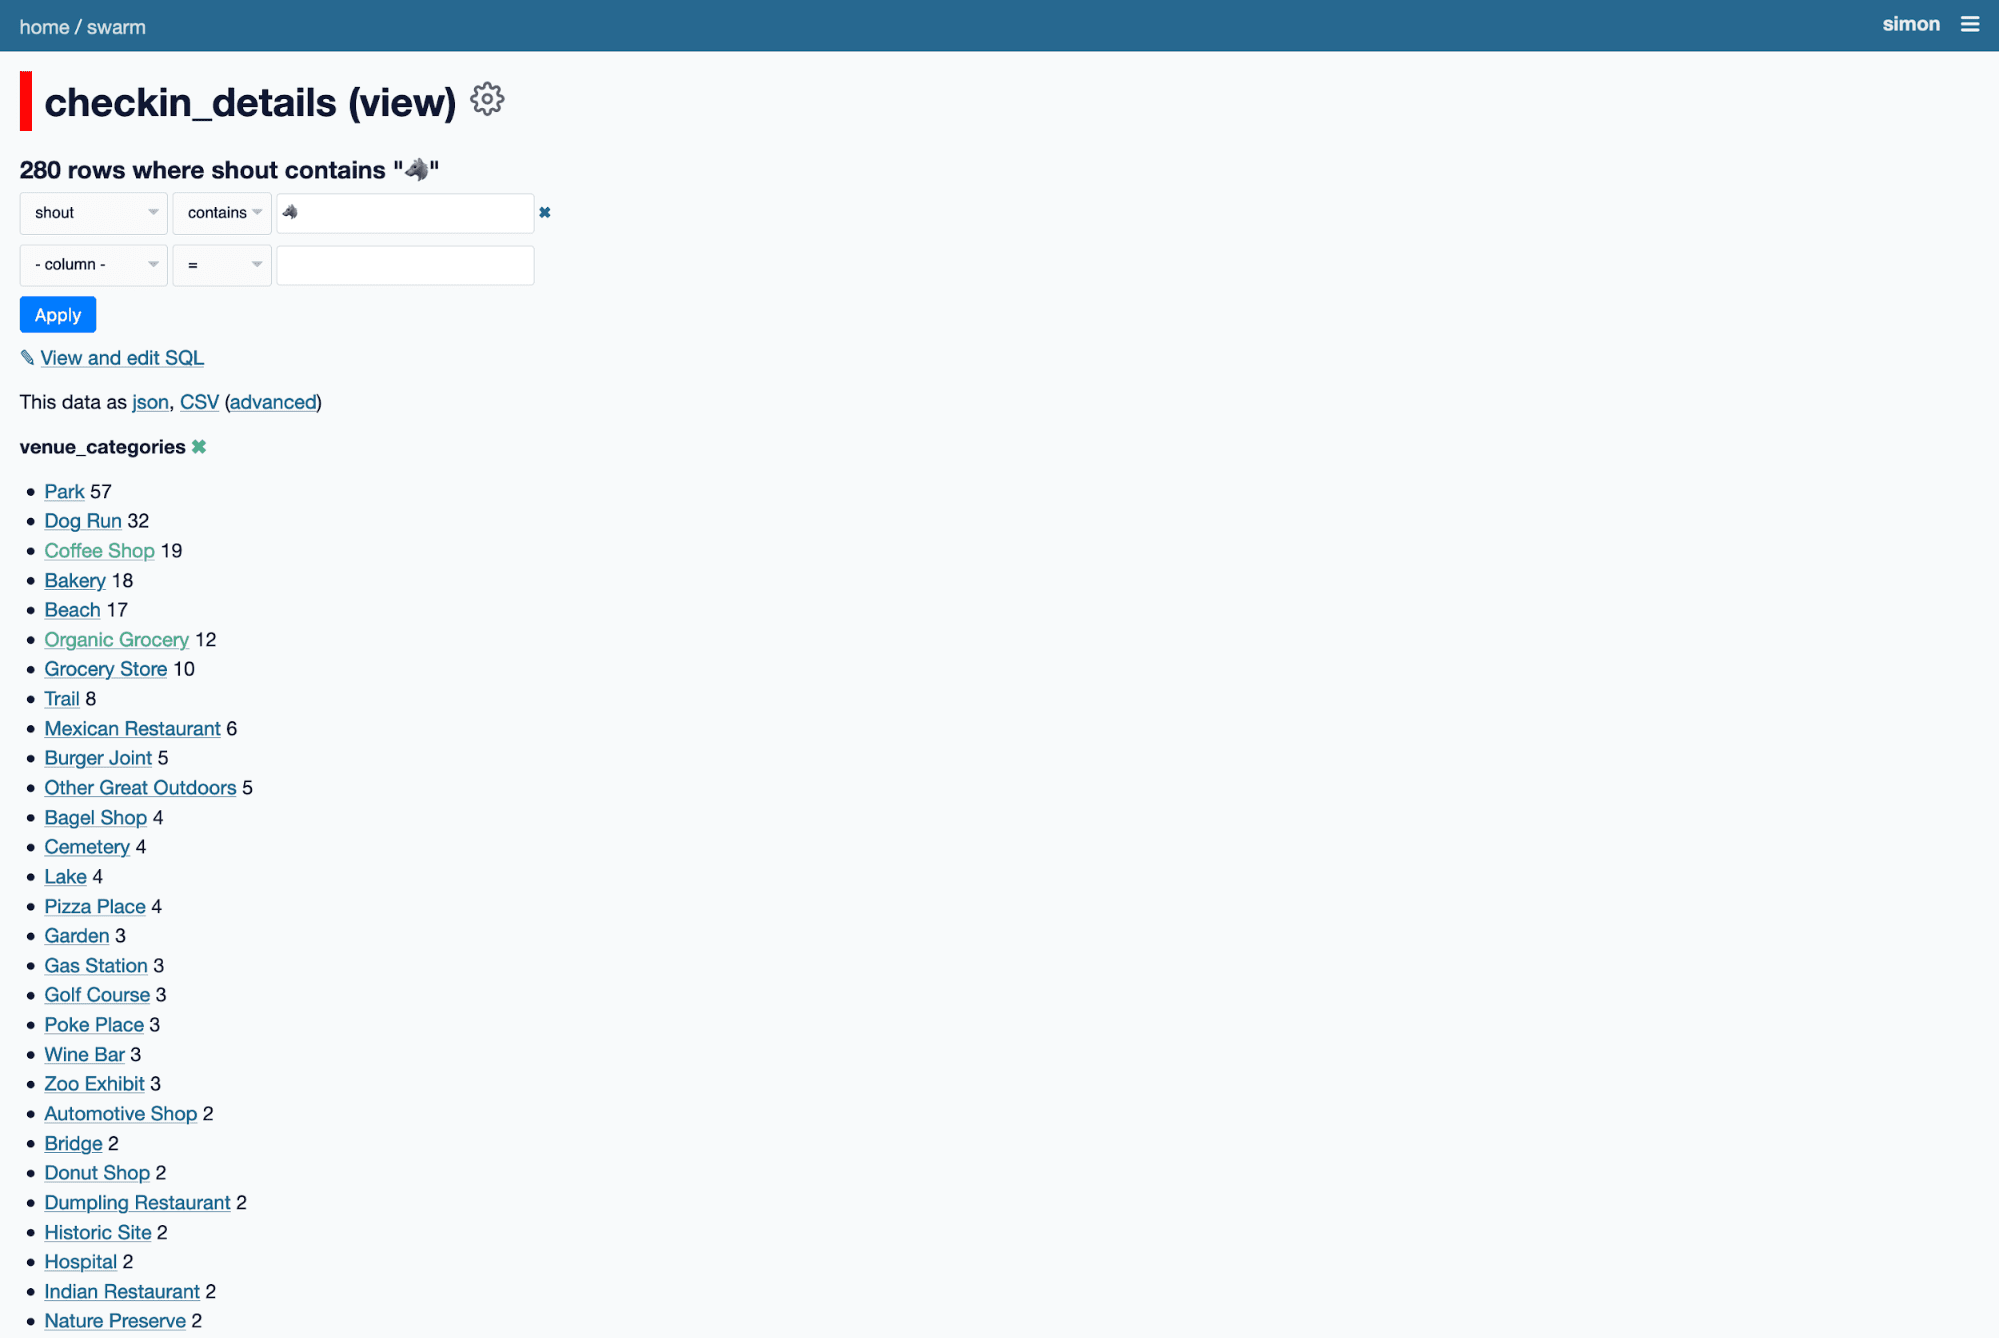
If I facet by venue category, I can see she’s checked in at 57 parks, 32 dog runs, 19 coffee shops and 12 organic groceries.
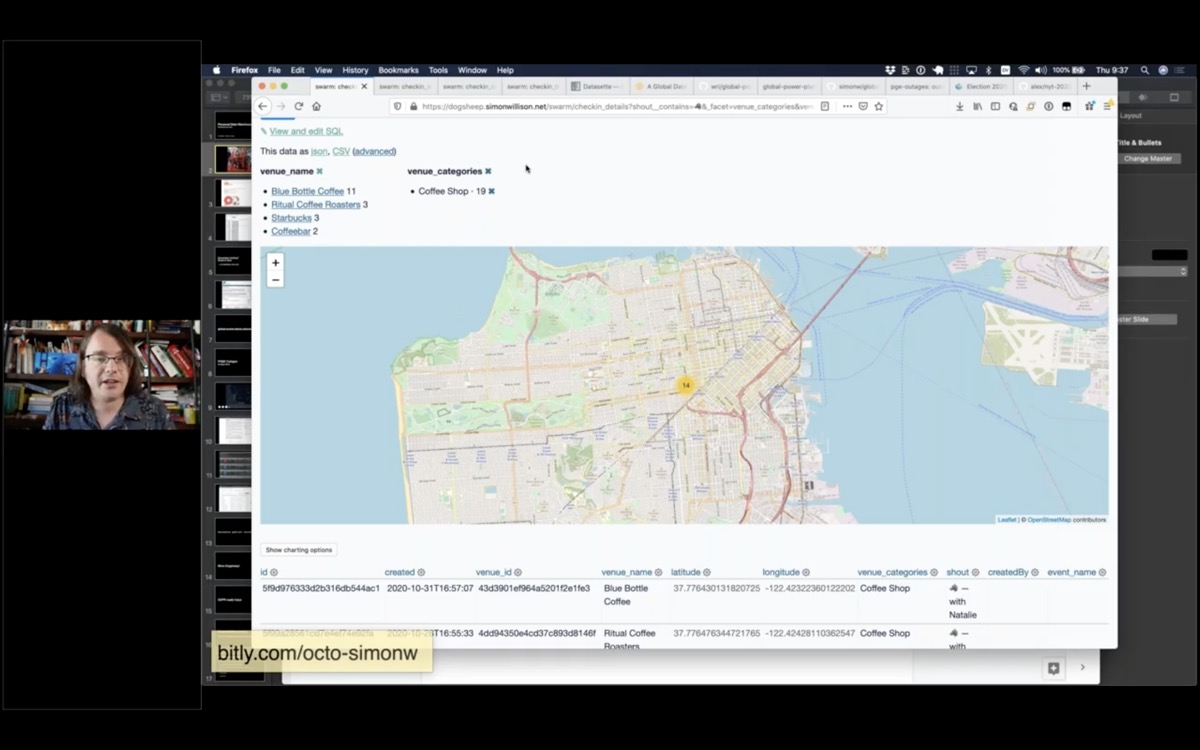
Then I can facet by venue category and filter down to just her 19 checkins at coffee shops.
Turns out she’s a Blue Bottle girl at heart.
Being able to build a map of the coffee shops that your dog likes is obviously a very valuable reason to build your own personal data warehouse.
Let’s take a step back and talk about how this demo works.
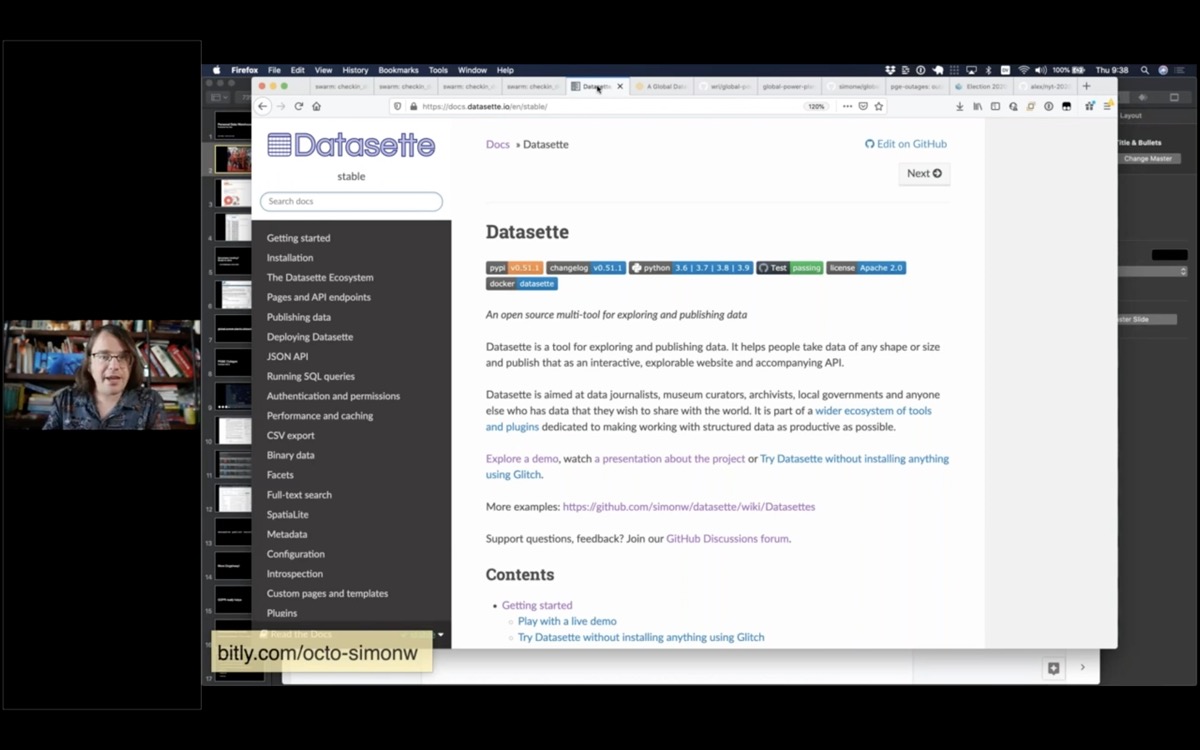
The key to this demo is this web application I’m running called Datasette. I’ve been working on this project for three years now, and the goal is to make it as easy and cheap as possible to explore data in all sorts of shapes and sizes.
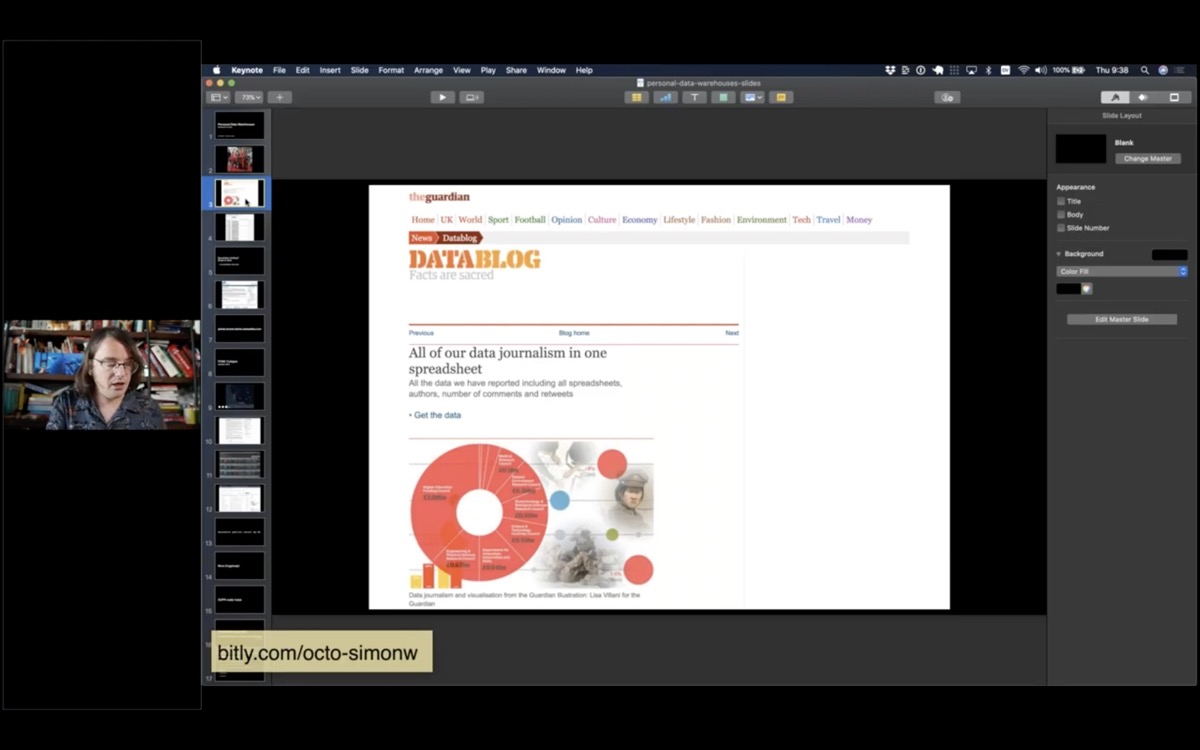
Ten years ago I was working for the Guardian newspaper in London. One of the things I realized when I joined the organization is that newspapers collect enormous amounts of data. Any time they publish a chart or map in the newspaper someone has to collect the underlying information.
There was a journalist there called Simon Rogers who was a wizard at collecting any data you could think to ask for. He knew exactly where to get it from, and had collected a huge number of brilliant spreadsheets on his desktop computer.
We decided we wanted to publish the data behind the stories. We started something called the Data Blog, and aimed to accompany our stories with the raw data behind them.
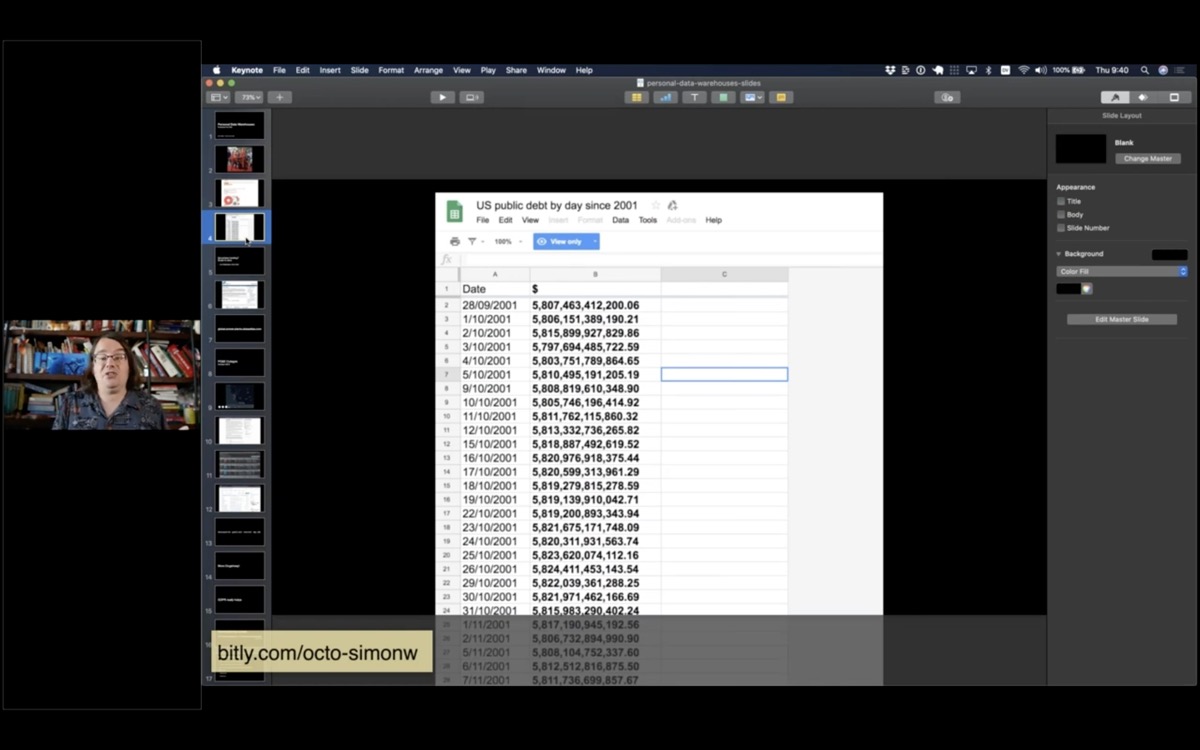
We ended up using Google Sheets to publish the data. It worked, but I always felt like there should be a better way to publish this kind of structured data in a way that was as useful and flexible as possible for our audience.
Fast forward to 2017, when I was looking into this new thing called “serverless” hosting—in particular one called Zeit Now, which has since rebranded as Vercel.
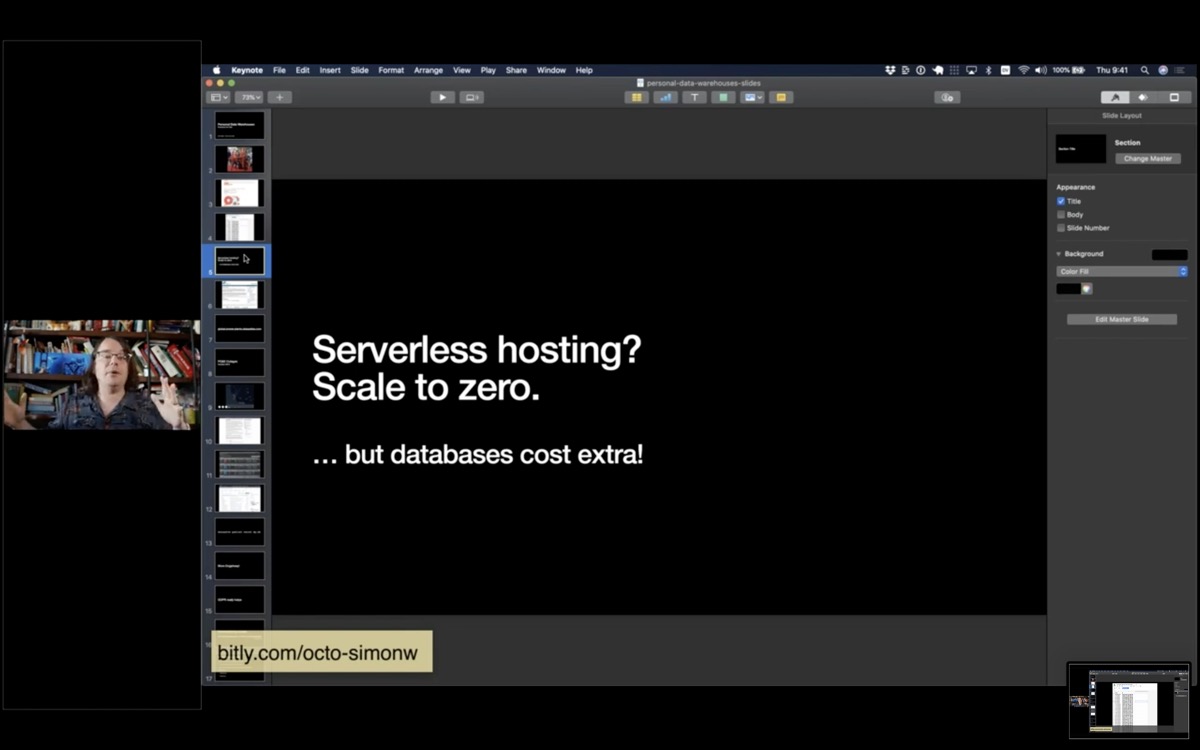
My favourite aspect of Serverless is “Scale to zero”—the idea that you only pay for hosting when your project is receiving traffic.
If you’re like me, and you love building side-projects but you don’t like paying $5/month for them for the rest of your life, this is perfect.
The catch is that serverless providers tend to charge you extra for databases, or require you to buy a hosted database from another provider.
But what if your database doesn’t change? Can you bundle your database in the same container as your code?
This was the initial inspiration behind creating Datasette.
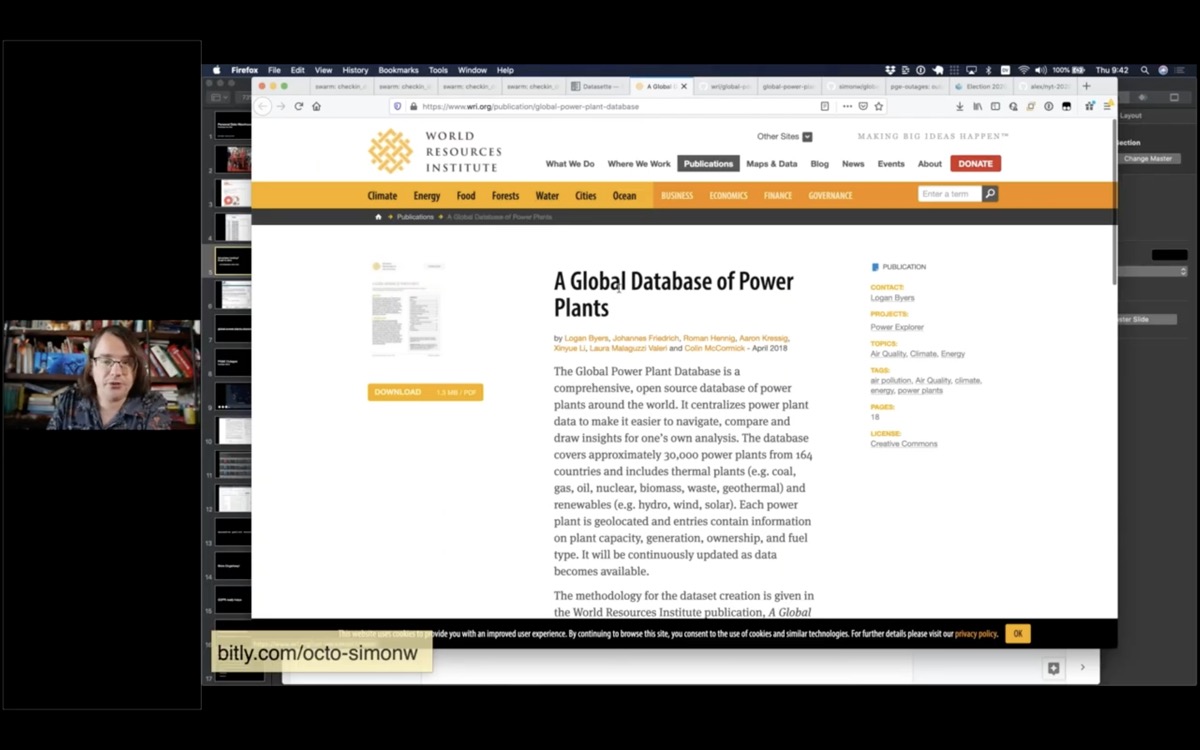
Here’s another demo. The World Resources Institute maintain a CSV file of every power plant in the world.
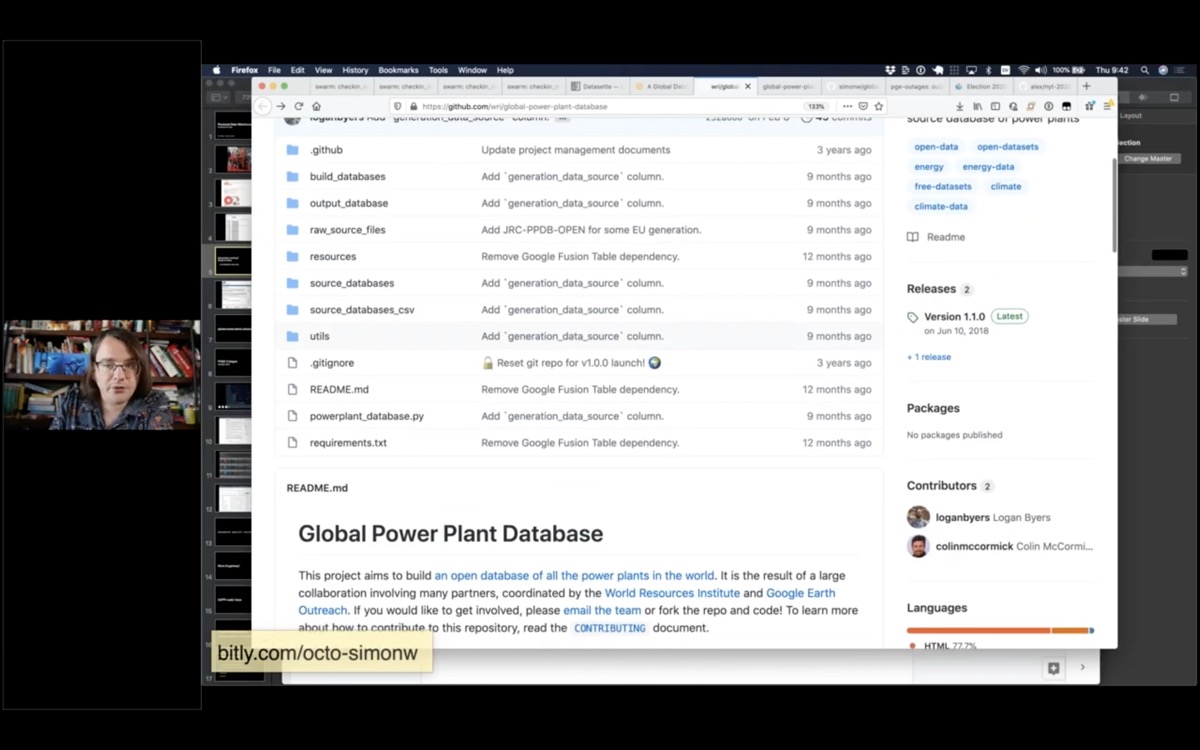
Like many groups, they publish that data on GitHub.
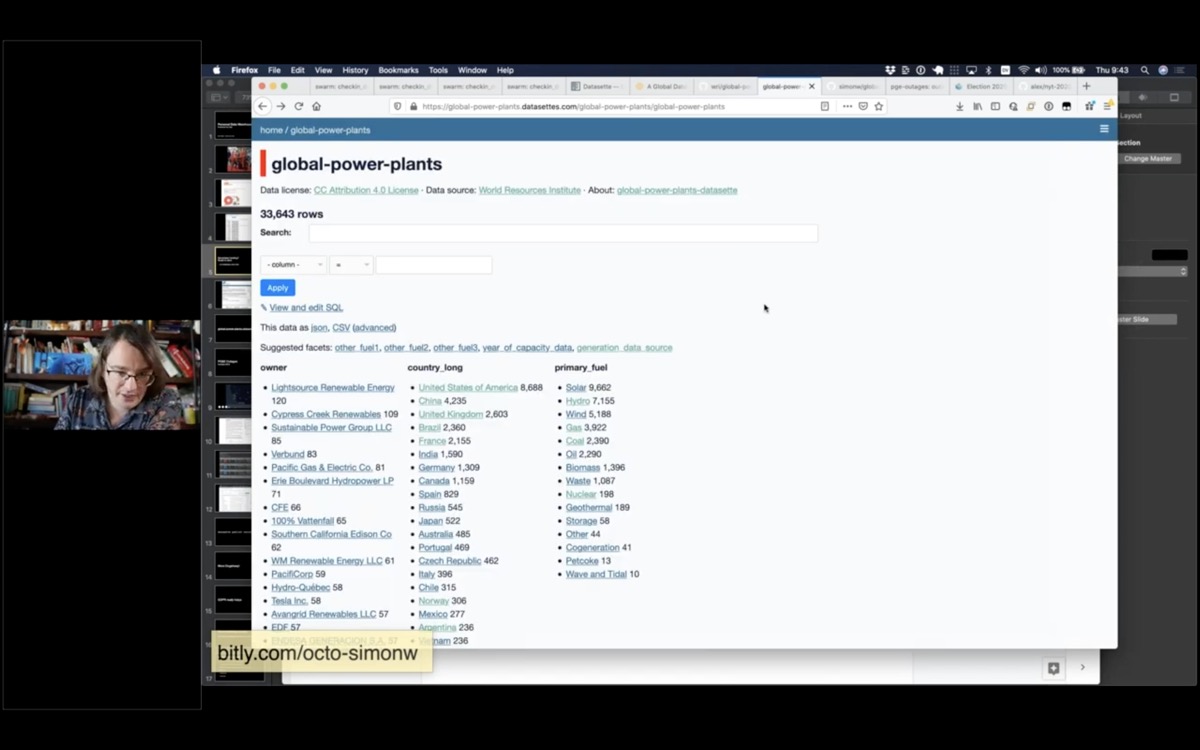
I have a script that grabs their most recent data and publishes it using Datasette.
Here’s the contents of their CSV file published using Datasette
Datasette supports plugins. You’ve already seen this plugin in my demo of Cleo’s coffee shops—it’s called datasette-cluster-map and it works by looking for tables with a latitude and longitude column and plotting the data on a map.
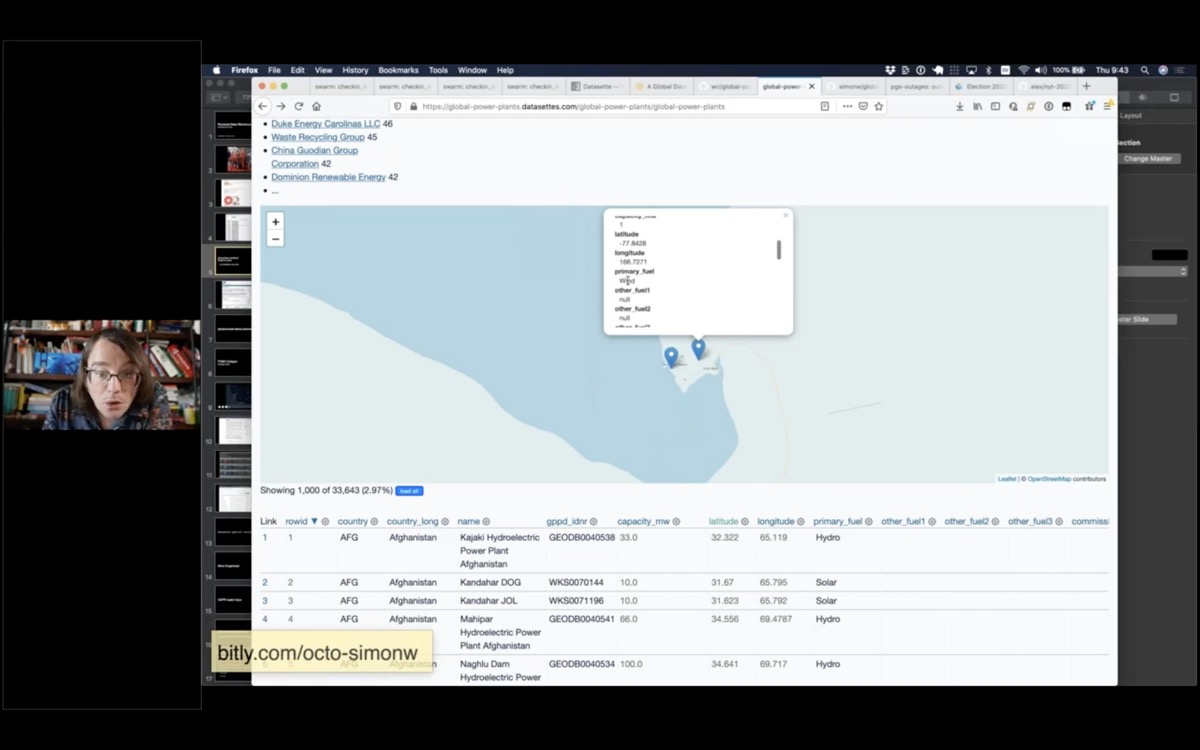
Straight away looking at this data you notice that there’s a couple of power plants down here in Antarctica. This is McMurdo station, and it has a 6.6MW oil generator.
And oh look, there’s a wind farm down there too on Ross Island knocking out 1MW of electricity.
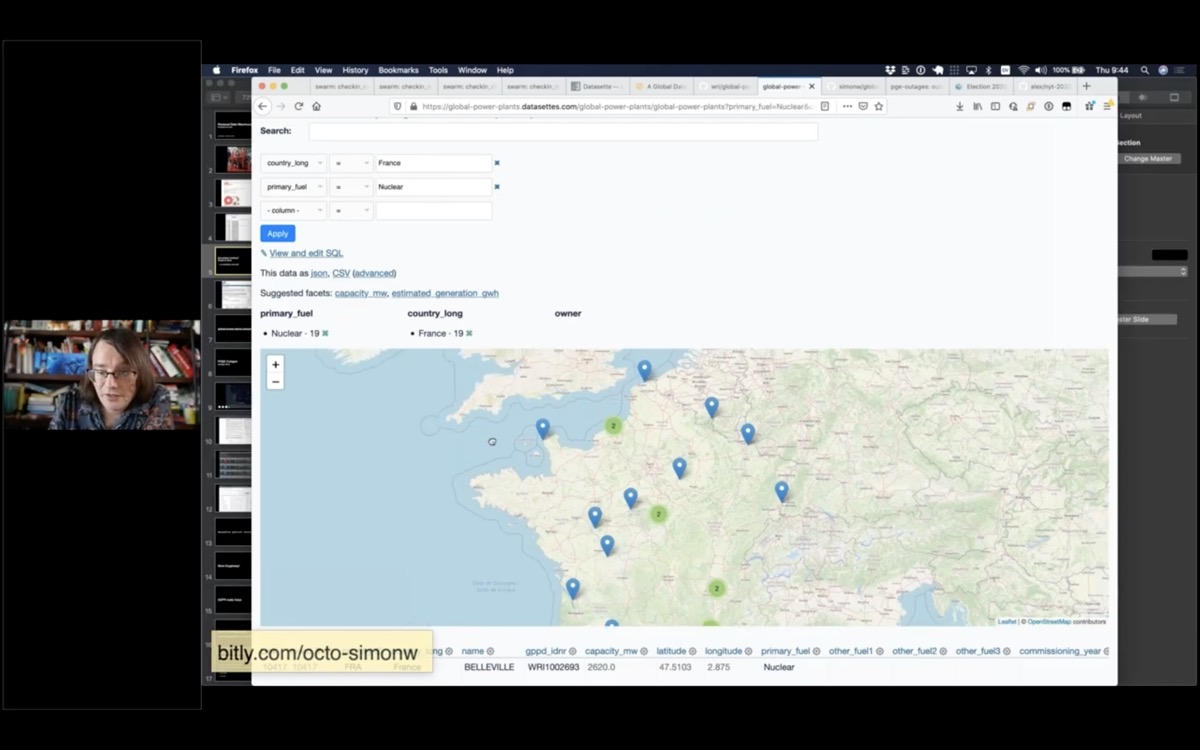
But this is also a demonstration of faceting. I can slice down to just the nuclear power plants in France and see those on a map.
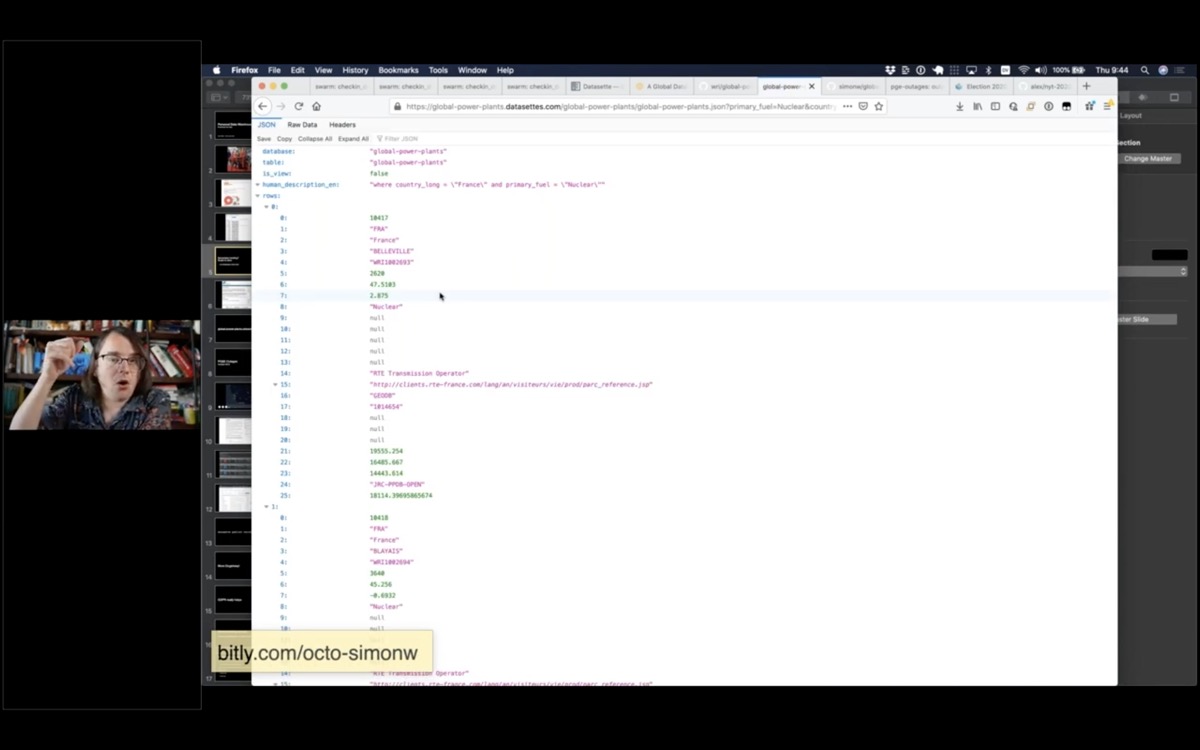
And anything i can see in the interface, I can get out as JSON. Here’s a JSON file showing all of those nuclear power plants in France.
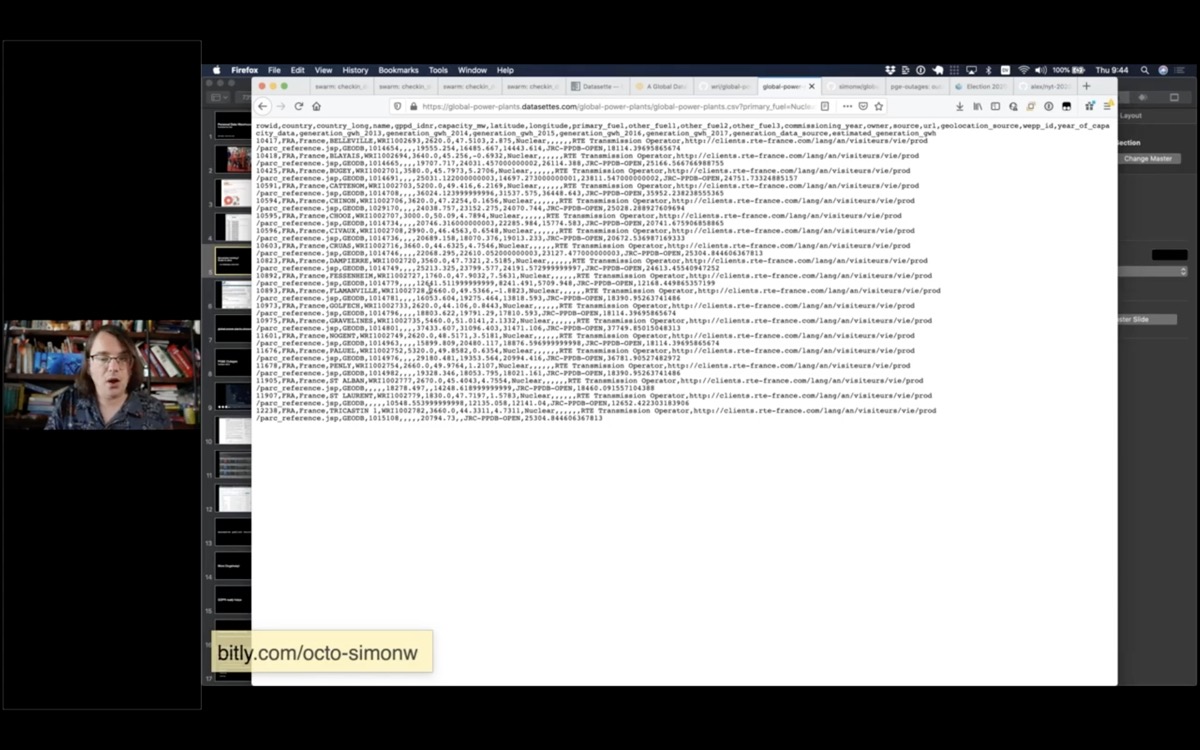
And here’s a CSV export which I can use to pull the data into Excel or other CSV-compatible software.
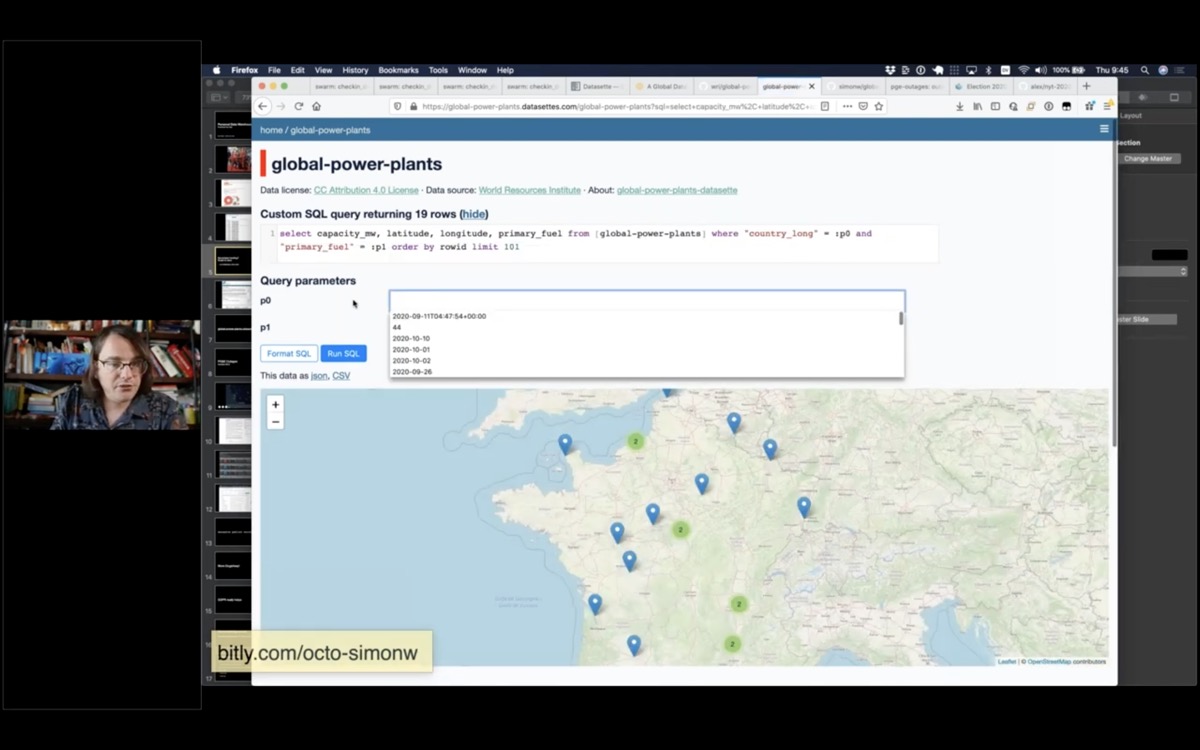
If I click “view and edit SQL” to get back the SQL query that was used to generate the page—and I can edit and re-execute that query.
I can get those custom results back as CSV or JSON as well!
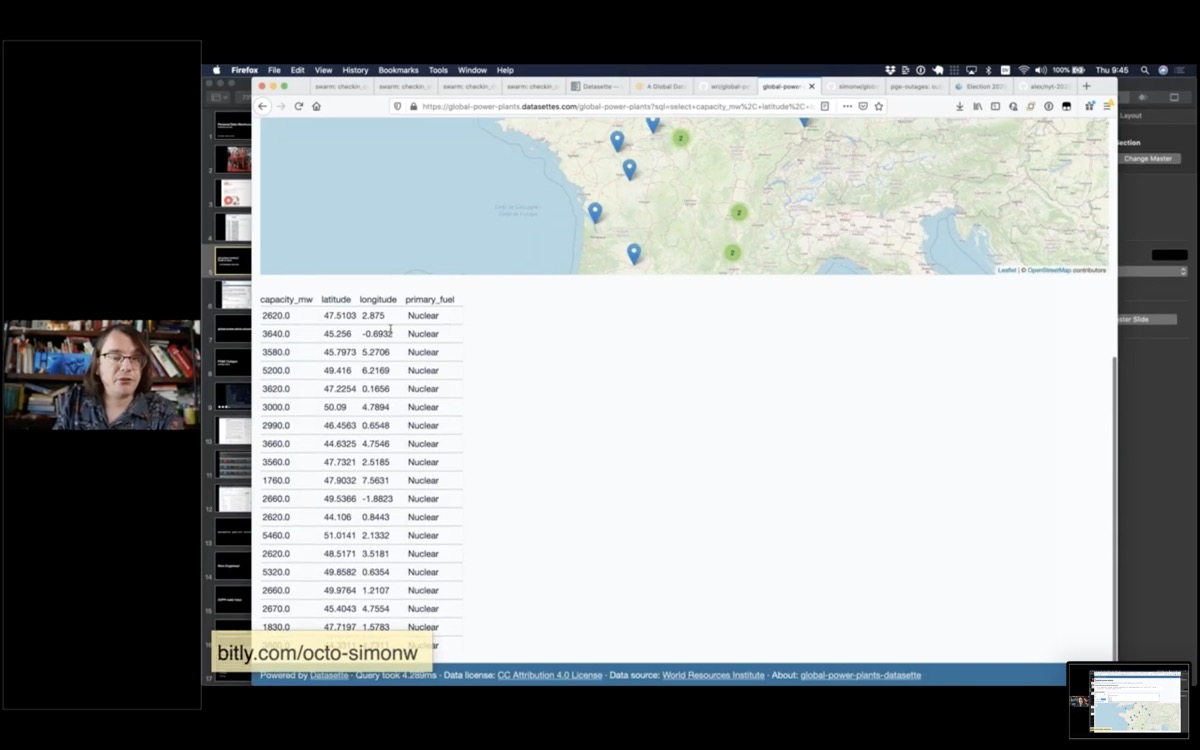
In most web applications this would be seen as a terrifying security hole—it’s a SQL injection attack, as a documented feature!
A couple of reasons this isn’t a problem here:
Firstly, this is setup as a read-only database: INSERT and UPDATE statements that would modify it are not allowed. There’s a one second time limit on queries as well.
Secondly, everything in this database is designed to be published. There are no password hashes or private user data that could be exposed here.
This also means we have a JSON API that lets JavaScript execute SQL queries against a backend! This turns out to be really useful for rapid prototyping.
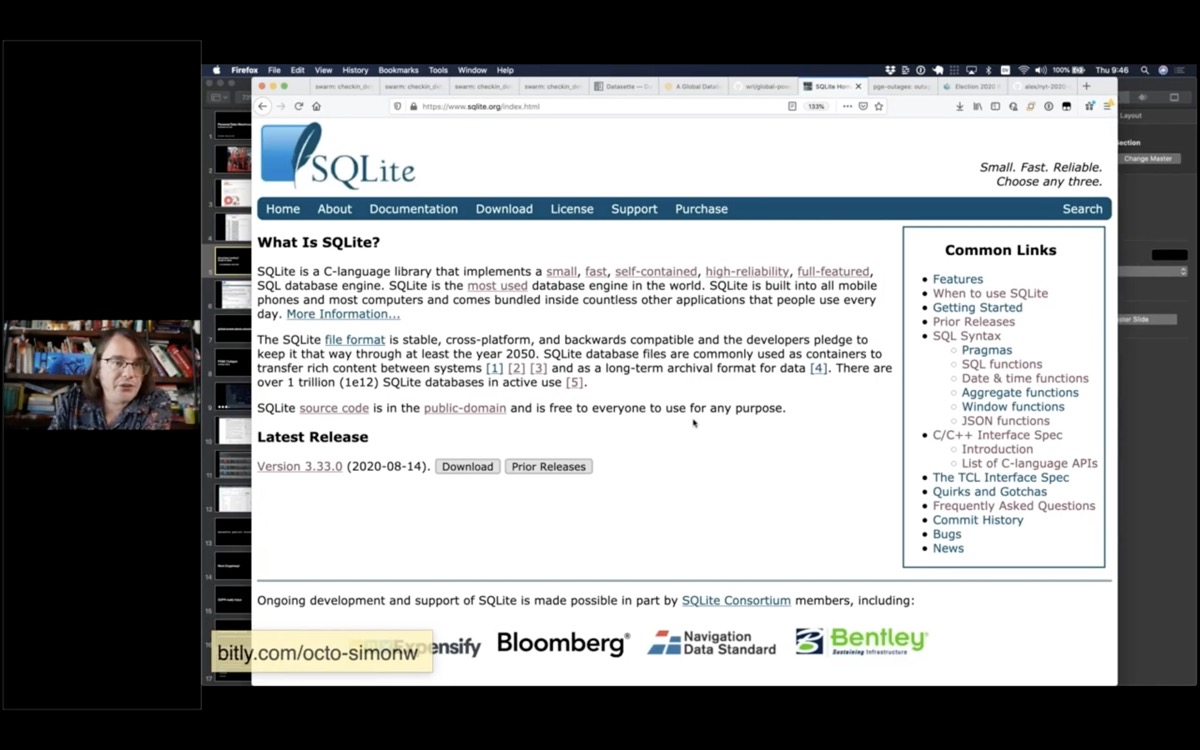
It’s worth talking about the secret sauce that makes this all possible.
This is all built on top of SQLite. Everyone watching this talk uses SQLite every day, even if you don’t know it.
Most iPhone apps use SQLite, many desktop apps do, it’s even running inside my Apple Watch.
One of my favourite features is that a SQLite database is a single file on disk. This makes it easy to copy, send around and also means I can bundle data up in that single file, include it in a Docker file and deploy it to serverless hosts to serve it on the internet.
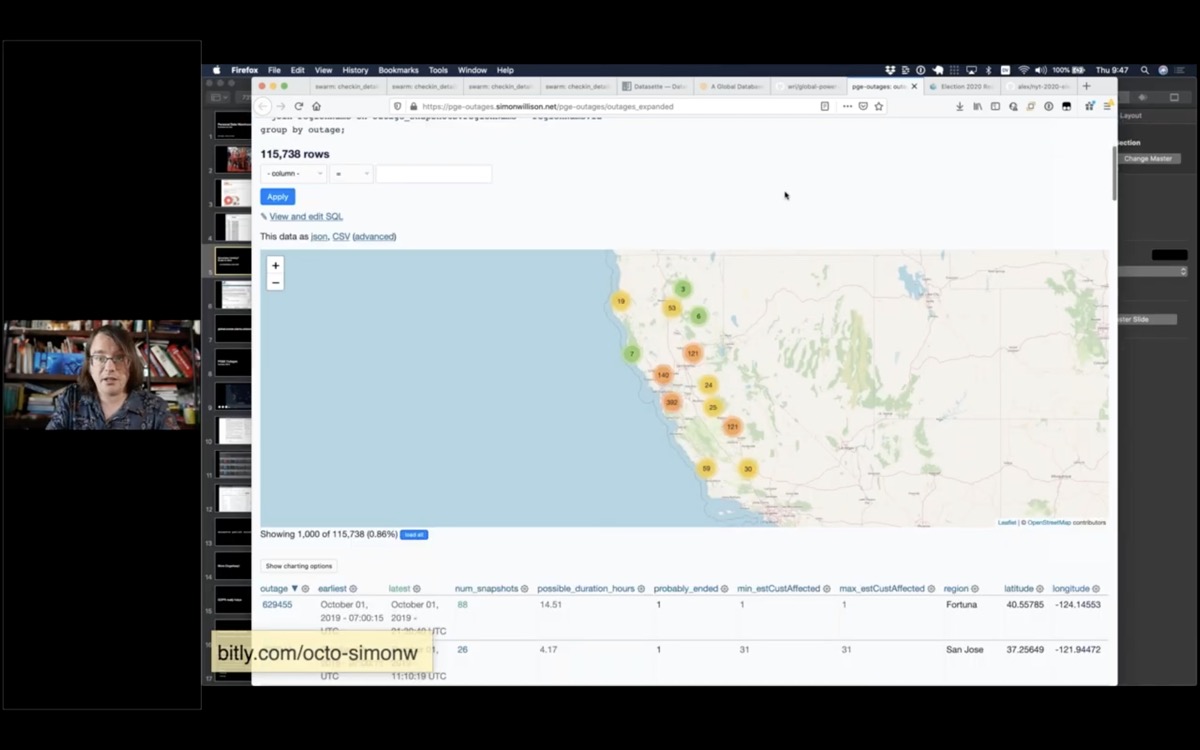
Here’s another demo that helps show how GitHub fits into all of this.
Last year PG&E—the power company that covers much of California—turned off the power to large swathes of the state.
I got lucky: six months earlier I had started scraping their outage map and recording the history to a GitHub repository.
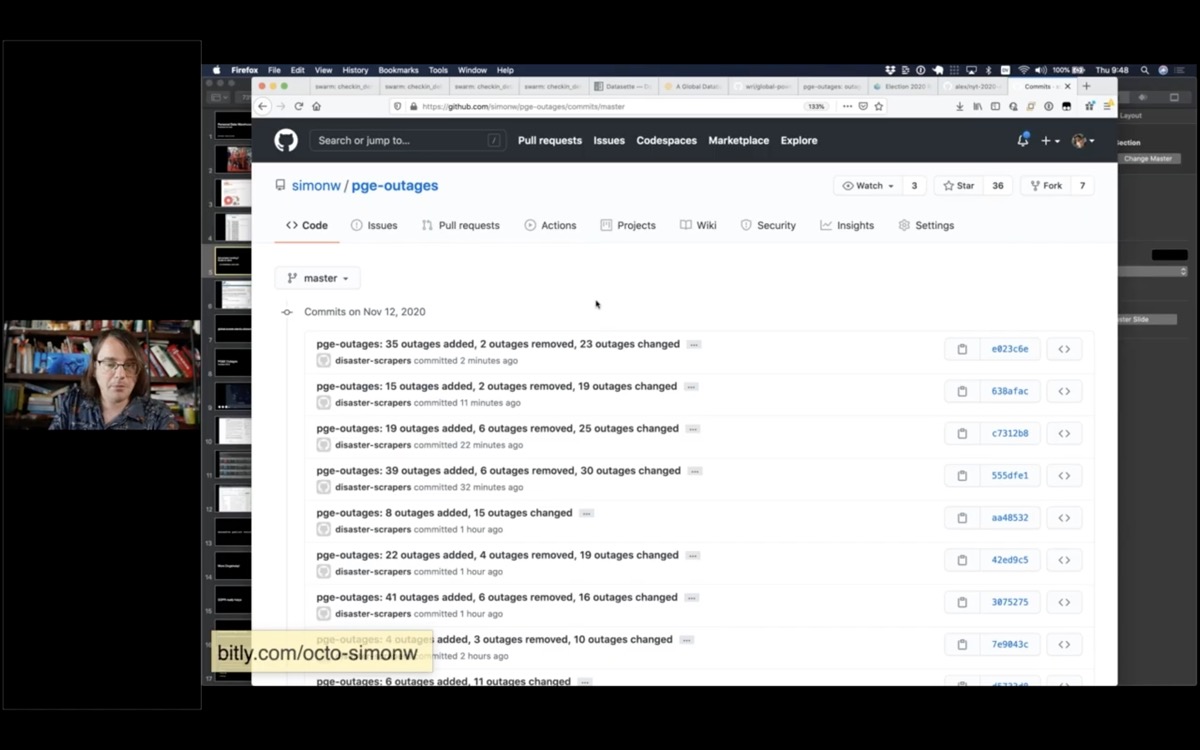
simonw/pge-outages is a git repository with 34,000 commits tracking the history of outages that PG&E had published on their outage map.
You can see that two minutes ago they added 35 new outages.
I’m using this data to publish a Datasette instance with details of their historic outages. Here’s a page showing their current outages ordered by the most customers affected by the outage.
Read Tracking PG&E outages by scraping to a git repo for more details on this project.
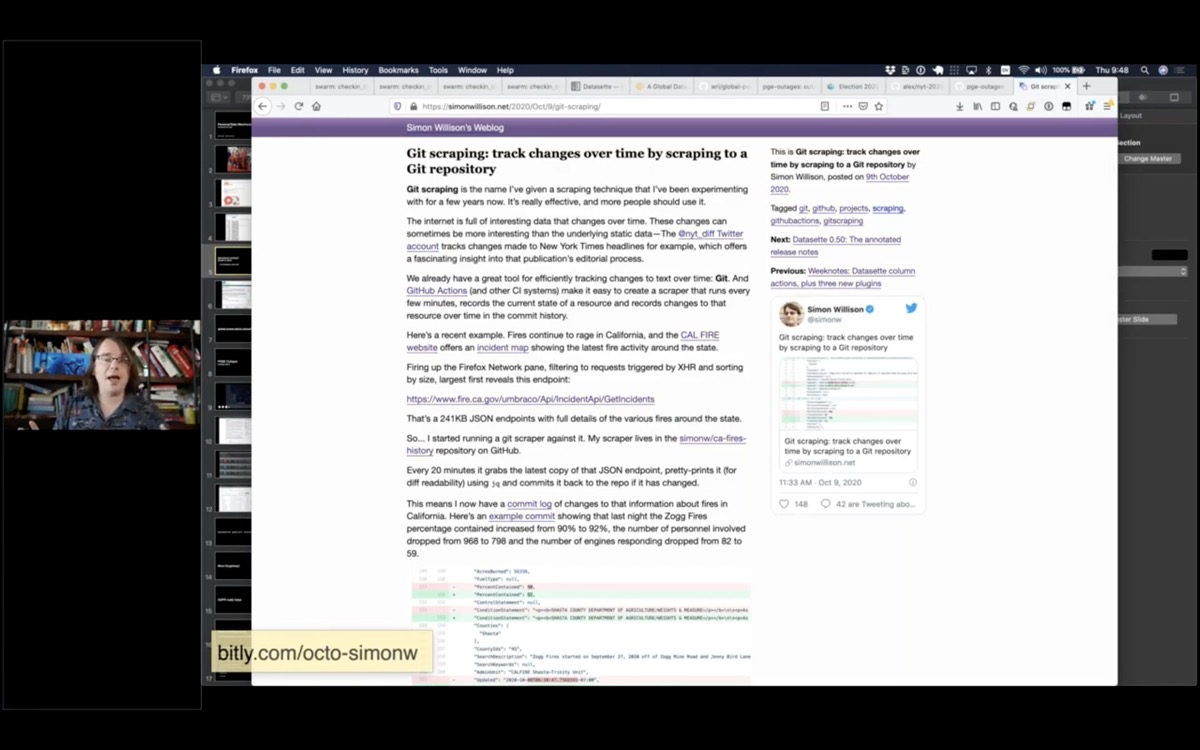
I recently decided to give this technique a name. I’m calling it Git scraping—the idea is to take any data source on the web that represents a point-in-time and commit it to a git repository that tells the story of the history of that particular thing.
Here’s my article describing the pattern in more detail: Git scraping: track changes over time by scraping to a Git repository.
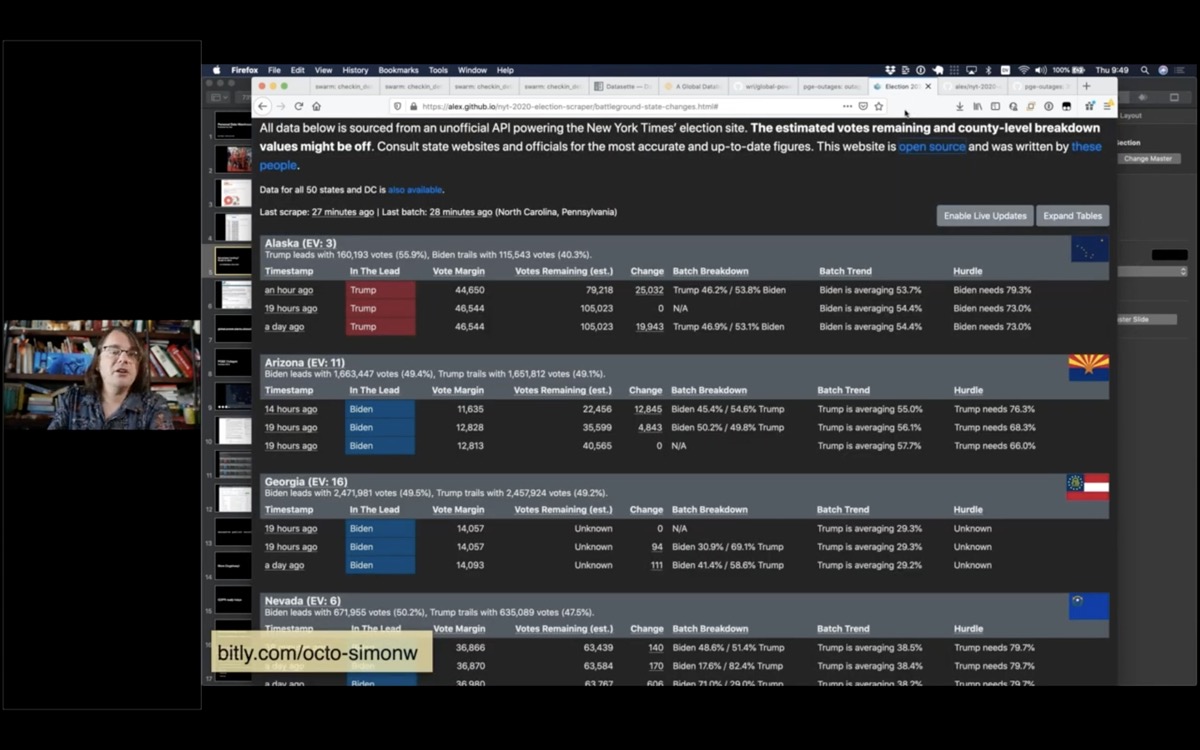
This technique really stood out just last week during the US election.
This is the New York Times election scraper website, built by Alex Gaynor and a growing team of contributors. It scrapes the New York Times election results and uses the data over time to show how the results are trending.
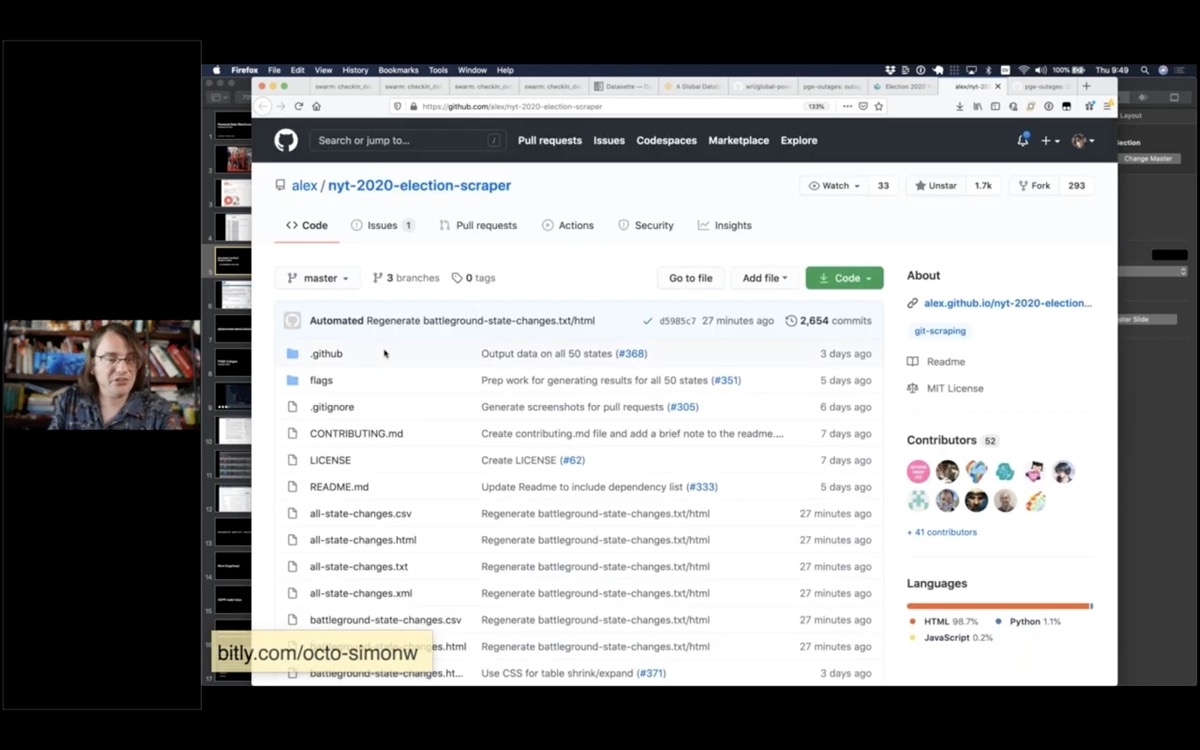
It uses a GitHub Actions script that runs on a schedule, plus a really clever Python script that turns it into a useful web page.
You can find more examples of Git scraping under the git-scraping topic on GitHub.
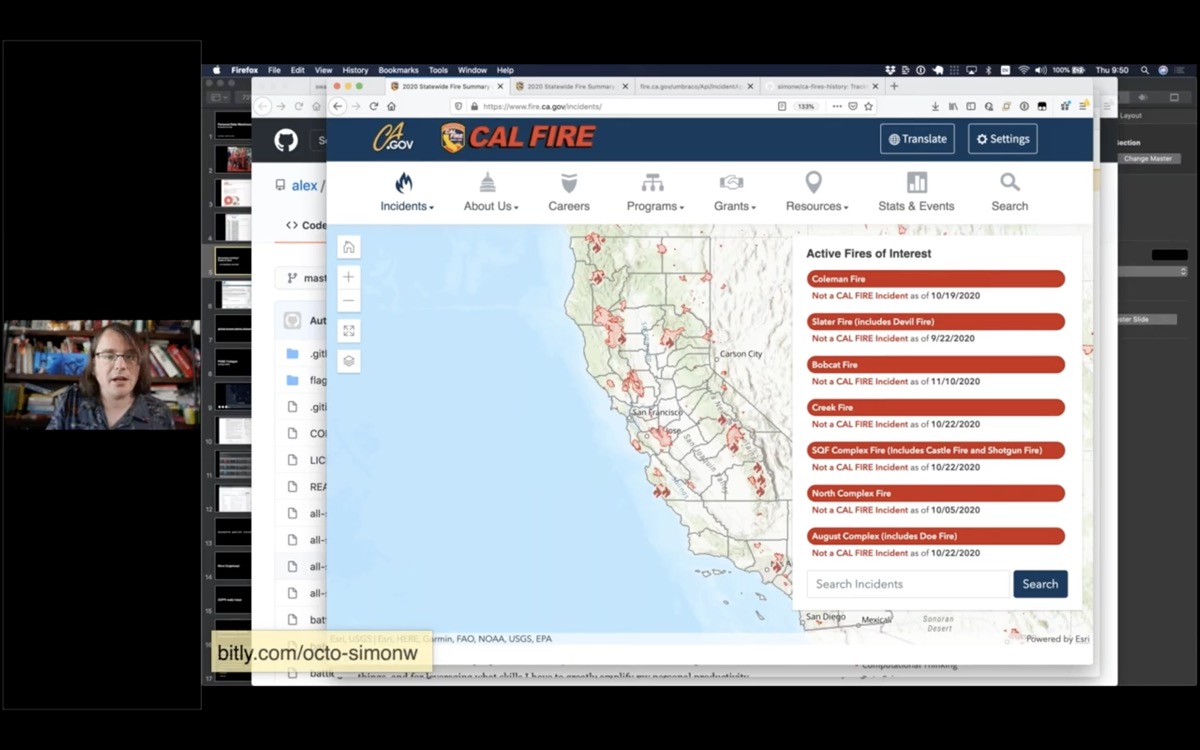
I’m going to do a bit of live coding to show you how this stuff works.
This is the incidents page from the state of California CAL FIRE website.
Any time I see a map like this, my first instinct is to open up the browser developer tools and try to figure out how it works.
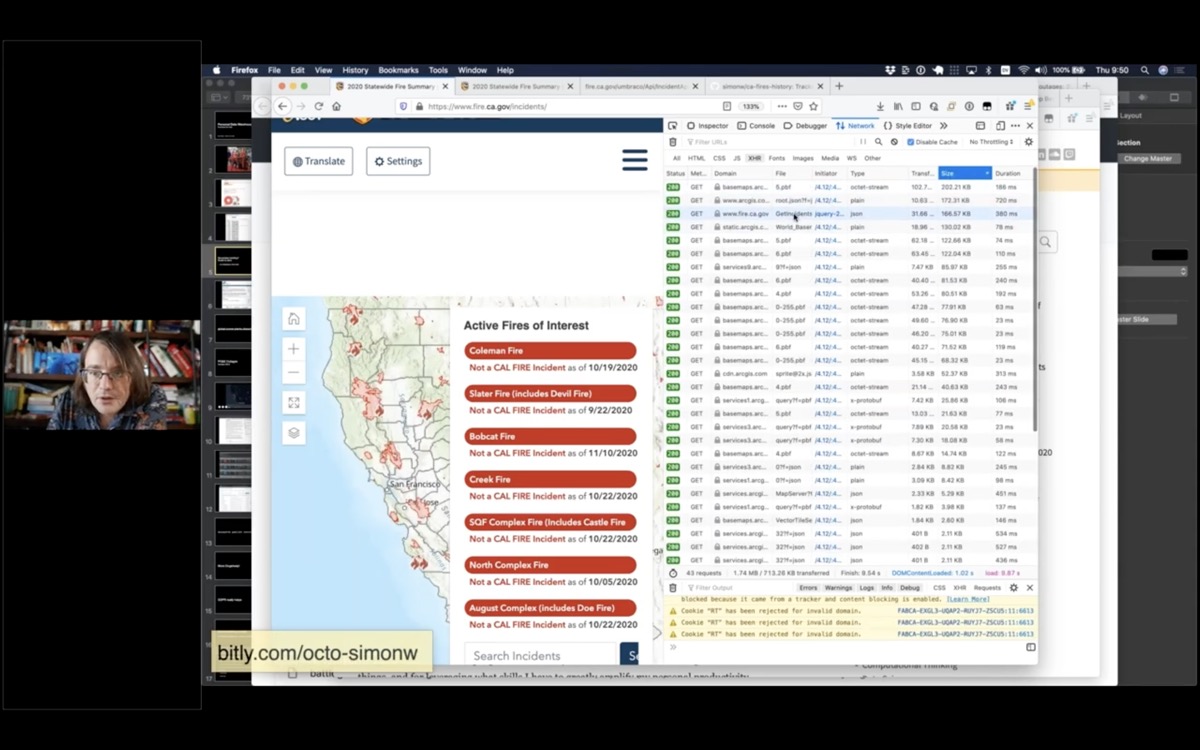
If I open the network tab, refresh the page and then filter to just XHR requests.
A neat trick is to order by size—because inevitably the thing at the top of the list is the most interesting data on the page.
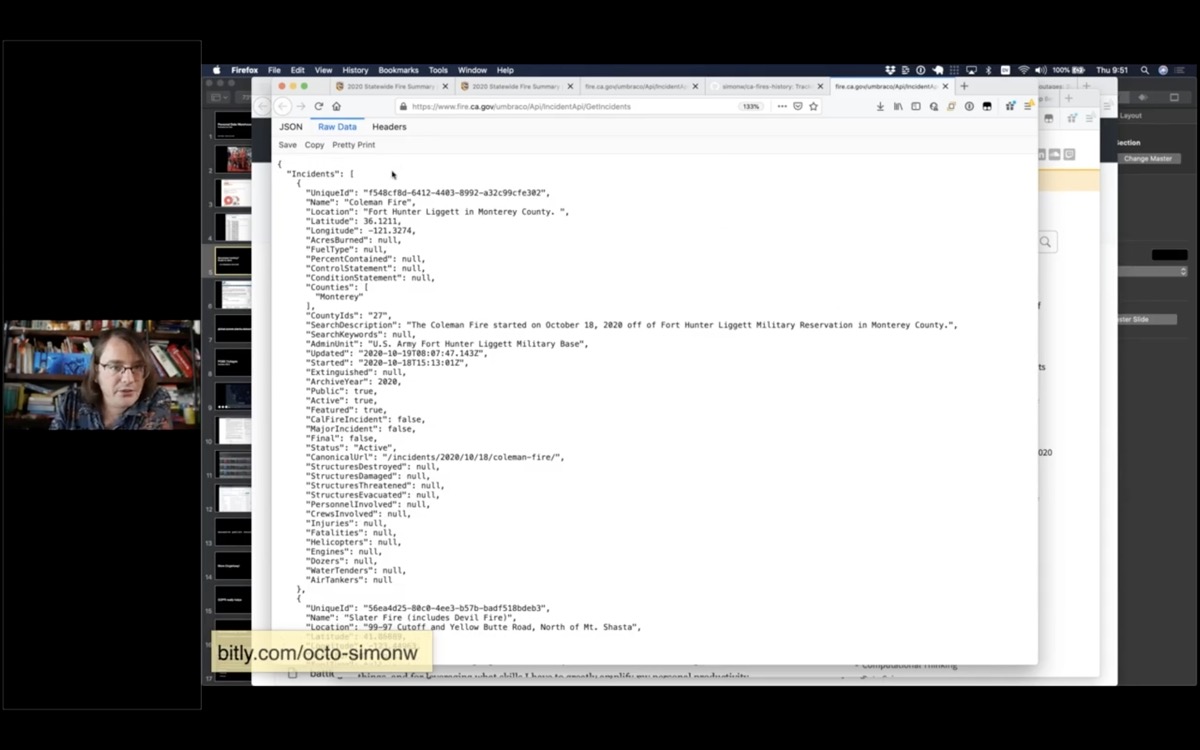
This appears to be a JSON file telling me about all of the current fires in the state of California!
(I set up a Git scraper for this a while ago.)
Now I’m going to take this a step further and turn it into a Datasette instance.
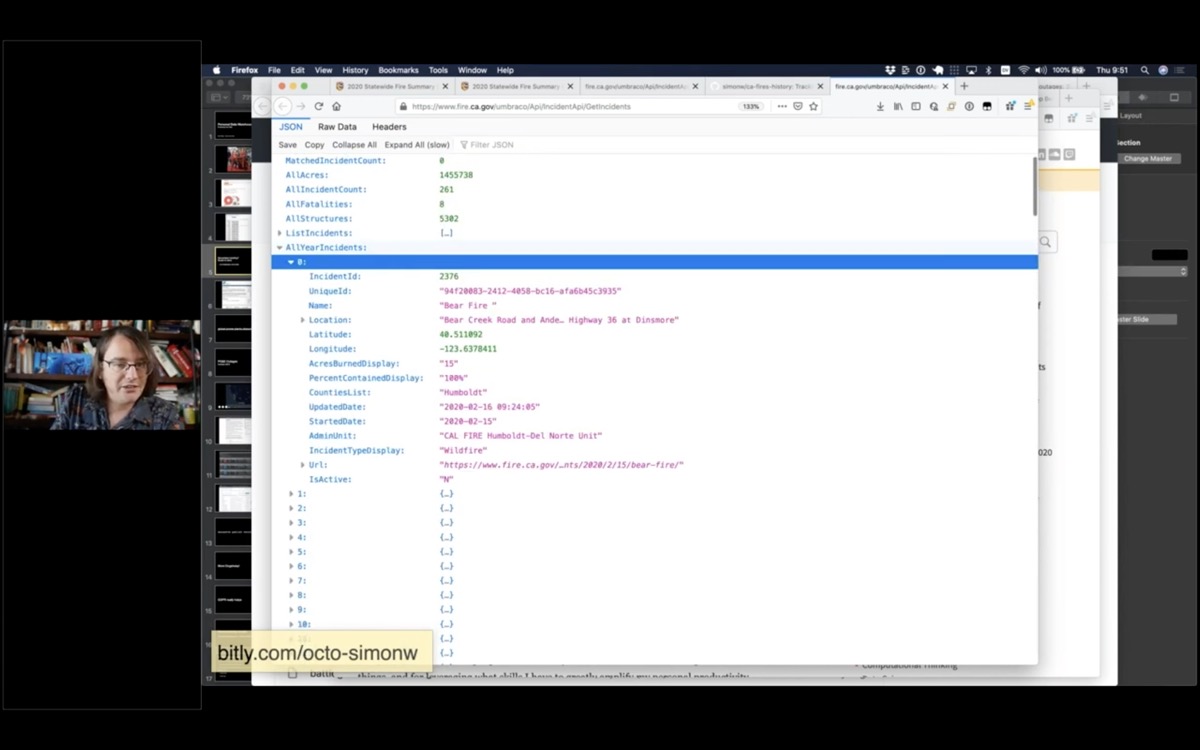
It looks like the AllYearIncidents key is the most interesting bit here.
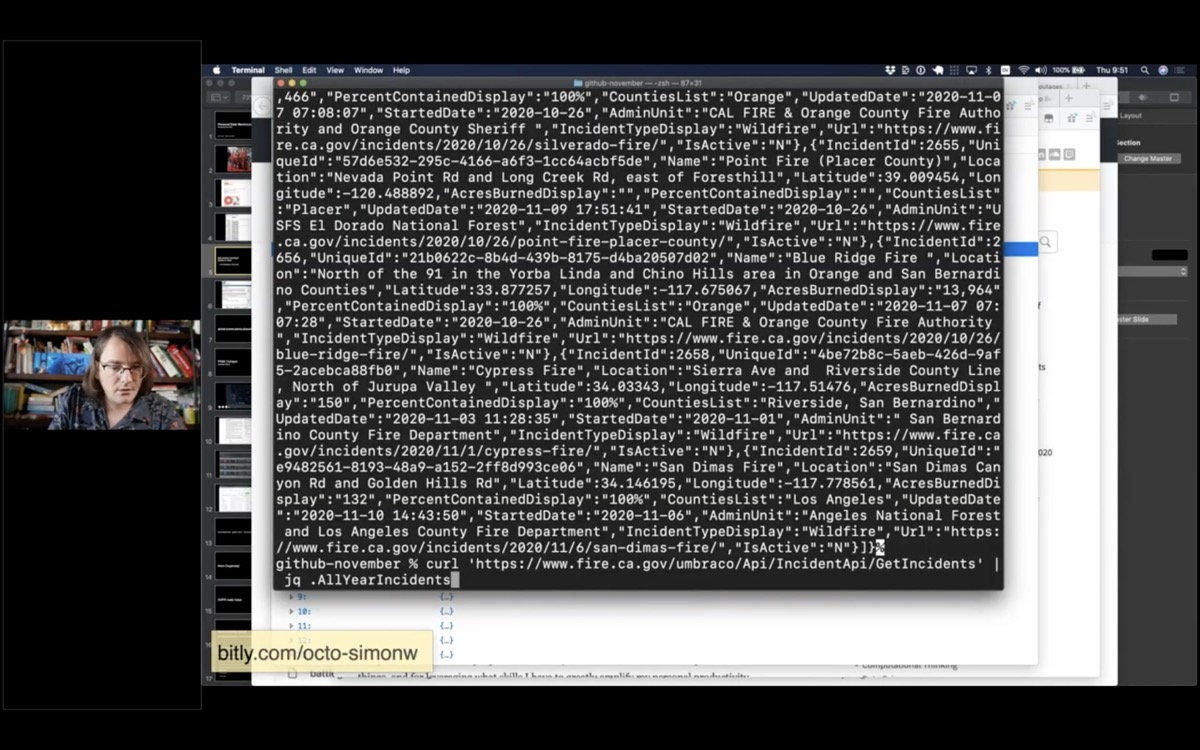
I’m going to use curl to fetch that data, then pipe it through jq to filter for just that AllYearIncidents array.
curl 'https://www.fire.ca.gov/umbraco/Api/IncidentApi/GetIncidents' \
        | jq .AllYearIncidents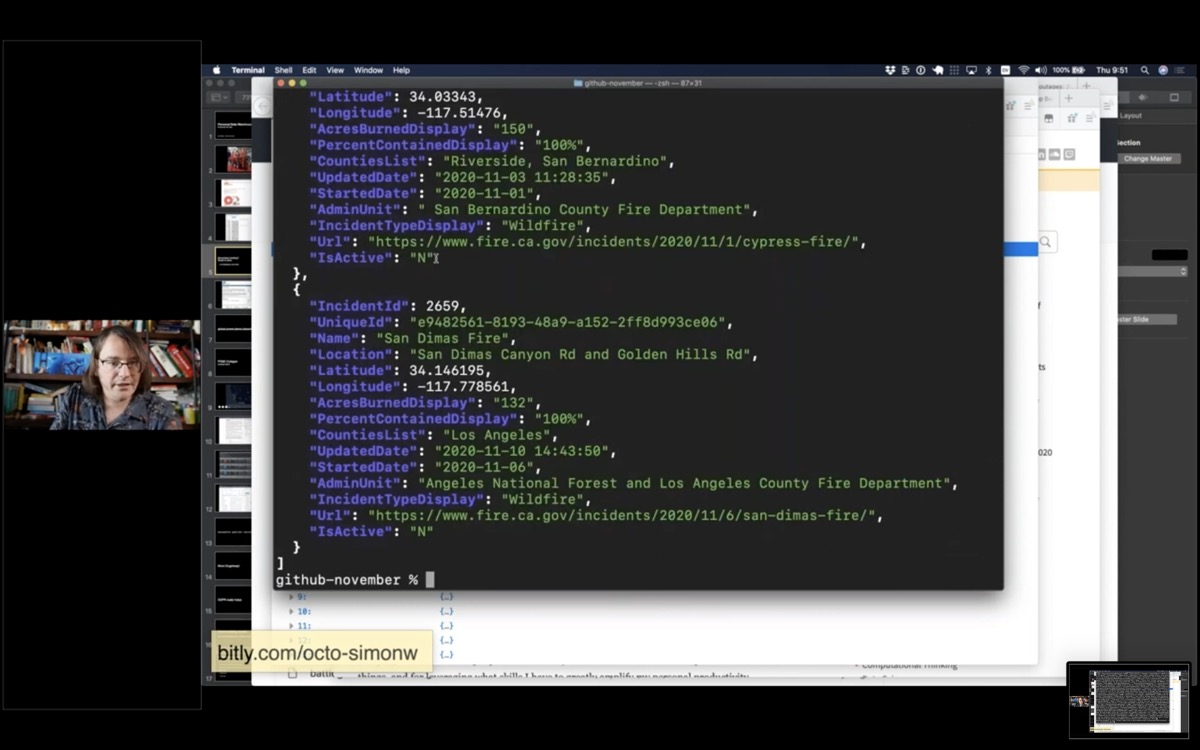
Now I have a list of incidents for this year.
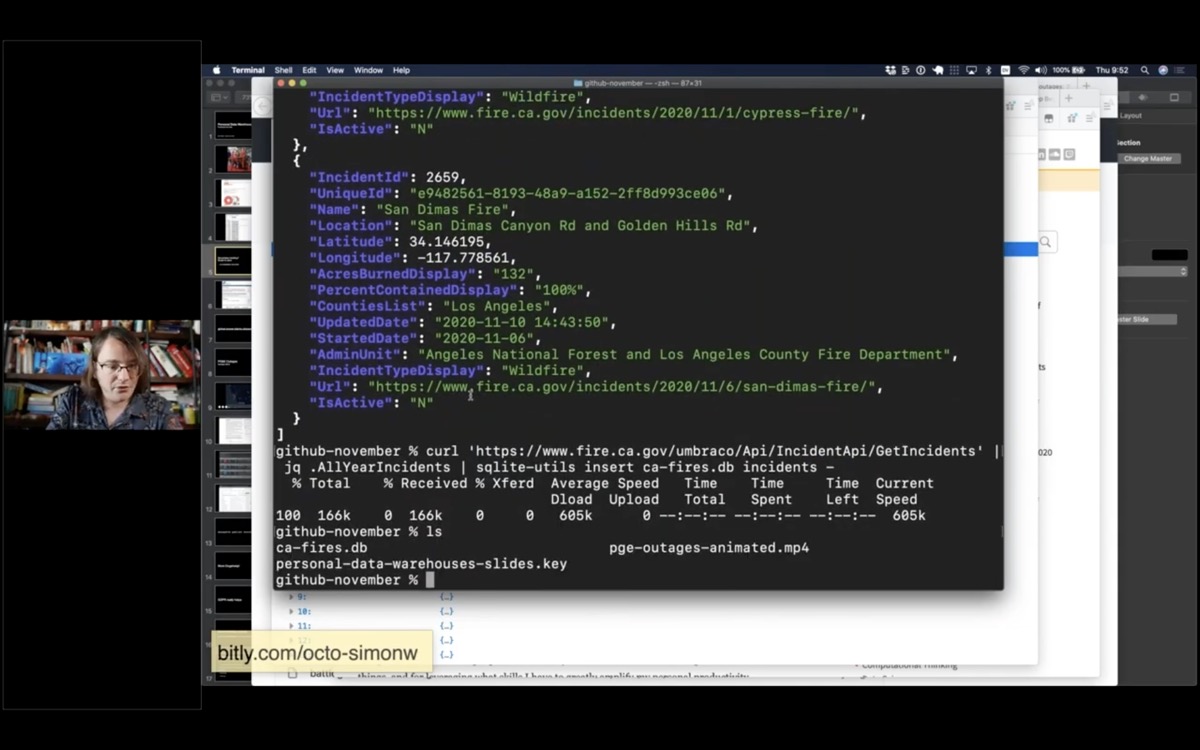
Next I’m going to pipe it into a tool I’ve been building called sqlite-utils—it’s a suite of tools for manipulating SQLite databases.
I’m going to use the “insert” command and insert the data into a ca-fires.db in an incidents table.
curl 'https://www.fire.ca.gov/umbraco/Api/IncidentApi/GetIncidents' \
        | jq .AllYearIncidents \
        | sqlite-utils insert ca-fires.db incidents -
Now I’ve got a ca-fires.db file. I can open that in Datasette:
datasette ca-fires.db -o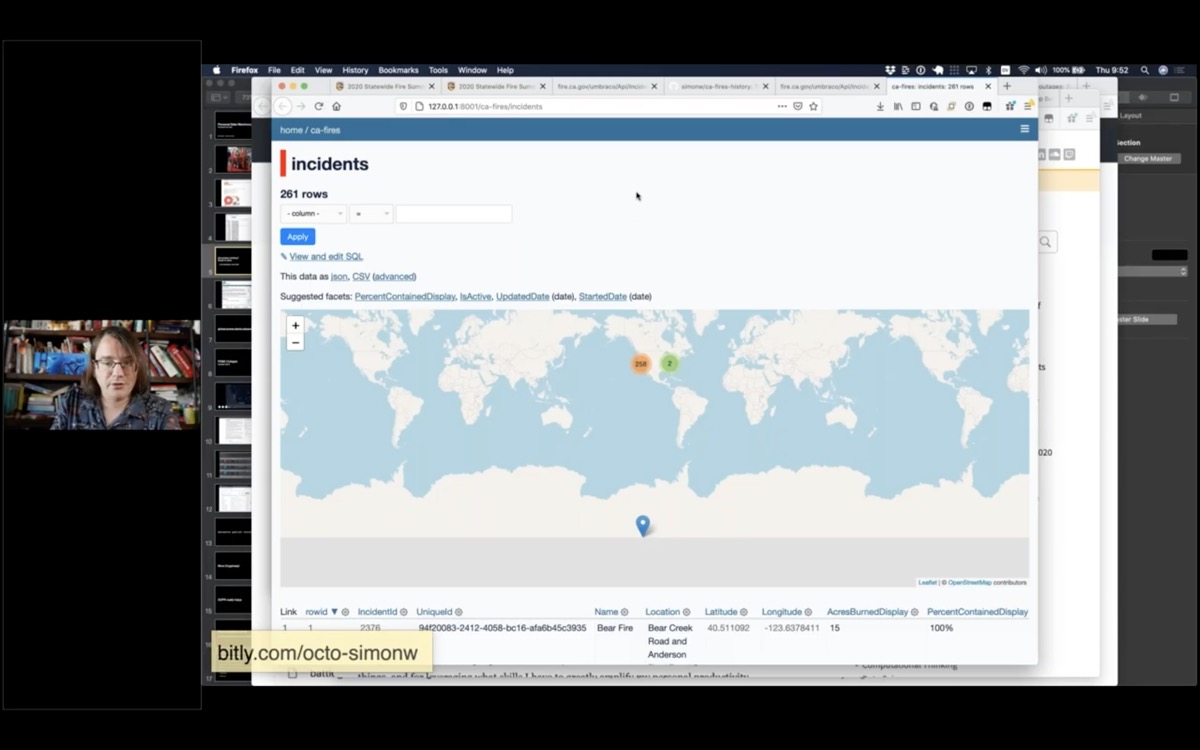
And here it is—a brand new database.
You can straight away see that one of the rows has a bad location, hence it appears in Antarctica.
But 258 of them look like they are in the right place.
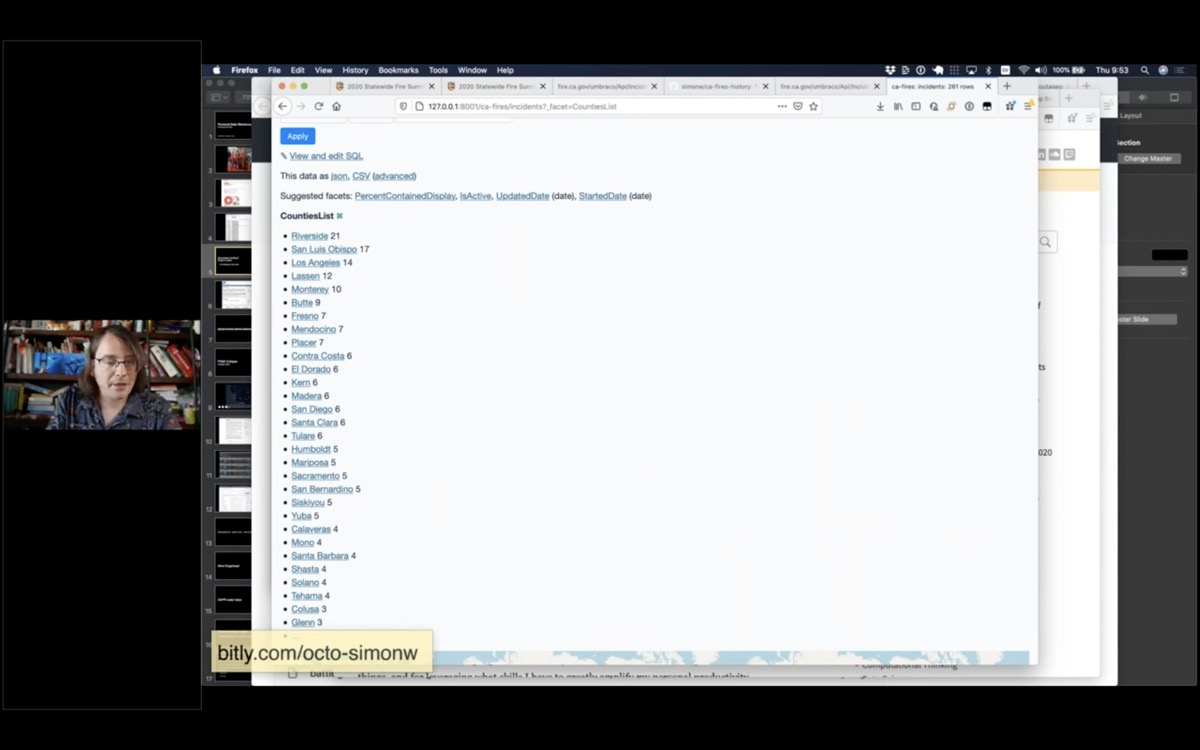
I can also facet by county, to see which county had the most fires in 2020—Riverside had 21.
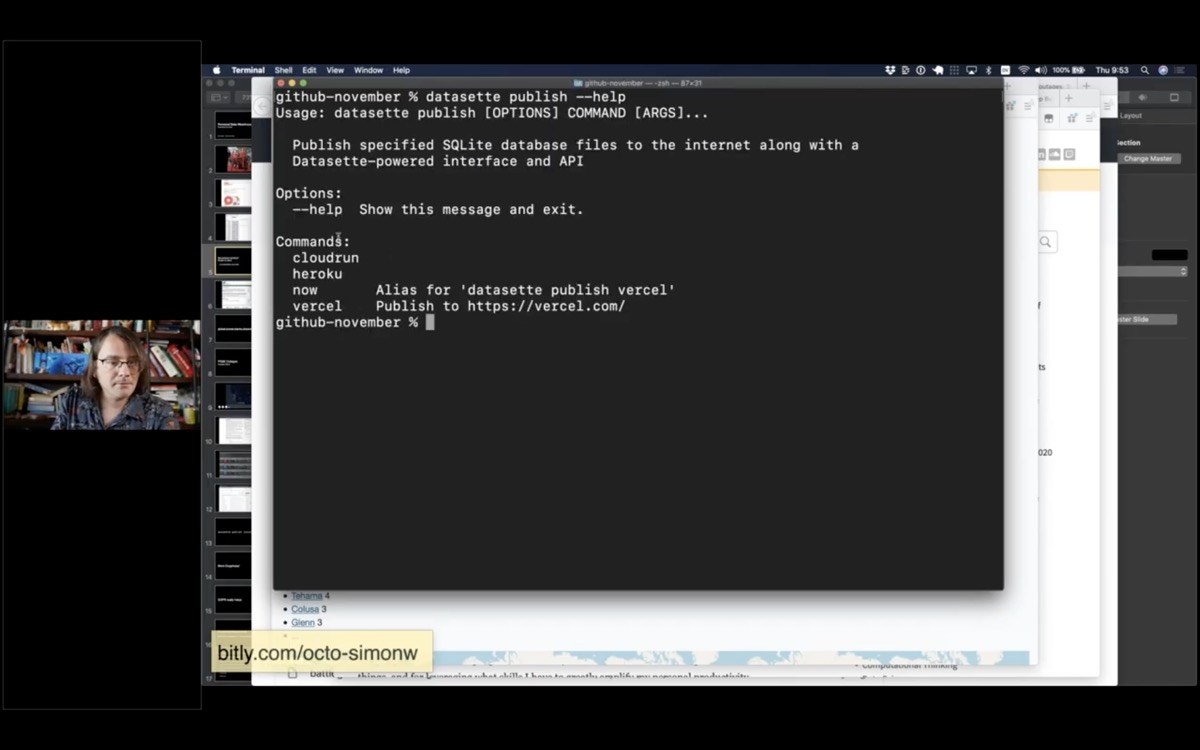
I’m going to take this a step further and put it on the internet, using a command called datasette publish.
Datasette publish supports a number of different hosting providers. I’m going to use Vercel.
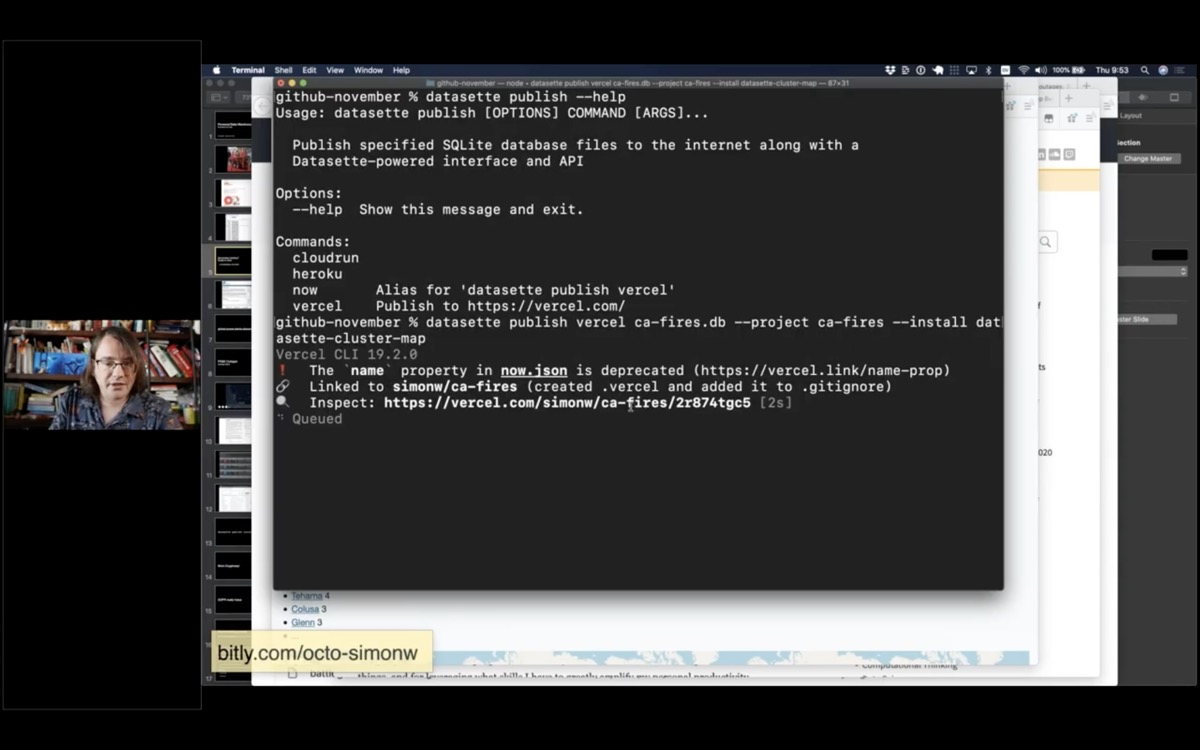
I’m going to tell it to publish that database to a project called “ca-fires”—and tell it to install the datasette-cluster-map plugin.
datasette publish vercel ca-fires.db \
        --project ca-fires \
        --install datasette-cluster-map
This then takes that database file, bundles it up with the Datasette application and deploys it to Vercel.
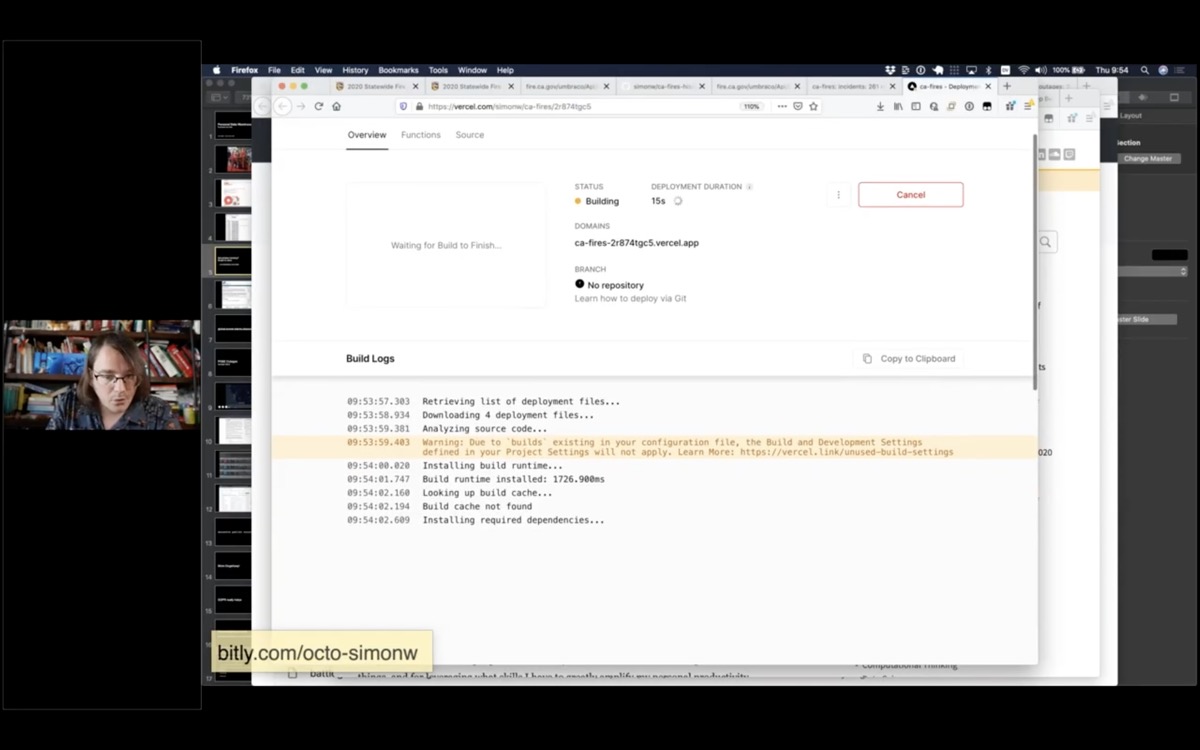
Vercel gives me a URL where I can watch the progress of the deploy.
The goal here is to have as few steps as possible between finding some interesting data, turning it into a SQLite database you can use with Datasette and then publishing it online.
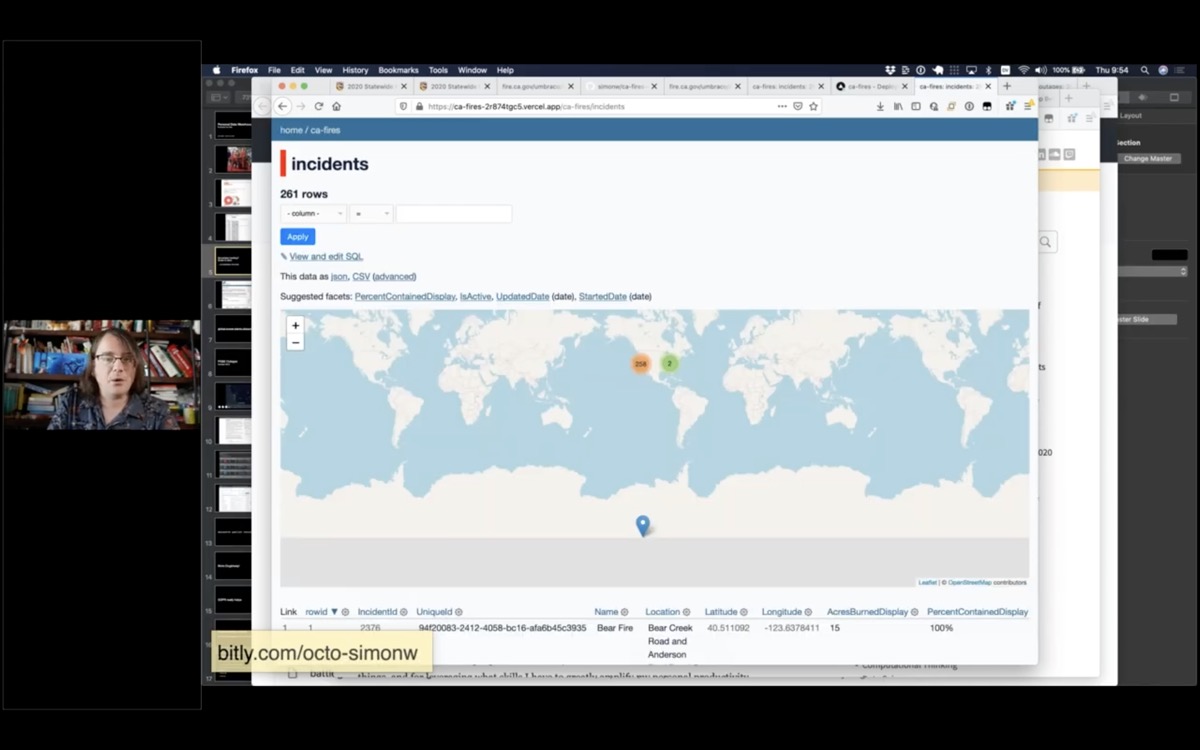
And this here is that database I just created—available for anyone on the internet to visit and build against.
I’ve given you a whistle-stop tour of Datasette for the purposes of publishing data, and hopefully doing some serious data journalism.
So what does this all have to do with personal data warehouses?
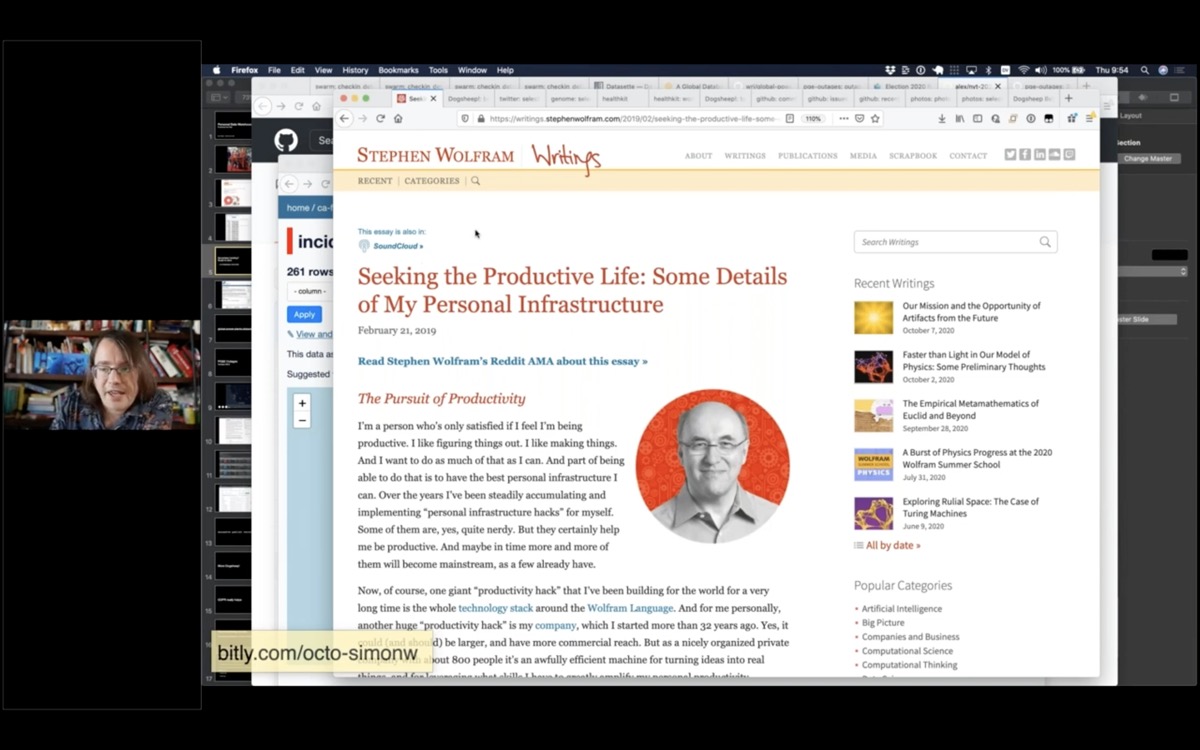
Last year, I read this essay by Stephen Wolfram: Seeking the Productive Life: Some Details of My Personal Infrastructure. It’s an incredible exploration of fourty years of productivity hacks that Stephen Wolfram has applied to become the CEO of a 1,000 person company that works remotely. He’s optimized every aspect of his professional and personal life.
It’s a lot.
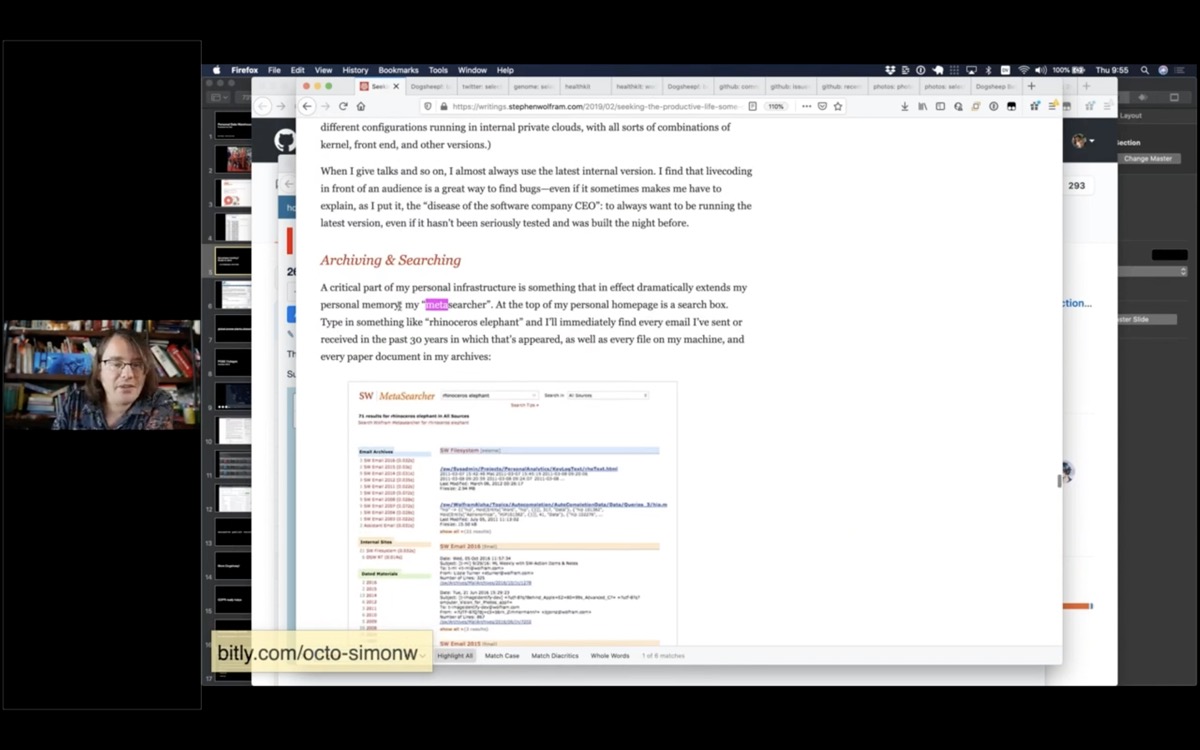
But there was one part of this that really caught my eye. He talks about a thing he calls a “metasearcher”—a search engine on his personal homepage that searches every email, journals, files, everything he’s ever done—all in one place.
And I thought to myself, I really want THAT. I love this idea of a personal portal to my own stuff.
And because it was inspired by Stephen Wolfram, but I was planning on building a much less impressive version, I decided to call it Dogsheep.
Wolf, ram. Dog, sheep.
I’ve been building this over the past year.
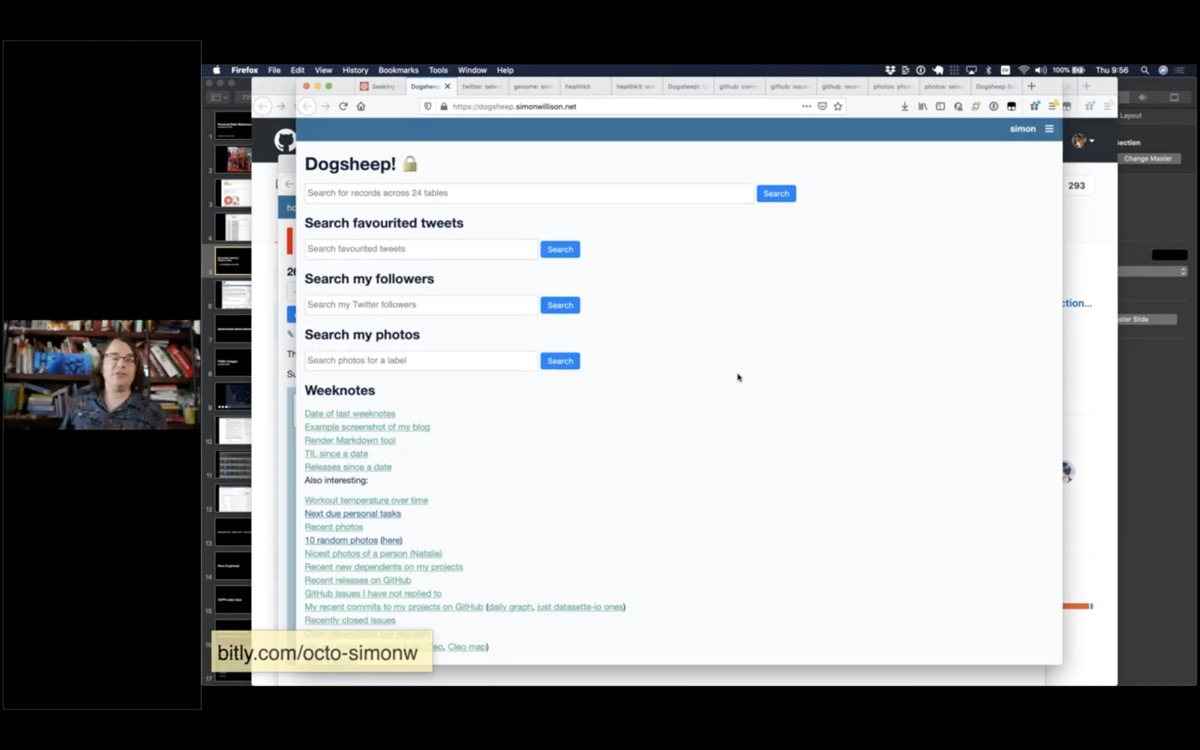
So essentially this is my personal data warehouse. It pulls in my personal data from as many sources as I can find and gives me an interface to browse that data and run queries against it.
I’ve got data from Twitter, Apple HealthKit, GitHub, Swarm, Hacker News, Photos, a copy of my genome... all sorts of things.
I’ll show a few more demos.
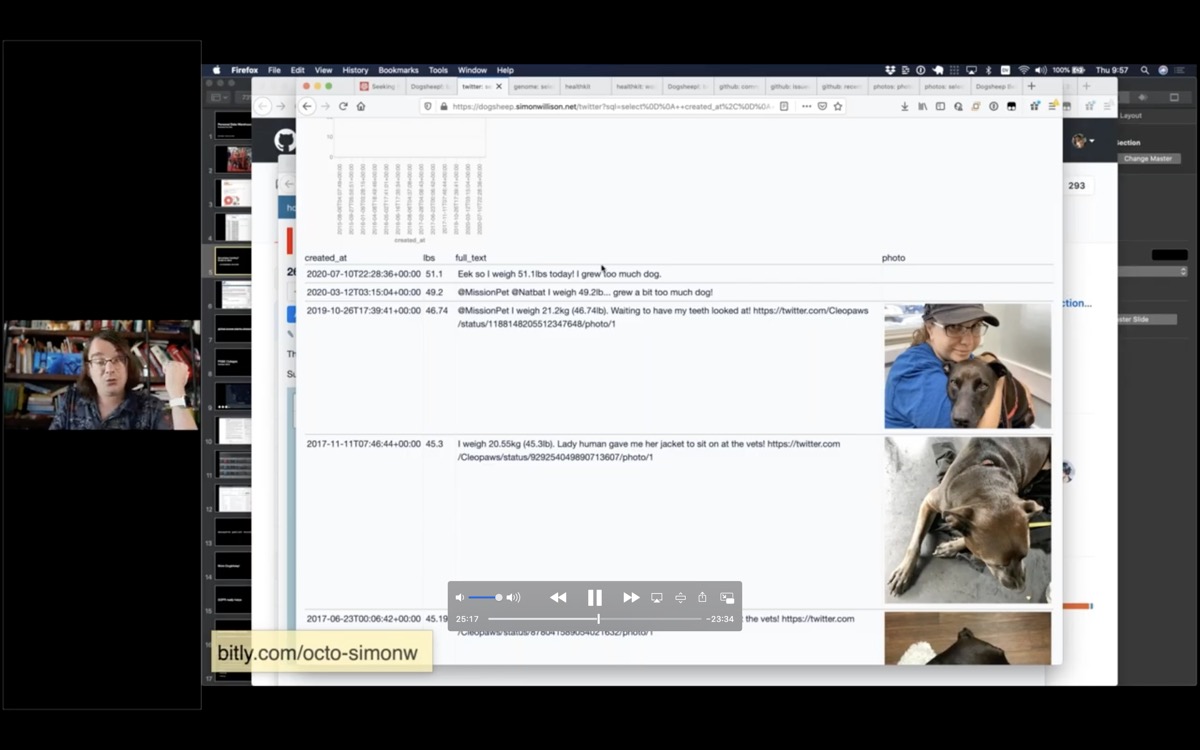
Here’s another one about Cleo. Cleo has a Twitter account, and every time she goes to the vet she posts a selfie and says how much she weighs.
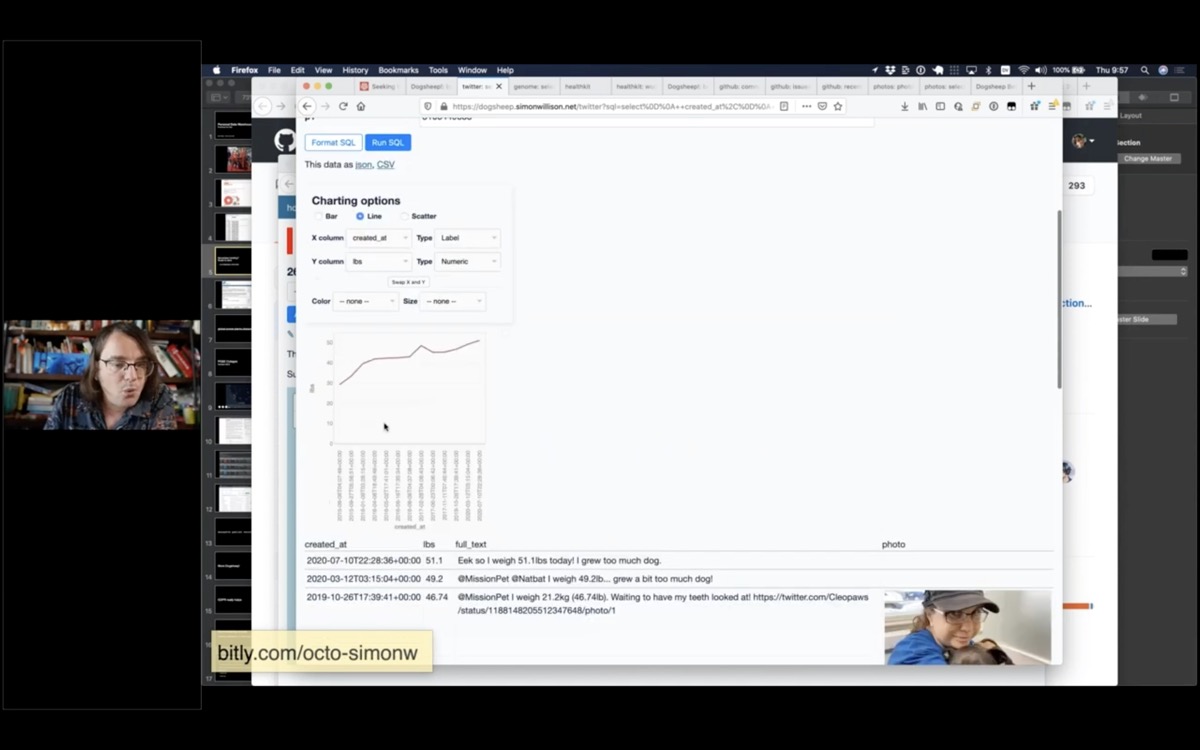
Here’s a SQL query that finds every tweet that mentions her weight, pulls out her weight in pounds using a regular expression, then uses the datasette-vega charting plugin to show a self-reported chart of her weight over time.
select
    created_at,
    regexp_match('.*?(\d+(\.\d+))lb.*', full_text, 1) as lbs,
    full_text,
    case
        when (media_url_https is not null)
        then json_object('img_src', media_url_https, 'width', 300)
    end as photo
    from
    tweets
    left join media_tweets on tweets.id = media_tweets.tweets_id
    left join media on media.id = media_tweets.media_id
    where
    full_text like '%lb%'
    and user = 3166449535
    and lbs is not null
    group by
    tweets.id
    order by
    created_at desc
    limit
    101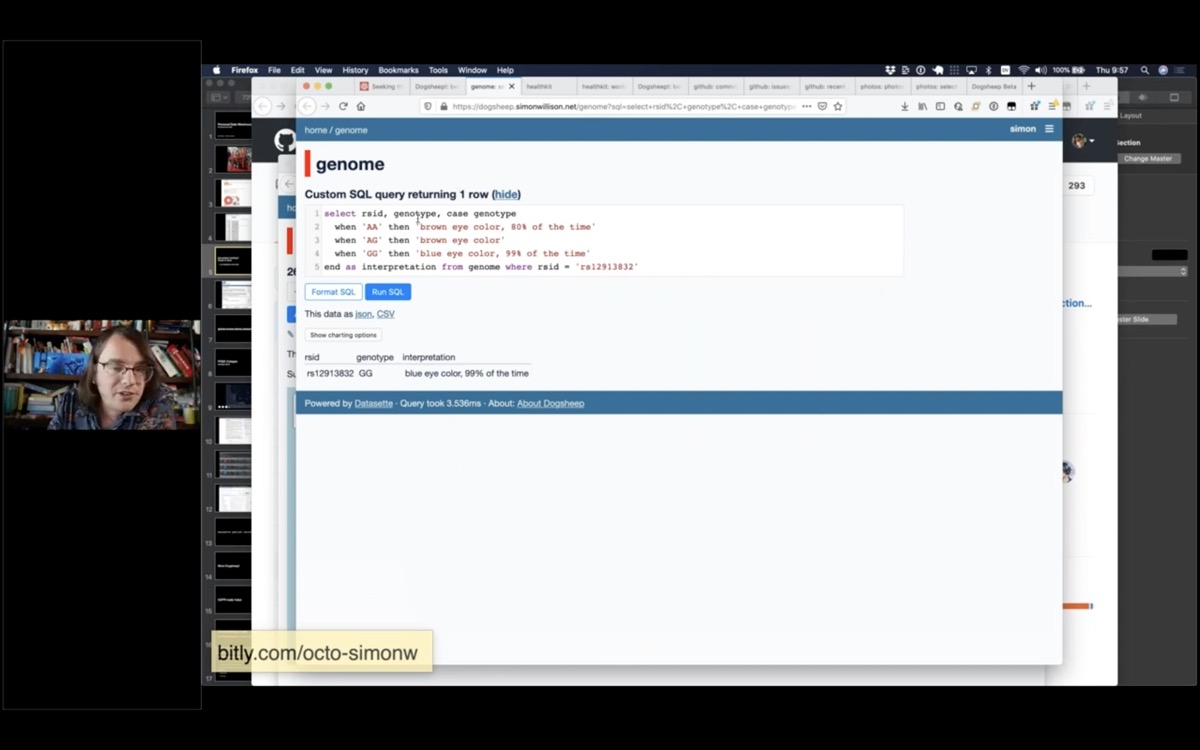
I did 23AndMe a few years ago, so I have a copy of my genome in Dogsheep. This SQL query tells me what colour my eyes are.
Apparently they are blue, 99% of the time.
select rsid, genotype, case genotype
    when 'AA' then 'brown eye color, 80% of the time'
    when 'AG' then 'brown eye color'
    when 'GG' then 'blue eye color, 99% of the time'
    end as interpretation from genome where rsid = 'rs12913832'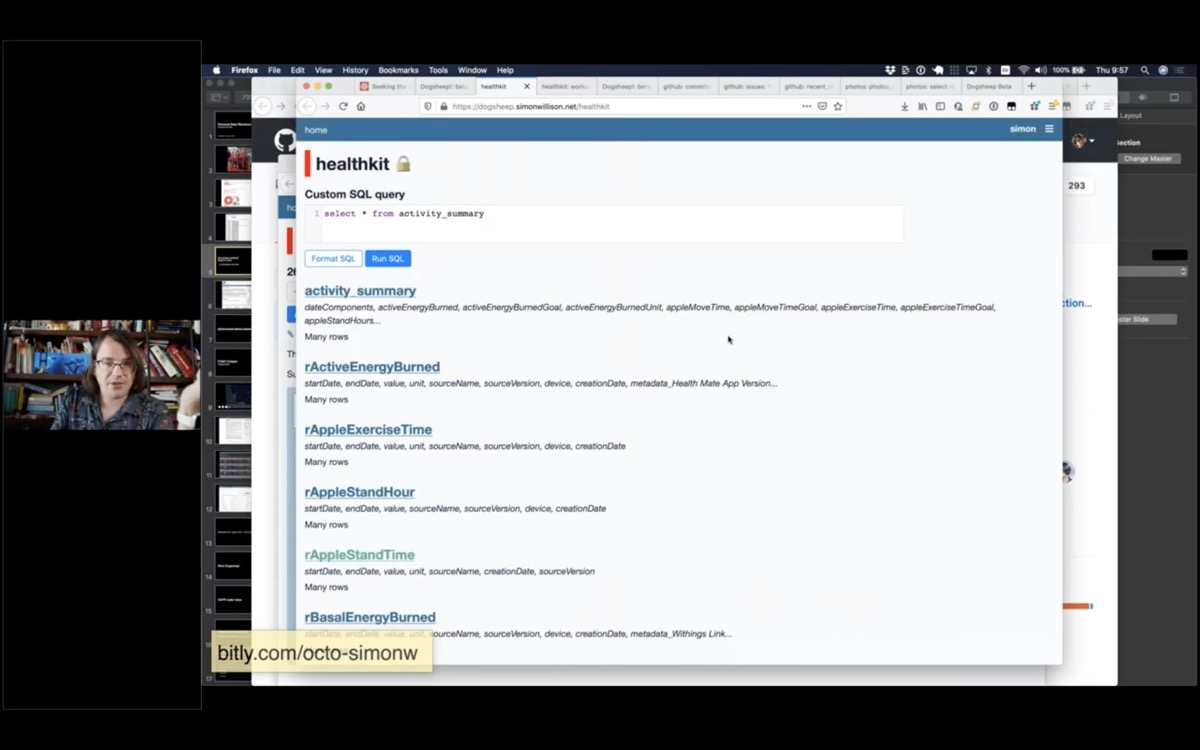
I have HealthKit data from my Apple Watch.
Something I really like about Apple’s approach to this stuff is that they don’t just upload all of your data to the cloud.
This data lives on your watch and on your phone, and there’s an option in the Health app on your phone to export it—as a zip file full of XML.
I wrote a script called healthkit-to-sqlite that converts that zip file into a SQLite database, and now I have tables for things like my basal energy burned, my body fat percentage, flights of stairs I’ve climbed.
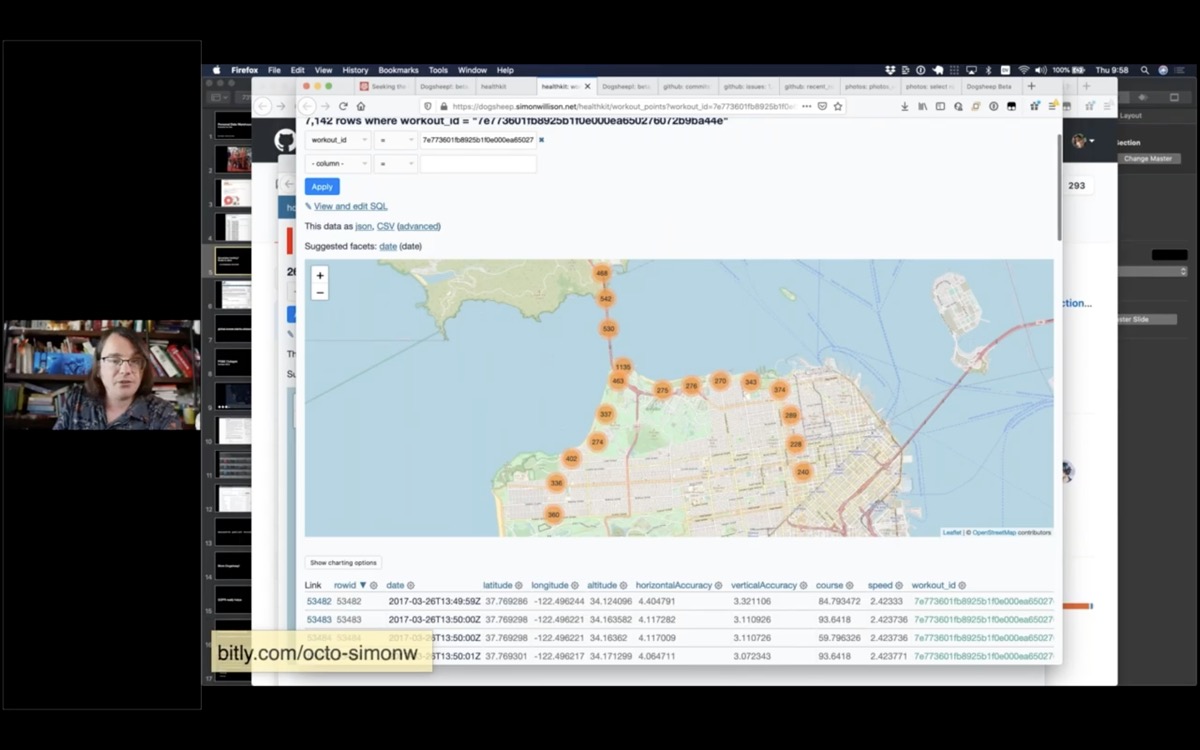
But the really fun part is that it turns out any time you track an outdoor workout on your Apple Watch it records your exact location every few seconds, and you can get that data back out again!
This is a map of my exact route for the San Francisco Half Marathon three years ago.
I’ve started tracking an “outdoor walk” every time I go on a walk now, just so I can get the GPS data out again later.
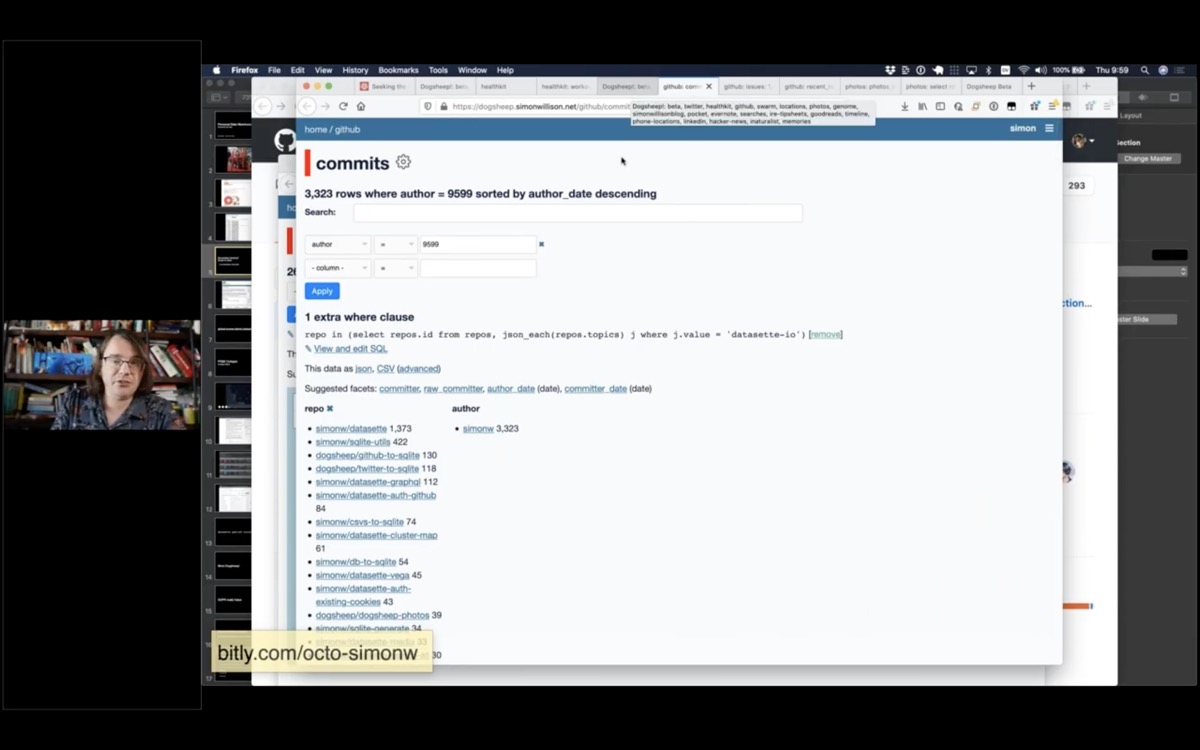
I have a lot of data from GitHub about my projects—all of my commits, issues, issue comments and releases—everything I can get out of the GitHub API using my github-to-sqlite tool.
So I can do things like see all of my commits across all of my projects, search and facet them.
I have a public demo of a subset of this data at github-to-sqlite.dogsheep.net.
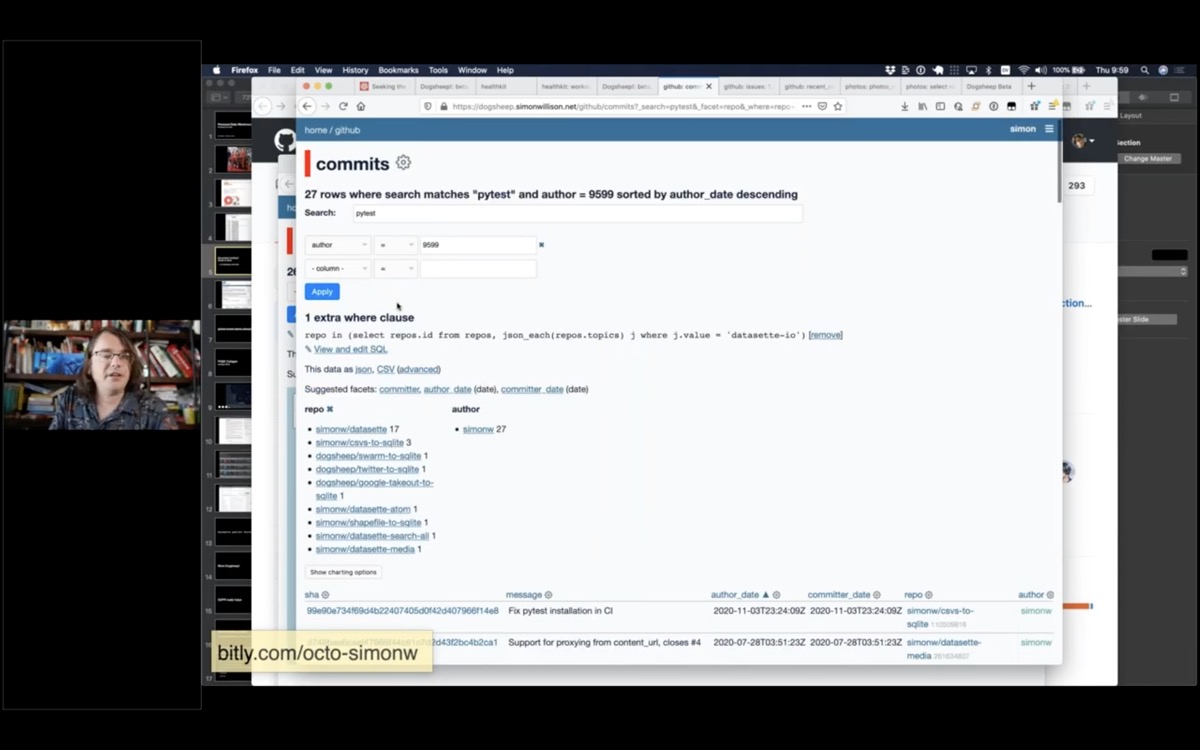
I can search my commits for any commit that mentions “pytest”.
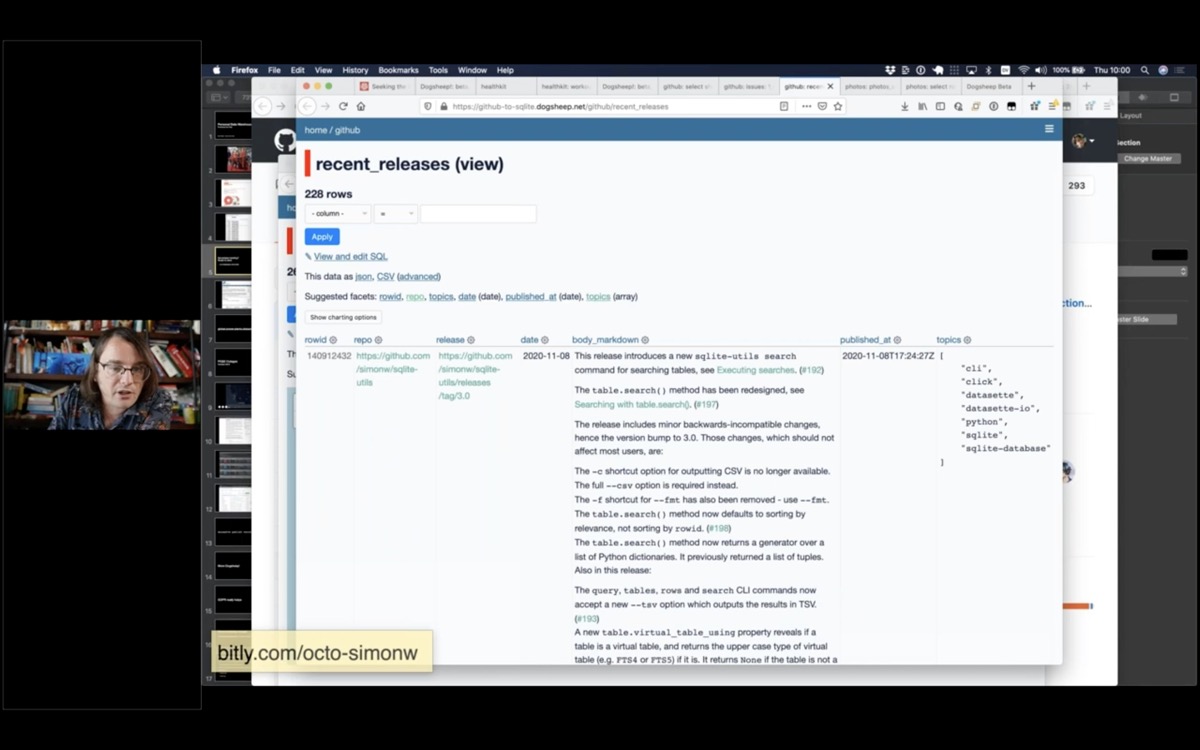
I have all of my releases, which is useful for when I write my weeknotes and want to figure out what I’ve been working on.
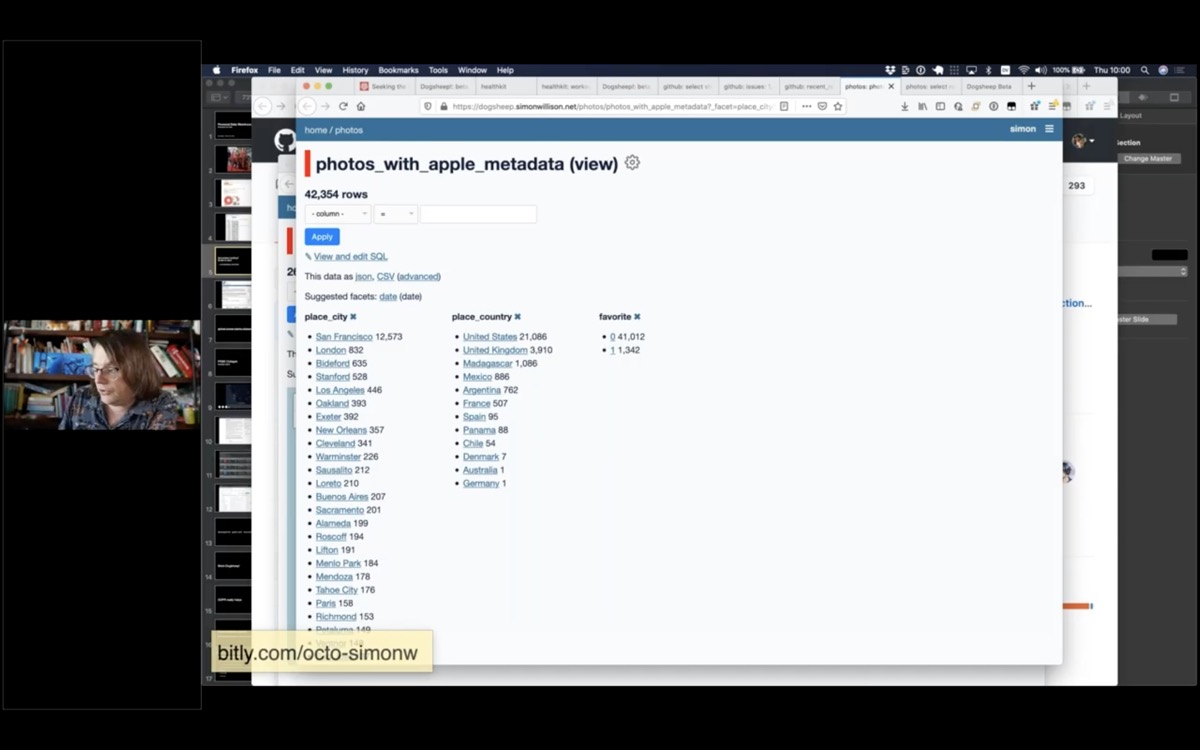
Apple Photos is a particularly interesting source of data.
It turns out the Apple Photos app uses a SQLite database, and if you know what you’re doing you can extract photo metadata from it.
They actually run machine learning models on your own device to figure out what your photos are of!
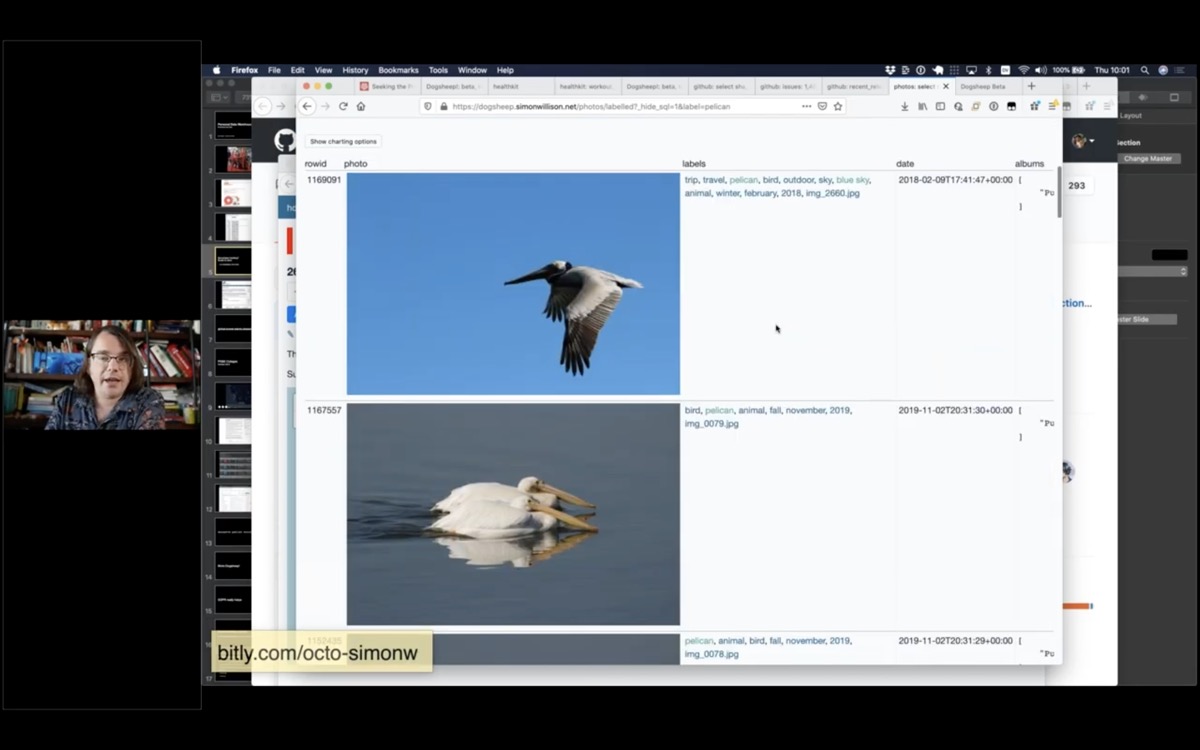
You can use the machine learning labels to see all of the photos you have taken of pelicans. Here are all of the photos I have taken that Apple Photos have identified as pelicans.
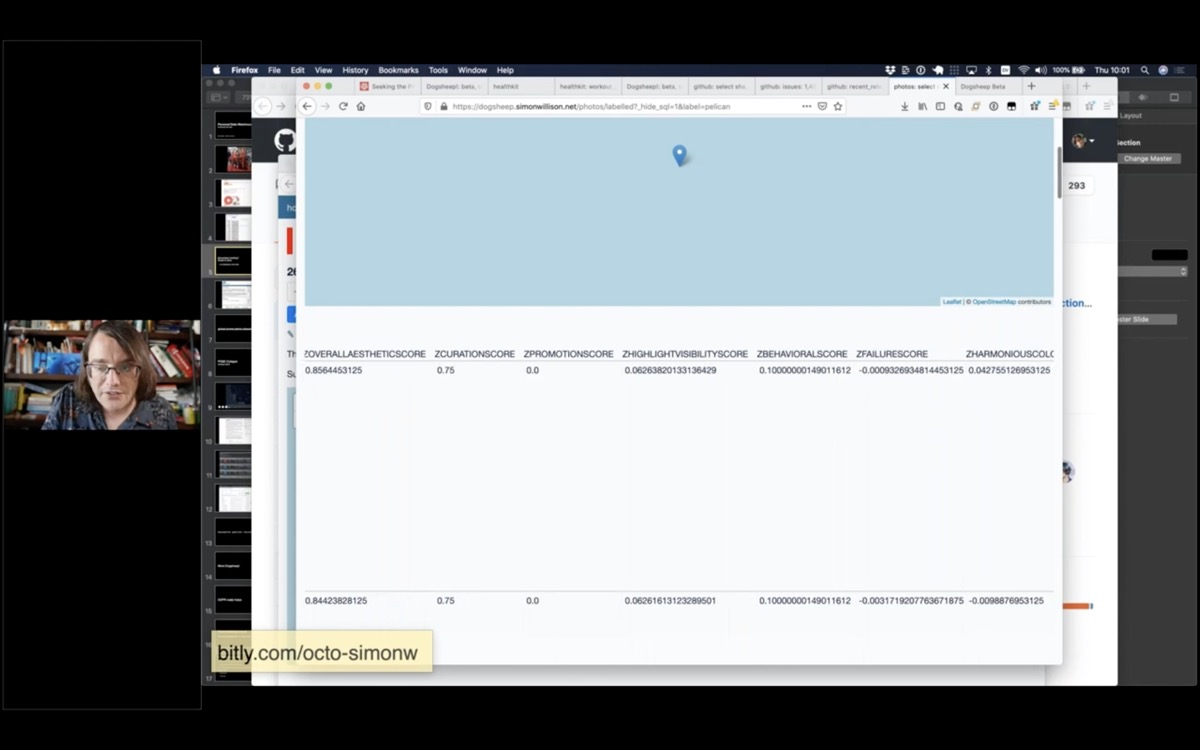
It also turns out they have columns called things like ZOVERALLAESTHETICSCORE, ZHARMONIOUSCOLORSCORE, ZPLEASANTCAMERATILTSCORE and more.
So I can sort my pelican photos with the most aesthetically pleasing first!
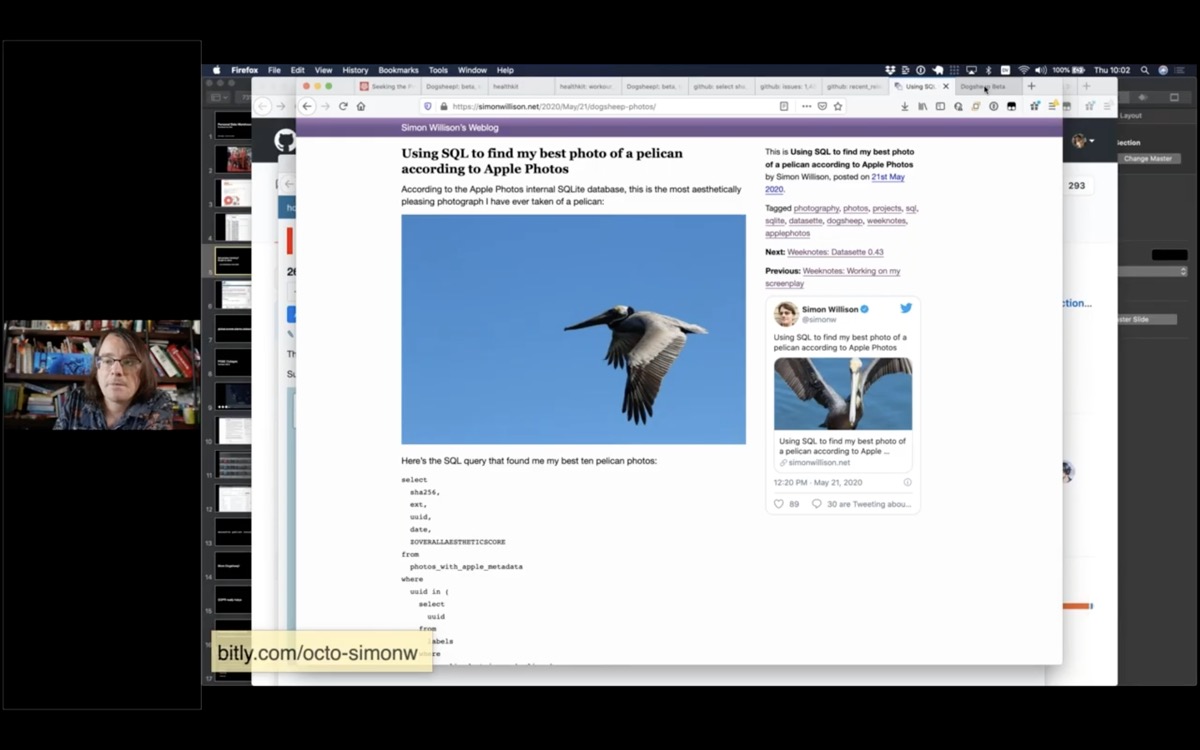
I wrote more about this on my blog; Using SQL to find my best photo of a pelican according to Apple Photos.
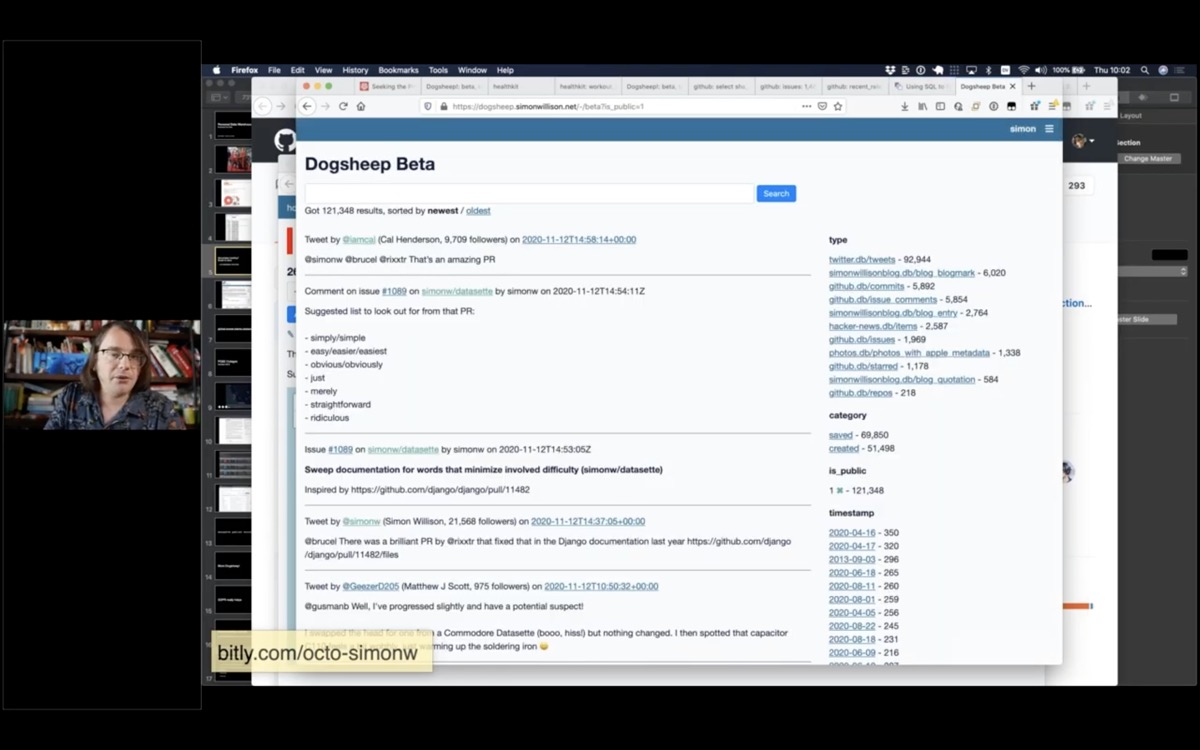
And a few weeks ago I finally got around to building the thing I’d always wanted: the search engine.
I called it Dogsheep Beta, because Stephen Wolfram has a search engine called Wolfram Alpha.
This is pun-driven development: I came up with this pun a while ago and liked it so much I committed to building the software.
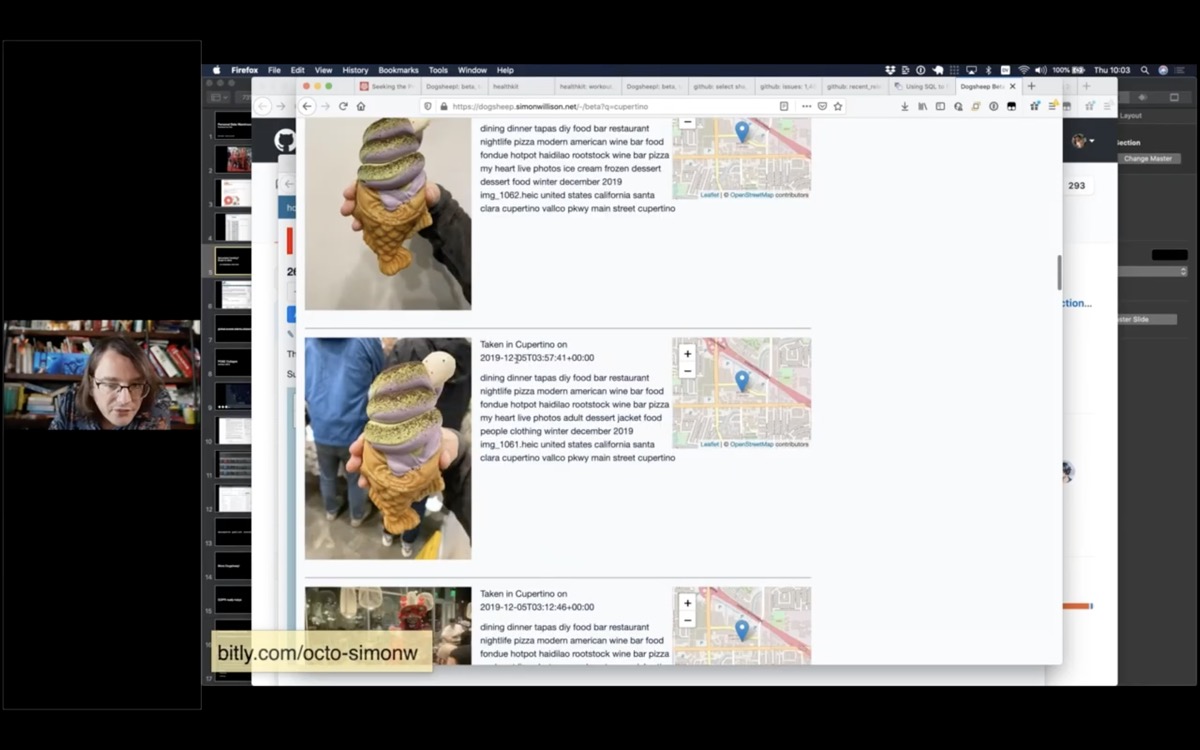
I wanted to know when the last time I had eaten a waffle-fish ice cream was. I knew it was in Cupertino, so I searched Dogsheep Beta for Cupertino and found this photo.
I hope this illustrates how much you can do if you pull all of your personal data into one place!
The GDPR law that passed in Europe a few years ago really helps with this stuff.
Companies have to provide you with access to the data that they store about you.
Many big internet companies have responded to this by providing a self-service export feature, usually buried somewhere in the settings.
You can also request data directly from companies, but the self-service option helps them keep their customer support costs down.
This stuff becomes easier over time as more companies build out these features.
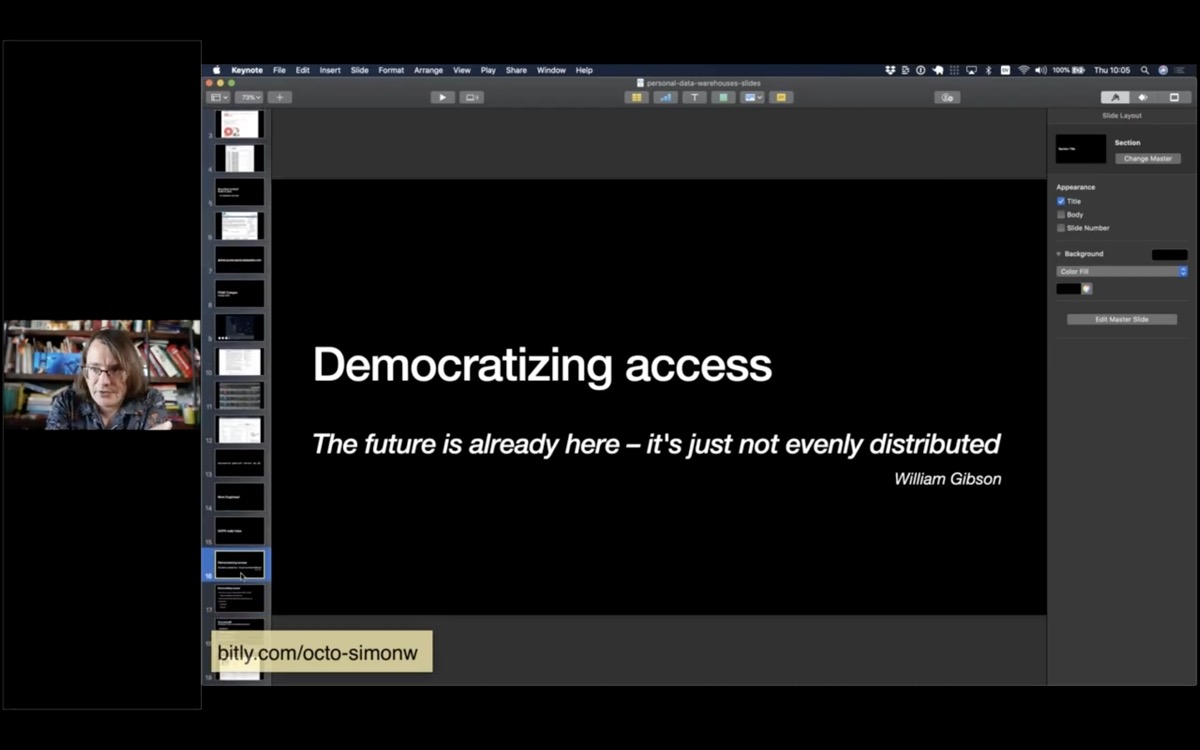
The other challenge is how we democratize access to this.
Everything I’ve shown you today is open source: you can install this software and use it yourself, for free.
But there’s a lot of assembly required. You need to figure out authentication tokens, find somewhere to host it, set up cron jobs and authentication.
But this should be accessible to regular non-uber-nerd humans!
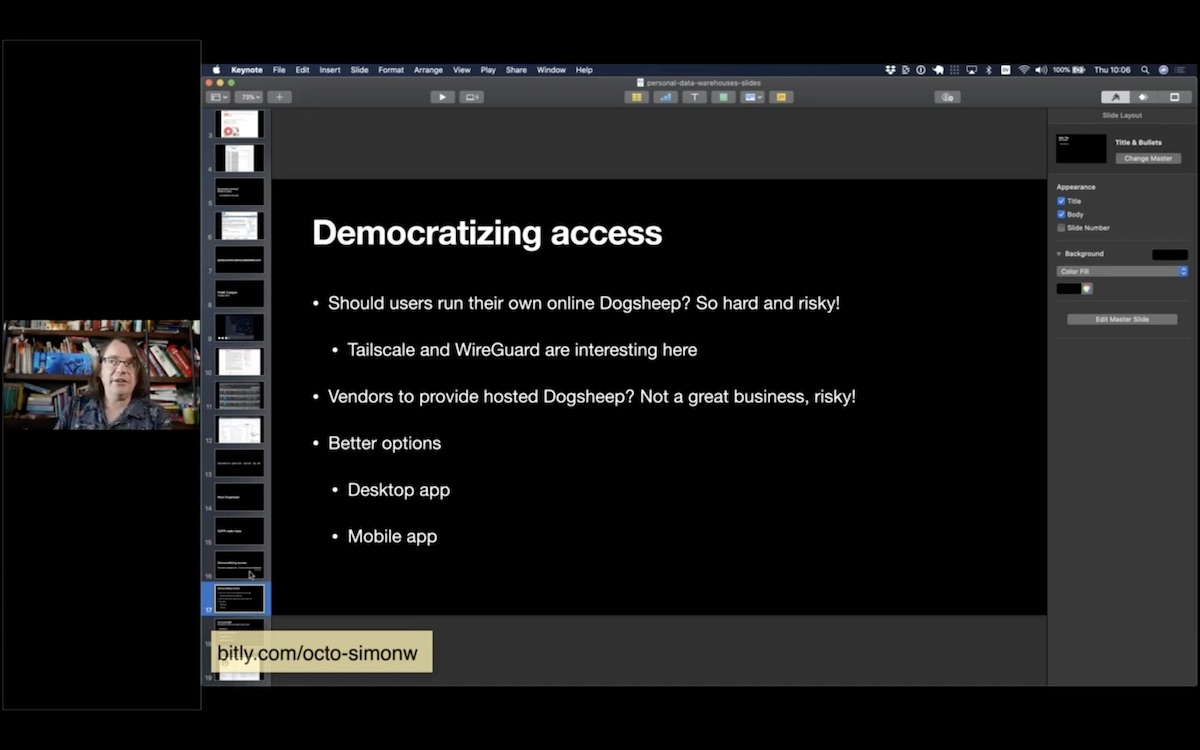
Expecting regular humans to run a secure web server somewhere is pretty terrifying. I’ve been looking at WireGuard and Tailscale to help make secure access between devices easier, but that’s still very much for super-users only.
Running this as a hosted service doesn’t appeal: taking responsibility for people’s personal data is scary, and it’s probably not a great business.
I think the best options are to run on people’s own personal devices—their mobile phones and their laptops. I think it’s feasible to get Datasette running in those environments, and I really like the idea of users being able to import their personal data onto a device that they control and analyzing it there.
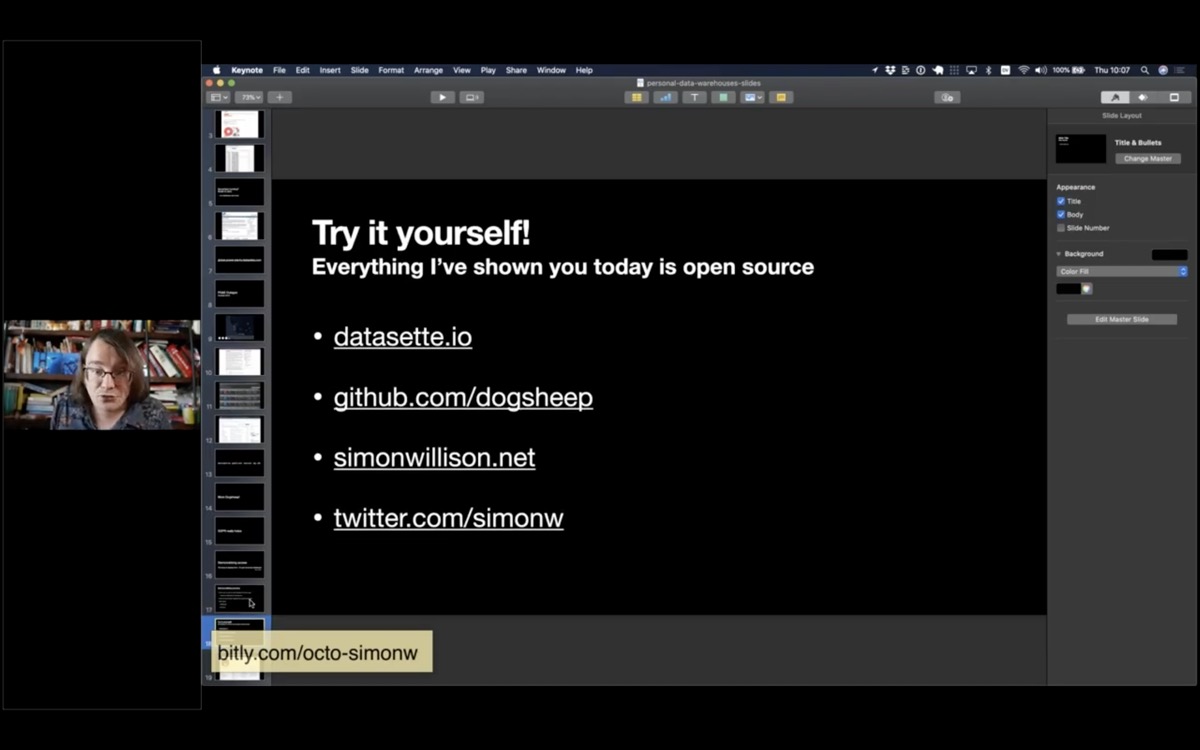
I invite you to try this all out for yourself!
datasette.io for Datasette
github.com/dogsheep and dogsheep.github.io for Dogsheep
simonwillison.net is my personal blog
twitter.com/simonw is my Twitter account
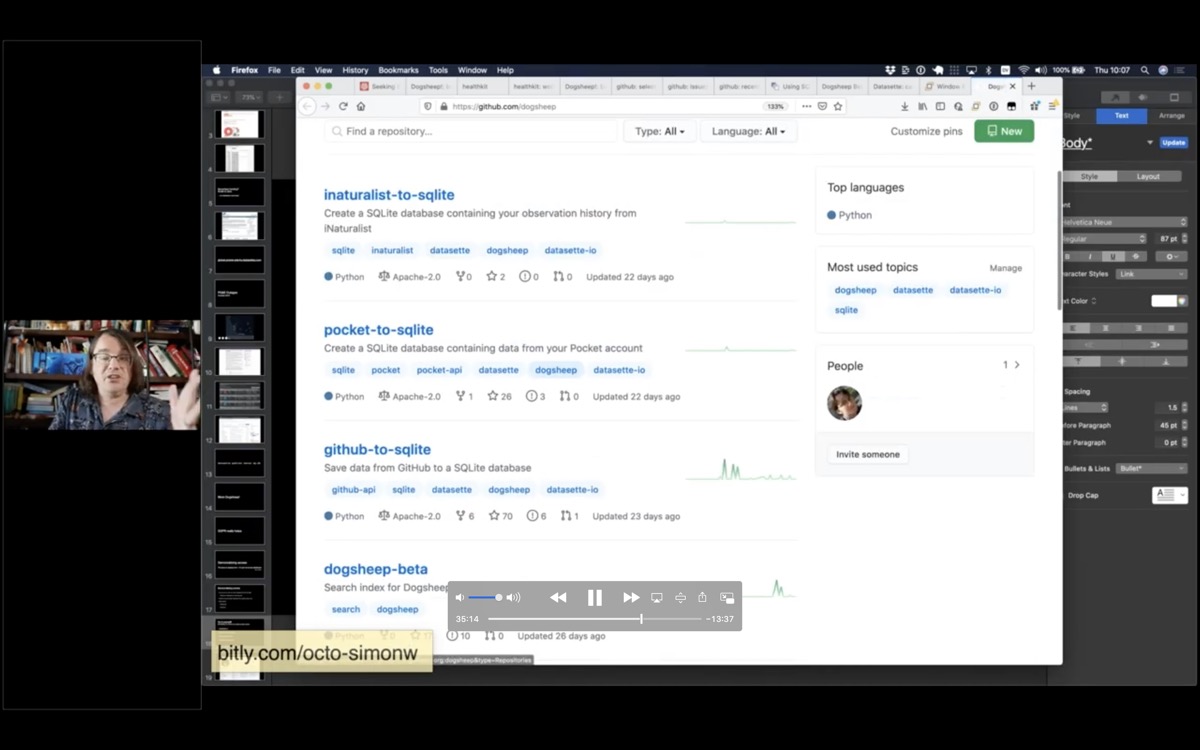
The Dogsheep GitHub organization has most of the tools that I’ve used to build out my personal Dogsheep warehouse—many of them using the naming convention of something-to-sqlite.
Q&A, from this Google Doc
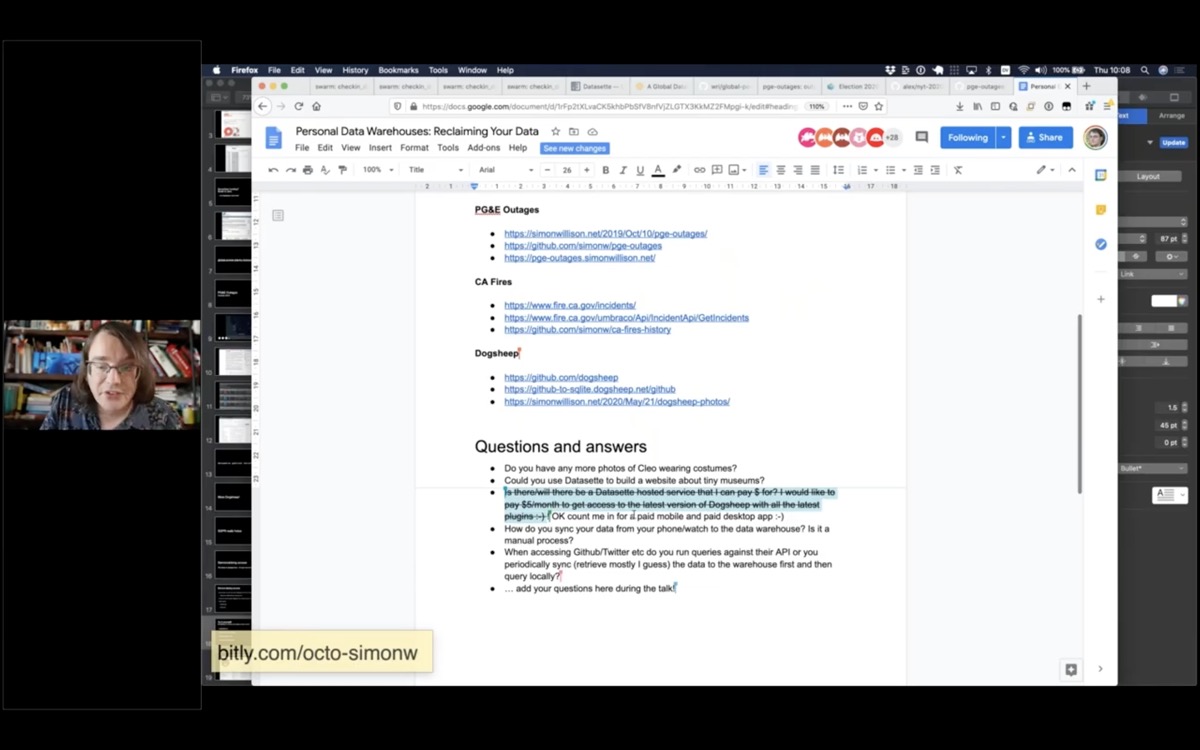
Q: Is there/will there be a Datasette hosted service that I can pay $ for? I would like to pay $5/month to get access to the latest version of Dogsheep with all the latest plugins!
I don’t want to build a hosting site for personal private data because I think people should stay in control of that themselves, plus I don’t think there’s a particularly good business model for that.
Instead, I’m building a hosted service for Datasette (called Datasette Cloud) which is aimed at companies and organizations. I want to be able to provide newsrooms and other groups with a private, secure, hosted environment where they can share data with each other and run analysis.
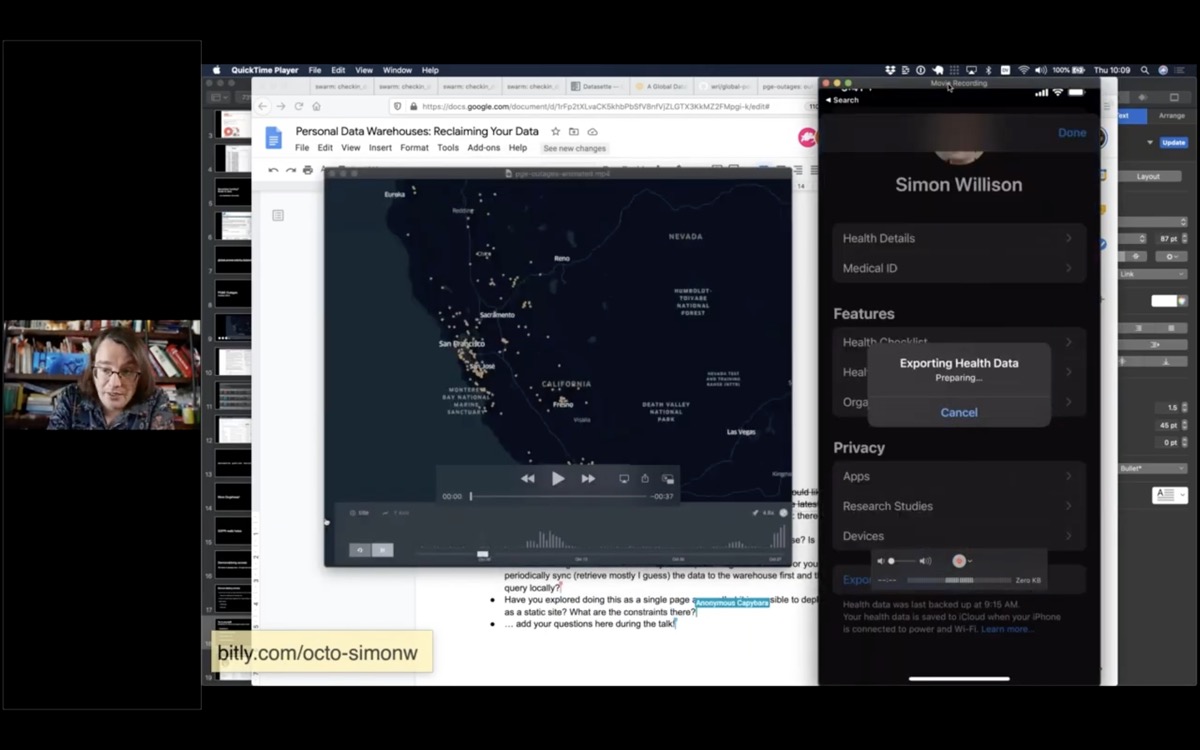
Q: How do you sync your data from your phone/watch to the data warehouse? Is it a manual process?
The health data is manual: the iOS Health app has an export button which generates a zip file of XML which you can then AirDrop to a laptop. I then run my healthkit-to-sqlite script against it to generate the DB file and SCP that to my Dogsheep server.
Many of my other Dogsheep tools use APIs and can run on cron, to fetch the most recent data from Swarm and Twitter and GitHub and so on.
Q: When accessing Github/Twitter etc do you run queries against their API or you periodically sync (retrieve mostly I guess) the data to the warehouse first and then query locally?
I always try to get ALL the data so I can query it locally. The problem with APIs that let you run queries is that inevitably there’s something I want to do that can’t be done of the API—so I’d much rather suck everything down into my own database so I can write my own SQL queries.
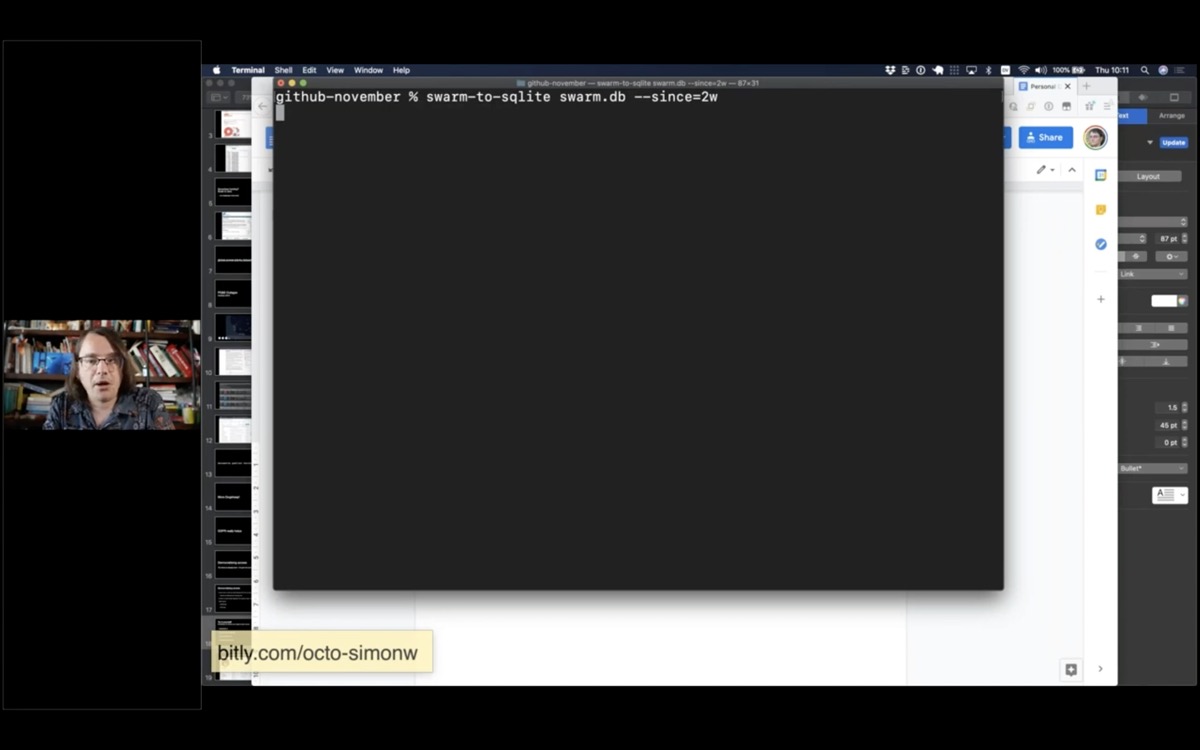
Here’s an example of my swarm-to-sqlite script, pulling in just checkins from the past two weeks (using authentication credentials from an environment variable).
swarm-to-sqlite swarm.db --since=2wHere’s a redacted copy of my Dogsheep crontab.
Q: Have you explored doing this as a single page app so that it is possible to deploy this as a static site? What are the constraints there?
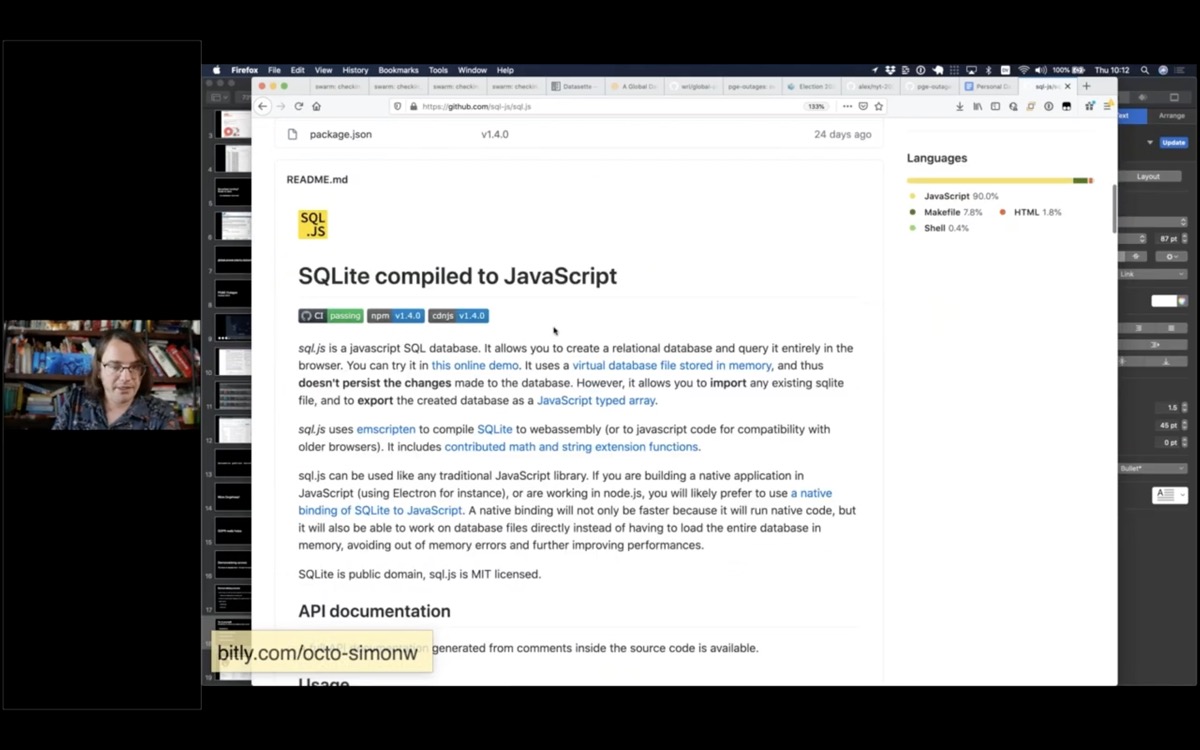
It’s actually possible to query SQLite databases entirely within client-side JavaScript using SQL.js (SQLite compiled to WebAssembly)
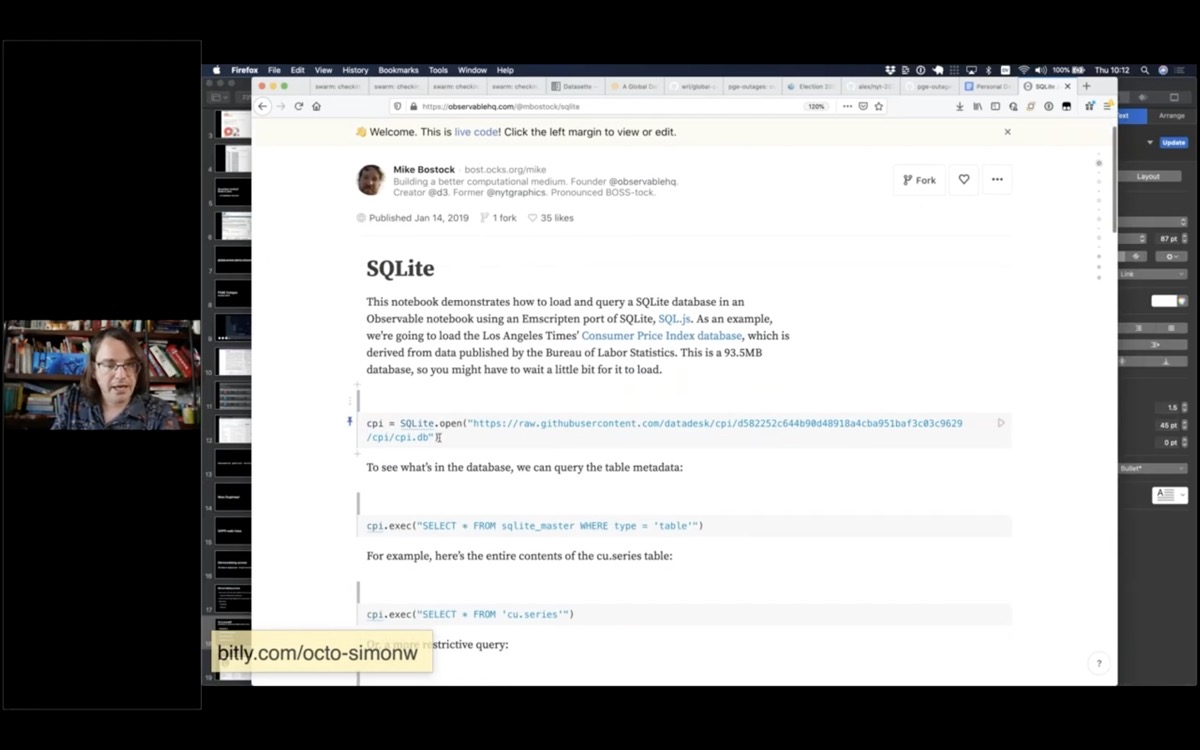
This Observable notebook is an example that uses this to run SQL queries against a SQLite database file loaded from a URL.
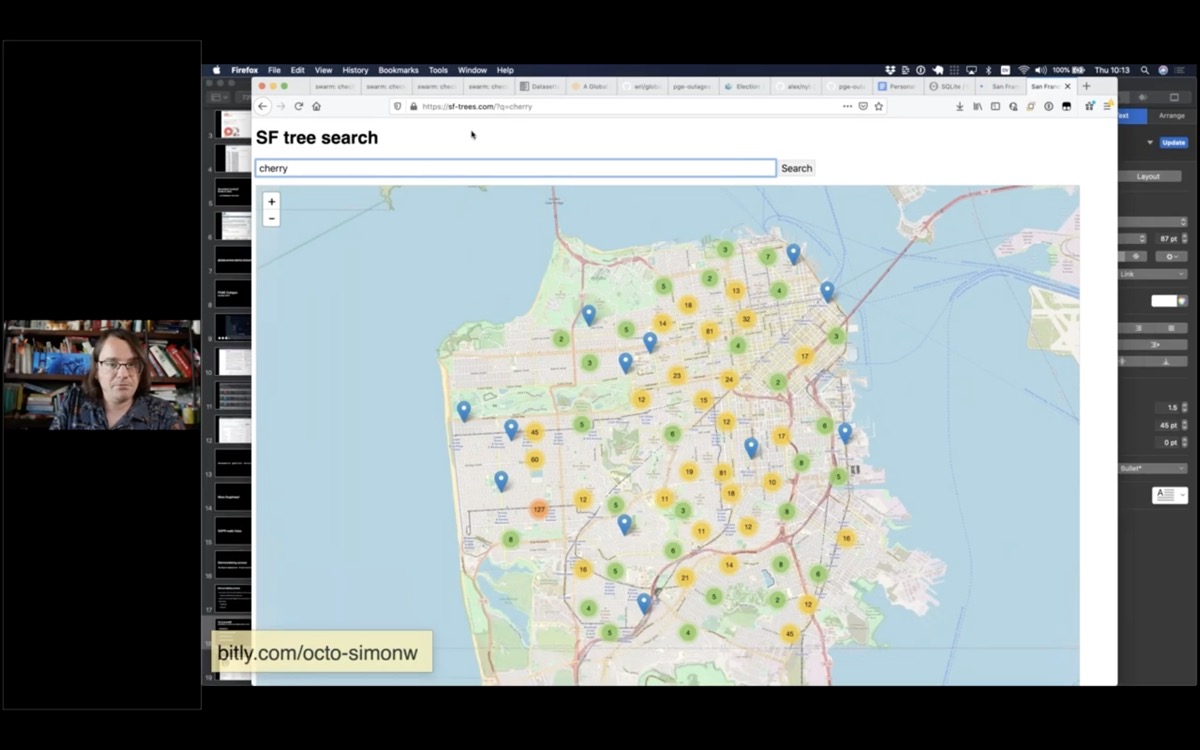
Datasette’s JSON and GraphQL APIs mean it can easily act as an API backend to SPAs
I built this site to offer a search engine for trees in San Francisco. View source to see how it hits a Datasette API in the background: https://sf-trees.com/?q=palm
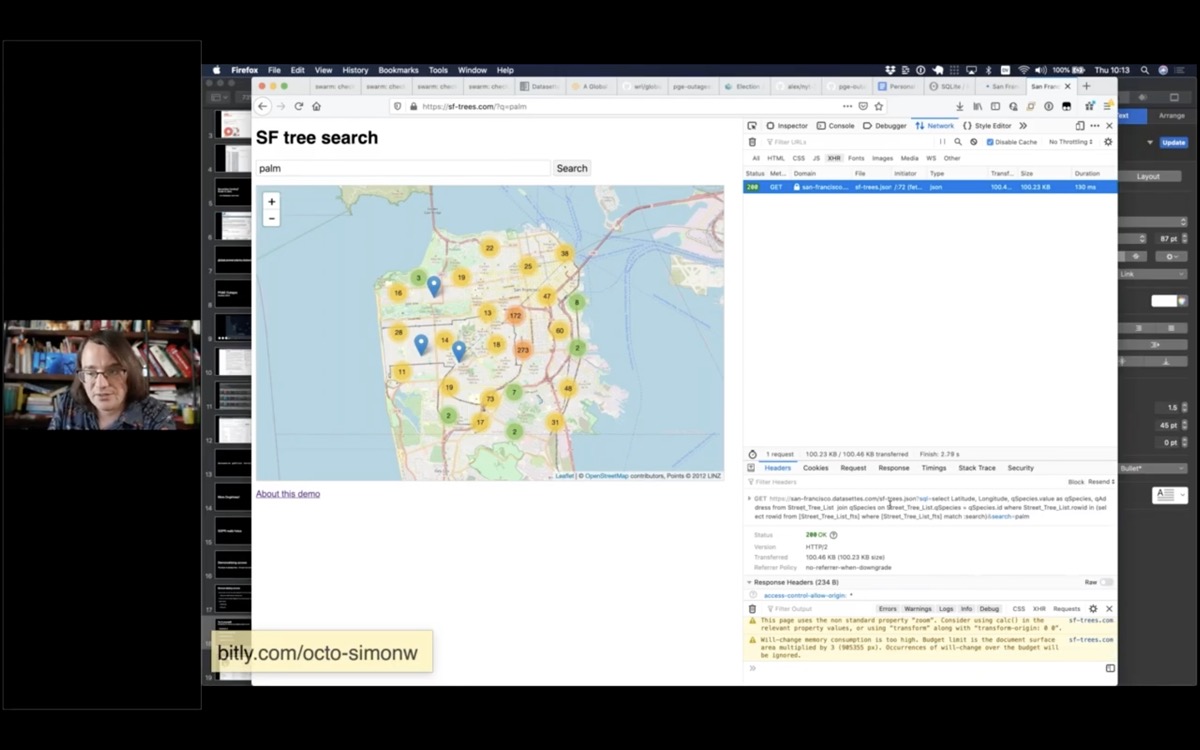
You can use the network pane to see that it’s running queries against a Datasette backend.
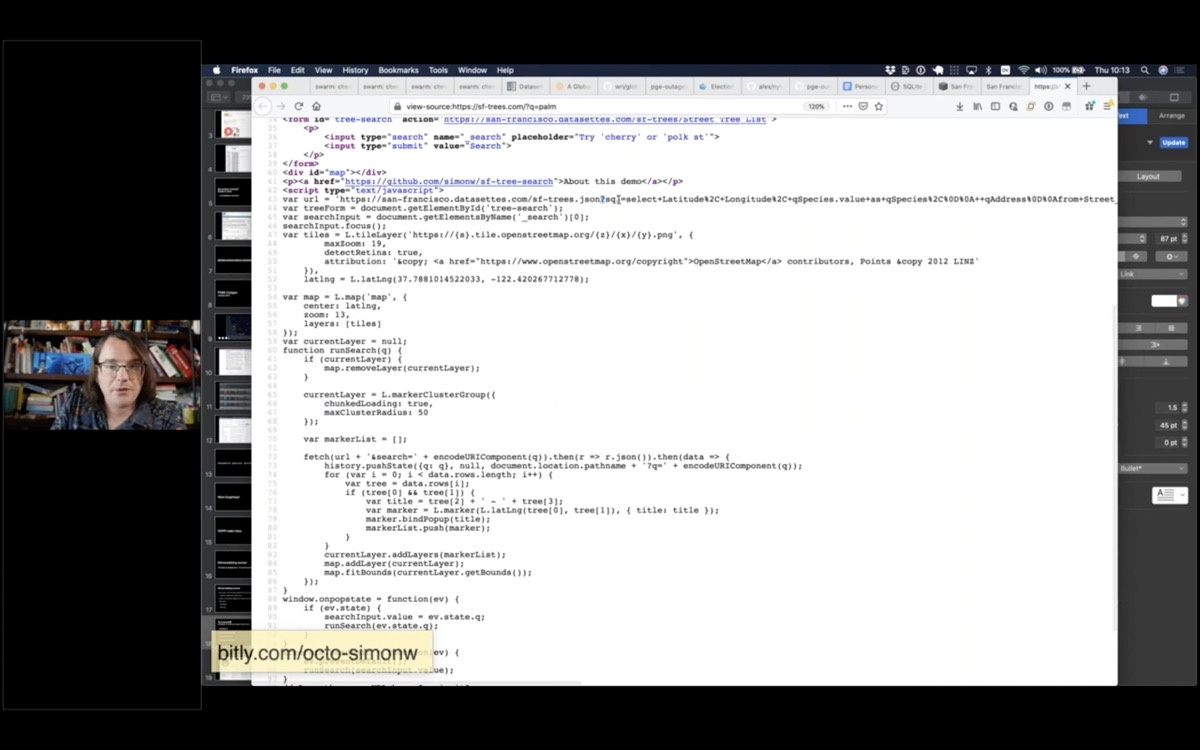
Here’s the JavaScript code which calls the API.
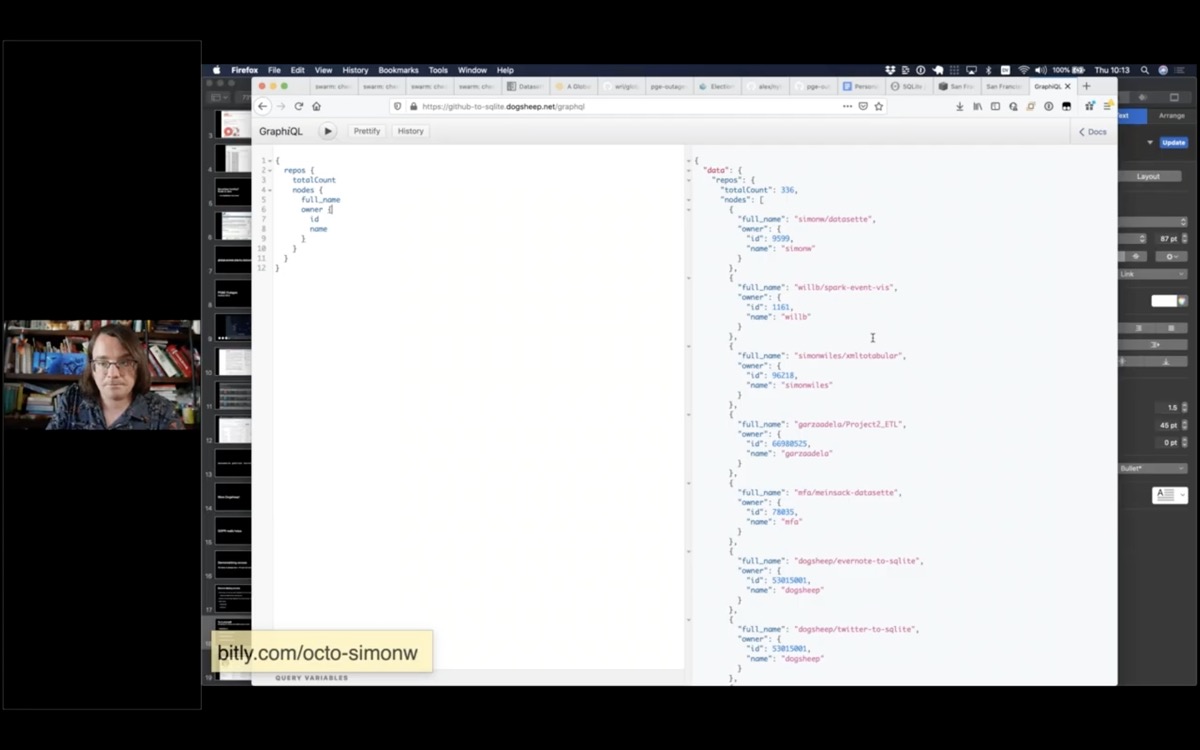
This demo shows Datasette’s GraphQL plugin in action.
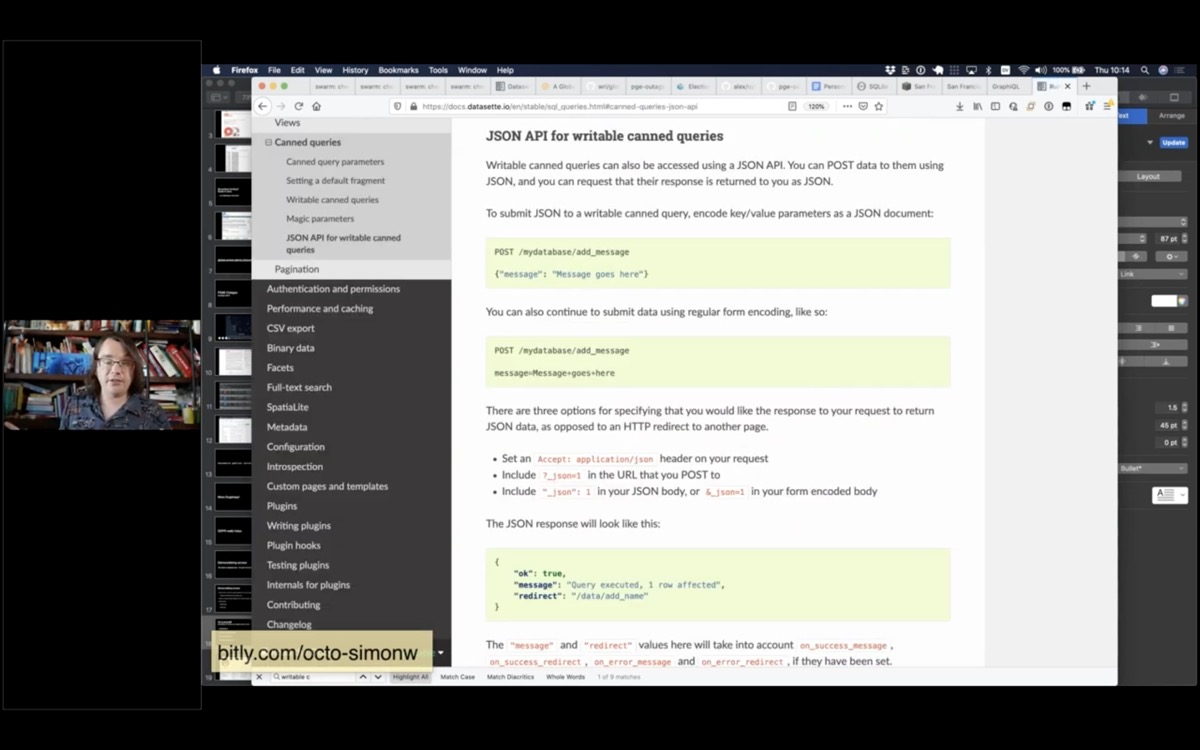
Q: What possibilities for data entry tools do the writable canned queries open up?
Writable canned queries are a relatively recent Datasette feature that allow administrators to configure a UPDATE/INSERT/DELETE query that can be called by users filling in forms or accessed via a JSON API.
The idea is to make it easy to build backends that handle simple data entry in addition to serving read-only queries. It’s a feature with a lot of potential but so far I’ve not used it for anything significant.
Currently it can generate a VERY basic form (with single-line input values, similar to this search example) but I hope to expand it in the future to support custom form widgets via plugins for things like dates, map locations or autocomplete against other tables.
Q: For the local version where you had a 1-line push to deploy a new datasette: how do you handle updates? Is there a similar 1-line update to update an existing deployed datasette?
I deploy a brand new installation every time the data changes! This works great for data that only changes a few times a day. If I have a project that changes multiple times an hour I’ll run it as a regular VPS instead rather than use a serverless hosting provider.
Recent articles
- Moltbook is the most interesting place on the internet right now - 30th January 2026
- Adding dynamic features to an aggressively cached website - 28th January 2026
- ChatGPT Containers can now run bash, pip/npm install packages, and download files - 26th January 2026