3 posts tagged “charting”
2026
Two new Showboat tools: Chartroom and datasette-showboat
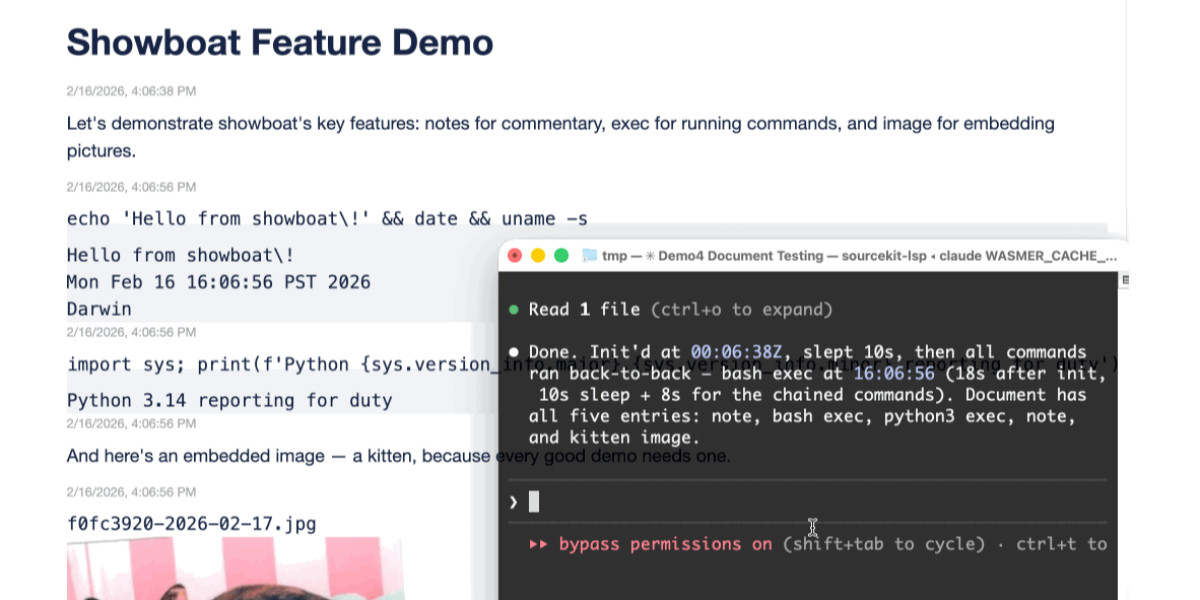
I introduced Showboat a week ago—my CLI tool that helps coding agents create Markdown documents that demonstrate the code that they have created. I’ve been finding new ways to use it on a daily basis, and I’ve just released two new tools to help get the best out of the Showboat pattern. Chartroom is a CLI charting tool that works well with Showboat, and datasette-showboat lets Showboat’s new remote publishing feature incrementally push documents to a Datasette instance.
[... 1,756 words]2019
μPlot (via) “An exceptionally fast, tiny time series chart. [...] from a cold start it can create an interactive chart containing 150,000 data points in 40ms. [...] at < 10 KB, it’s likely the smallest and fastest time series plotter that doesn’t make use of WebGL shaders or WASM”
2007
Google Chart API (via) Really neat charting API from Google—simply encode your chart data and configuration options in to a URL and Google will serve up a nicely rendered PNG. No API key required. It’s like a documented version of the Google Groups rounded corners API.