How Does A Blind Model See The Earth? (via) Fun, creative new micro-eval. Split the world into a sampled collection of latitude longitude points and for each one ask a model:
If this location is over land, say 'Land'. If this location is over water, say 'Water'. Do not say anything else.
Author henry goes a step further: for models that expose logprobs they use the relative probability scores of Land or Water to get a confidence level, for other models they prompt four times at temperature 1 to get a score.
And then.. they plot those probabilities on a chart! Here's Gemini 2.5 Flash (one of the better results):
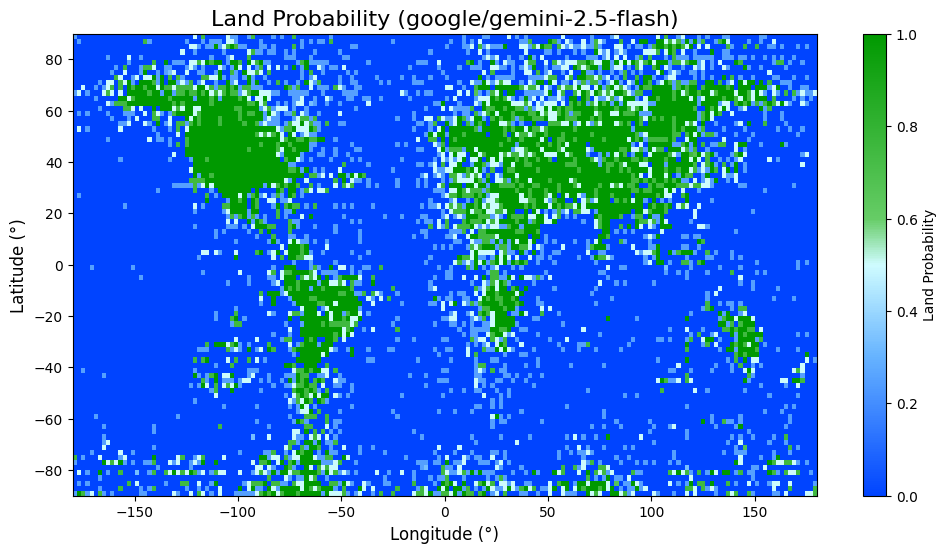
This reminds me of my pelican riding a bicycle benchmark in that it gives you an instant visual representation that's very easy to compare between different models.
Recent articles
- Introducing gisthost.github.io - 1st January 2026
- 2025: The year in LLMs - 31st December 2025
- How Rob Pike got spammed with an AI slop "act of kindness" - 26th December 2025