21st August 2021
TIL
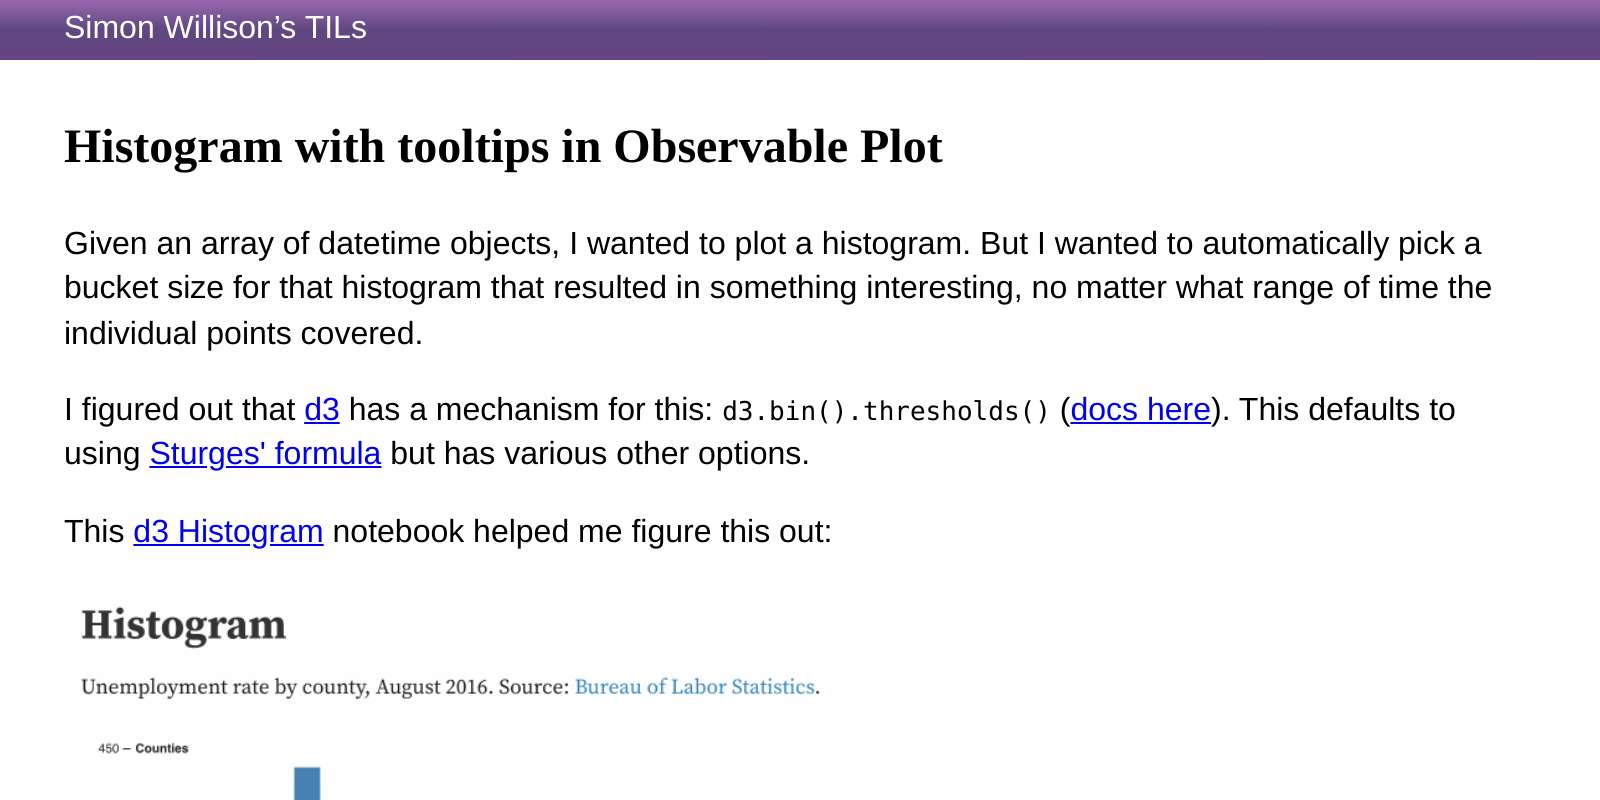
Histogram with tooltips in Observable Plot
— Given an array of datetime objects, I wanted to plot a histogram. But I wanted to automatically pick a bucket size for that histogram that resulted in something interesting, no matter what range of time the individual points covered.
Recent articles
- Highlights from my conversation about agentic engineering on Lenny's Podcast - 2nd April 2026
- Mr. Chatterbox is a (weak) Victorian-era ethically trained model you can run on your own computer - 30th March 2026
- Vibe coding SwiftUI apps is a lot of fun - 27th March 2026