21st August 2021
TIL
Histogram with tooltips in Observable Plot
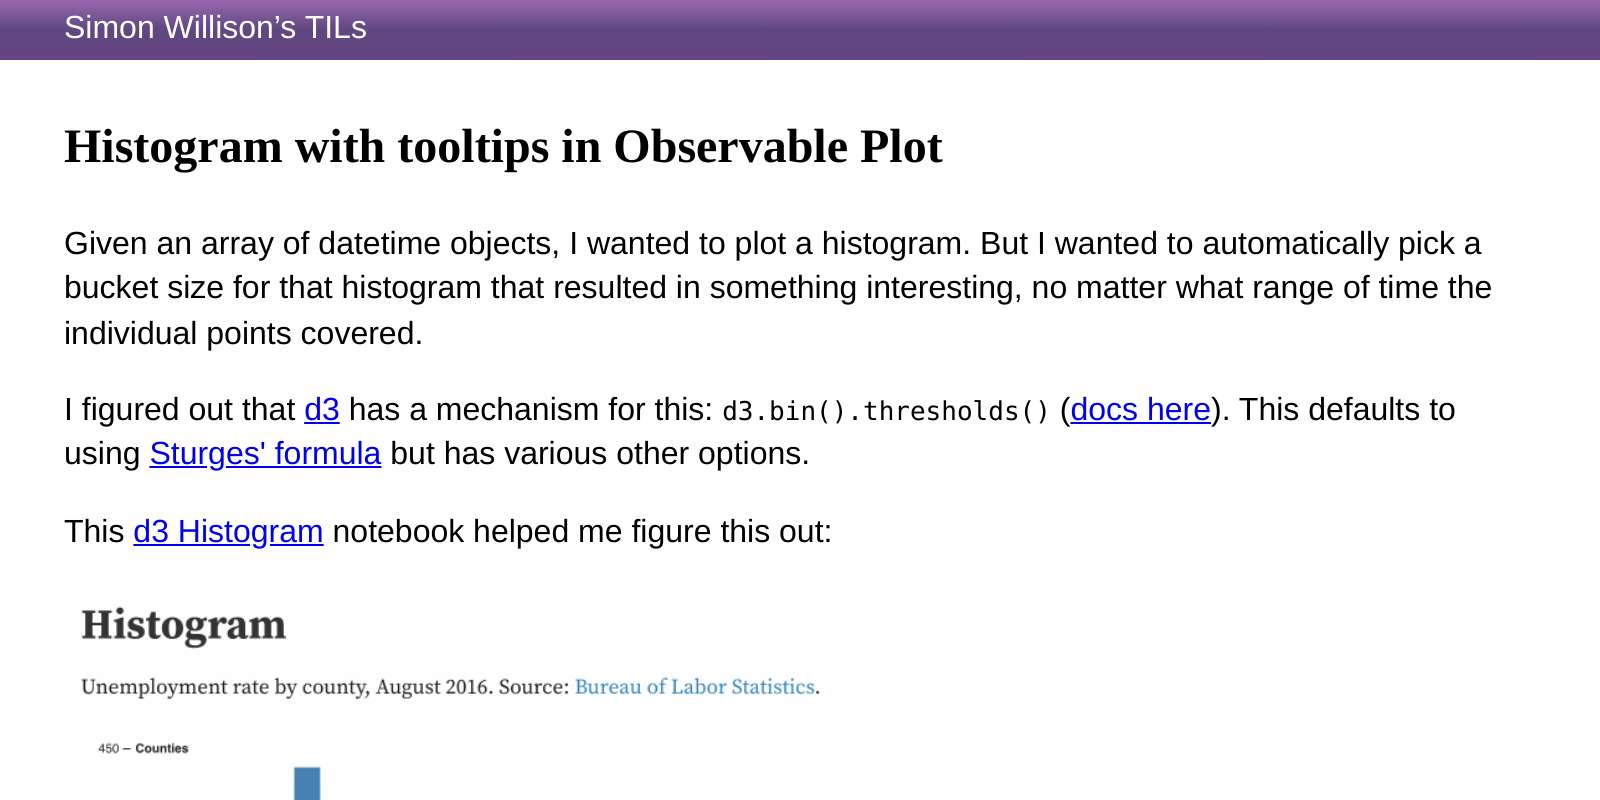
— Given an array of datetime objects, I wanted to plot a histogram. But I wanted to automatically pick a bucket size for that histogram that resulted in something interesting, no matter what range of time the individual points covered.