Video introduction to Datasette and sqlite-utils
I put together a 17 minute video introduction to Datasette and sqlite-utils for FOSDEM 2021, showing how you can use Datasette to explore data, and demonstrating using the sqlite-utils command-line tool to convert a CSV file into a SQLite database, and then publish it using datasette publish. Here’s the video, plus annotated screen captures with further links and commentary.
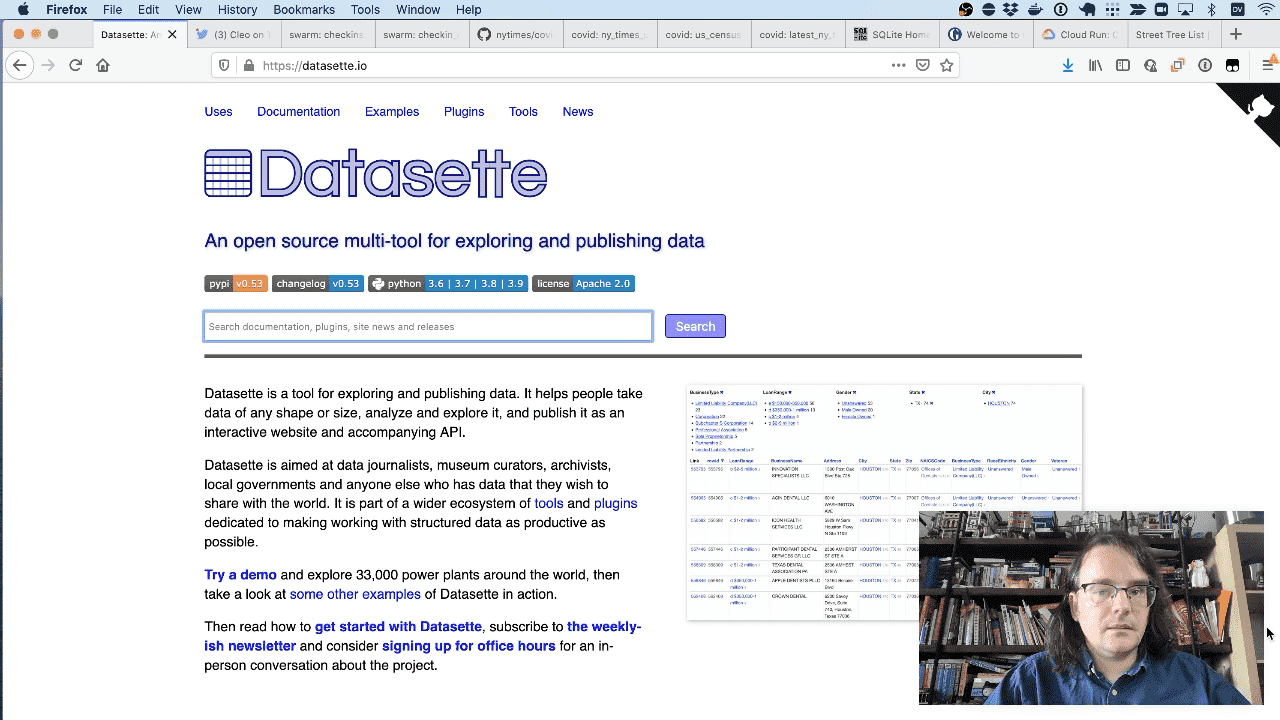
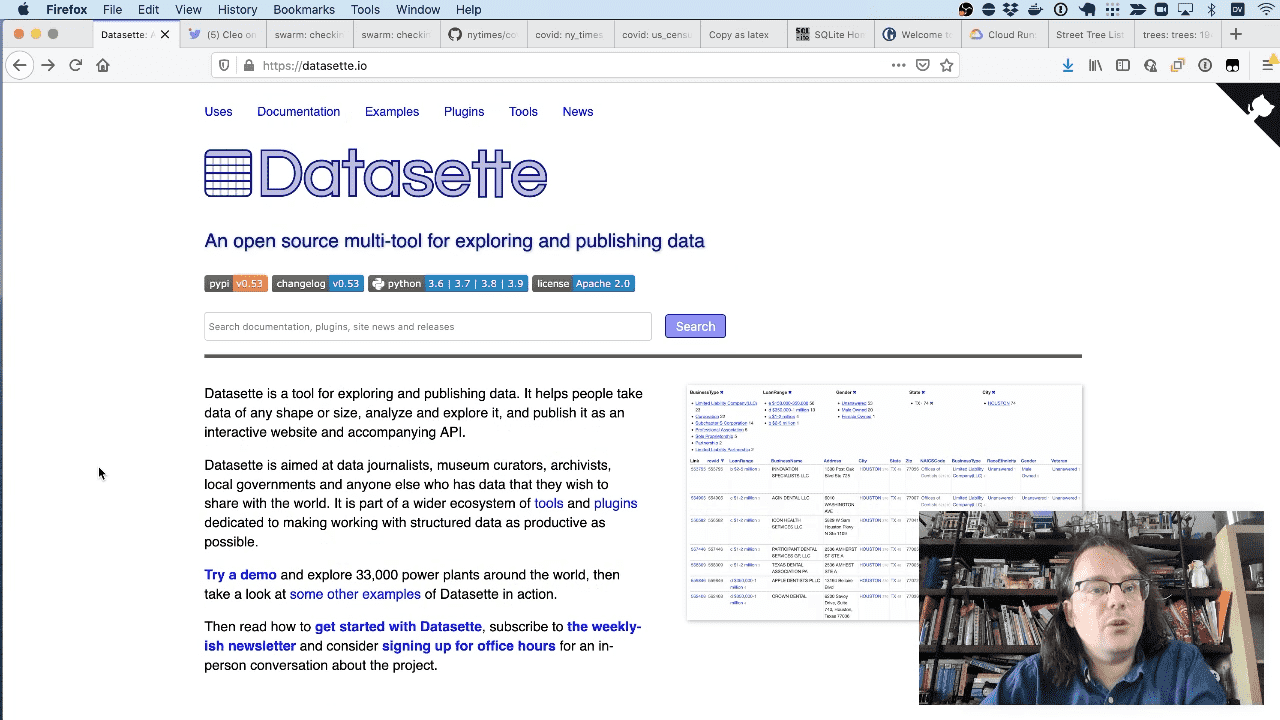
Datasette is an “open source multi-tool for exploring and publishing data”. The best way to explain what that means it to show you a demo.
Cleo is my dog. I’m going to answer the question “What is Cleo’s favourite coffee shop?”
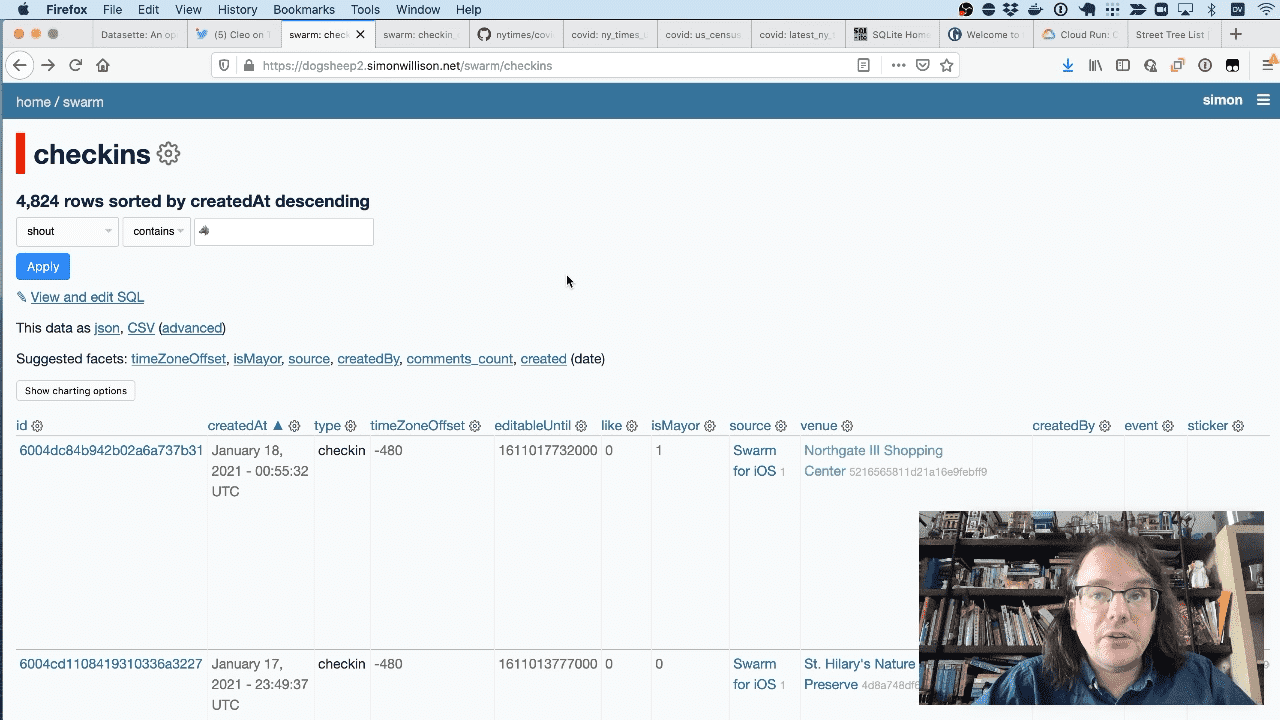
I use the Foursquare Swarm app. Every time I check in somewhere with Cleo I use the wolf emoji as part of my checkin message.
I use my swarm-to-sqlite tool to build a database of all of my checkins using data retrieved from the Foursquare API.
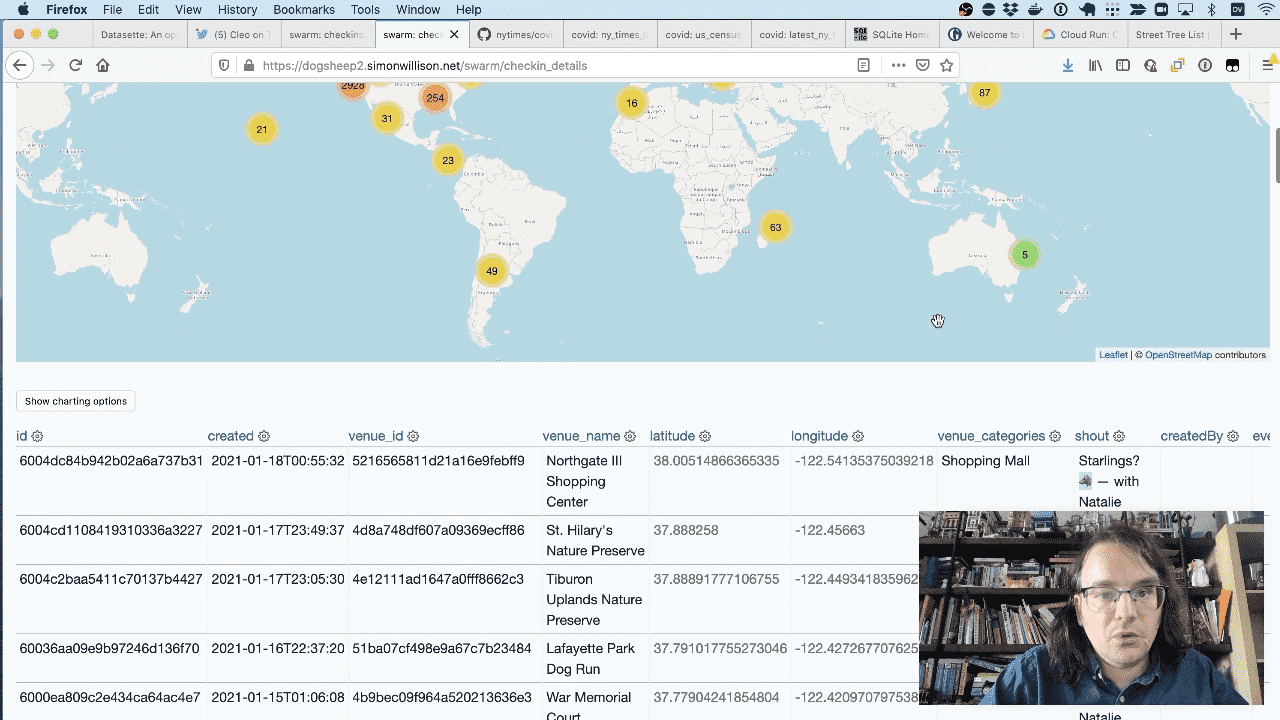
This is a SQL view that joins against the venues table to retrieve the latitude and longitude, then uses the datasette-cluster-map plugin to show my checkins on a map.
The view is defined by the following SQL:
CREATE VIEW checkin_details AS
select
    checkins.id, created, venues.id as venue_id, venues.name as venue_name,
    venues.latitude, venues.longitude, group_concat(categories.name) as venue_categories,
    shout, createdBy, events.name as event_name
from checkins
    join venues on checkins.venue = venues.id
    left join events on checkins.event = events.id
    join categories_venues on venues.id = categories_venues.venues_id
    join categories on categories.id = categories_venues.categories_id
group by checkins.id
order by createdAt desc;
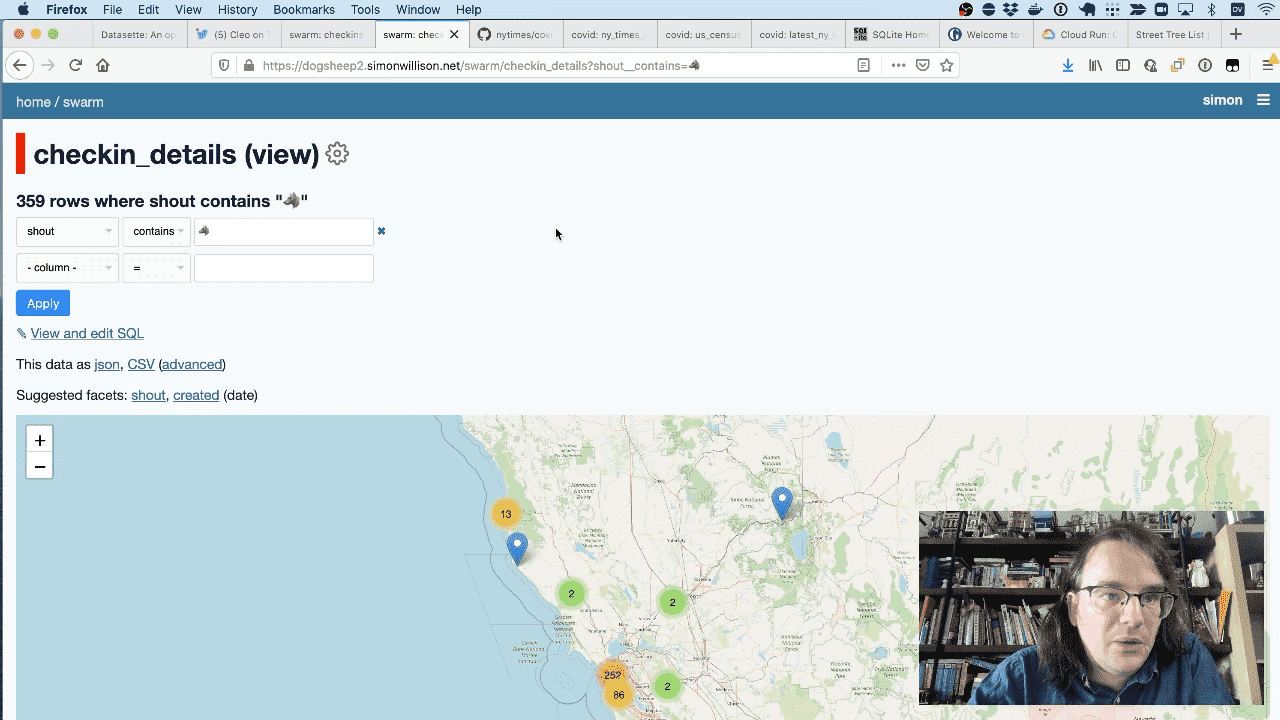
If I filter for everything where the “shout” contains the wolf emoji I get a map of just the places that Cleo likes.
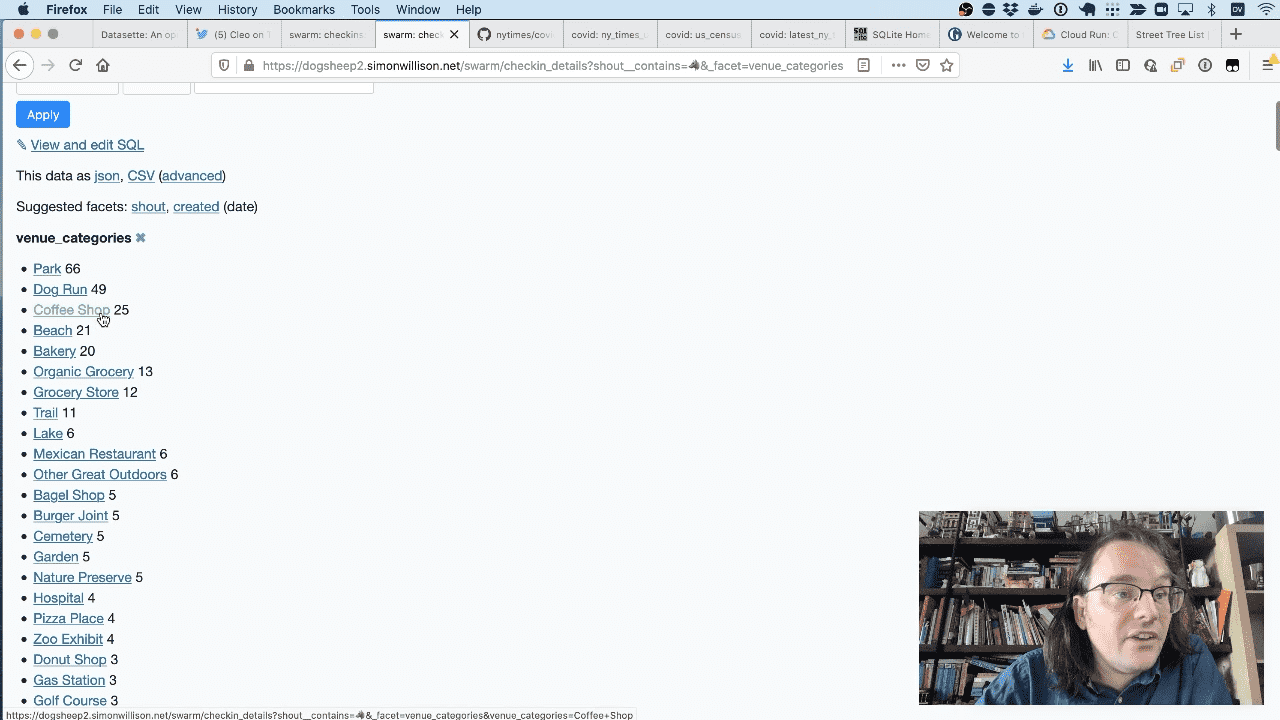
If I facet by venue_categories I can see that she likes parks and dog runs, but she’s also been to coffee shops 25 times.
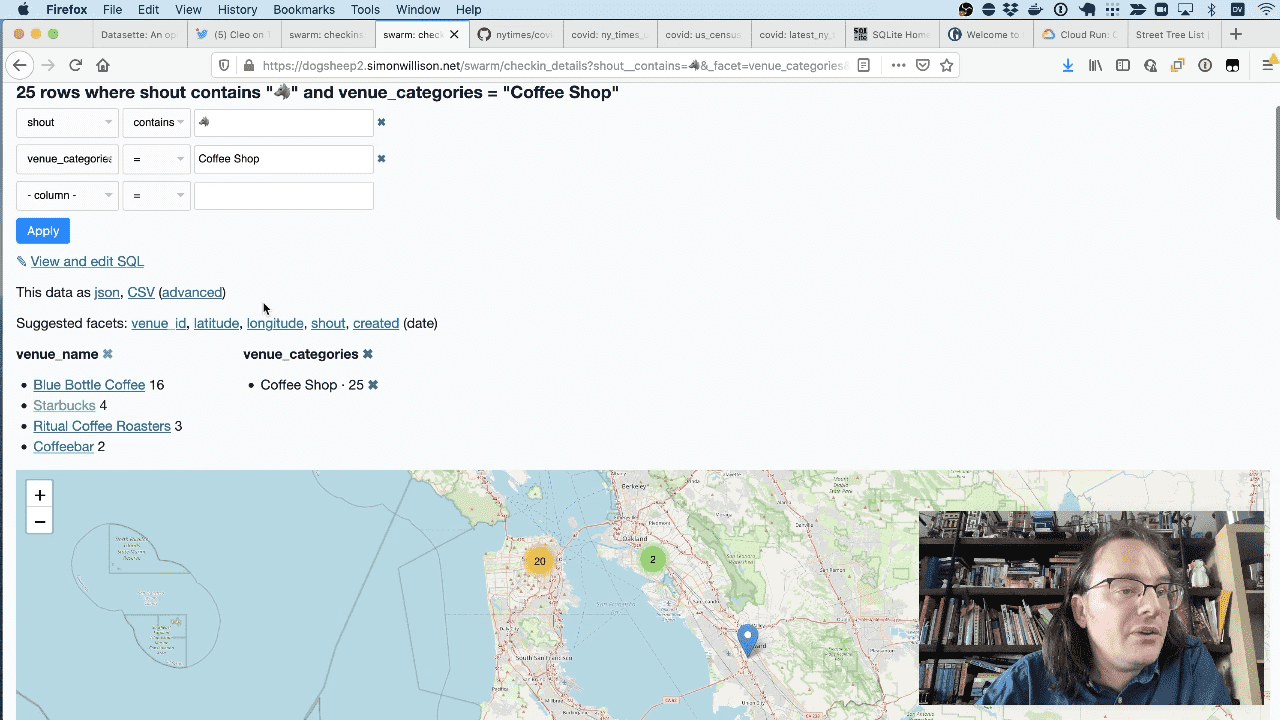
I can filter down to just coffee shop checkins, then facet by venue_name to see that she’s been to Blue Bottle 16 times but she has occasionally been to Starbucks.
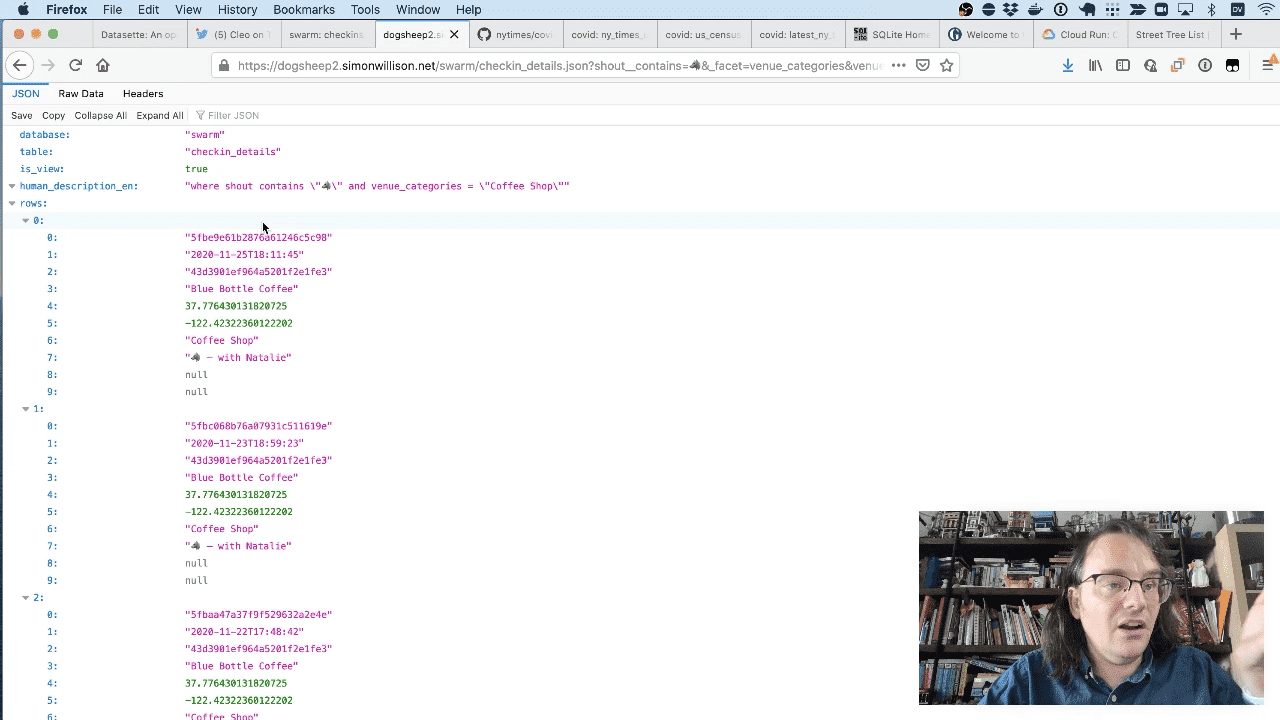
Everything you can see in the Datasette interface can be got back out as raw data as well. This is a JSON feed of Cleo’s coffee shop checkins.
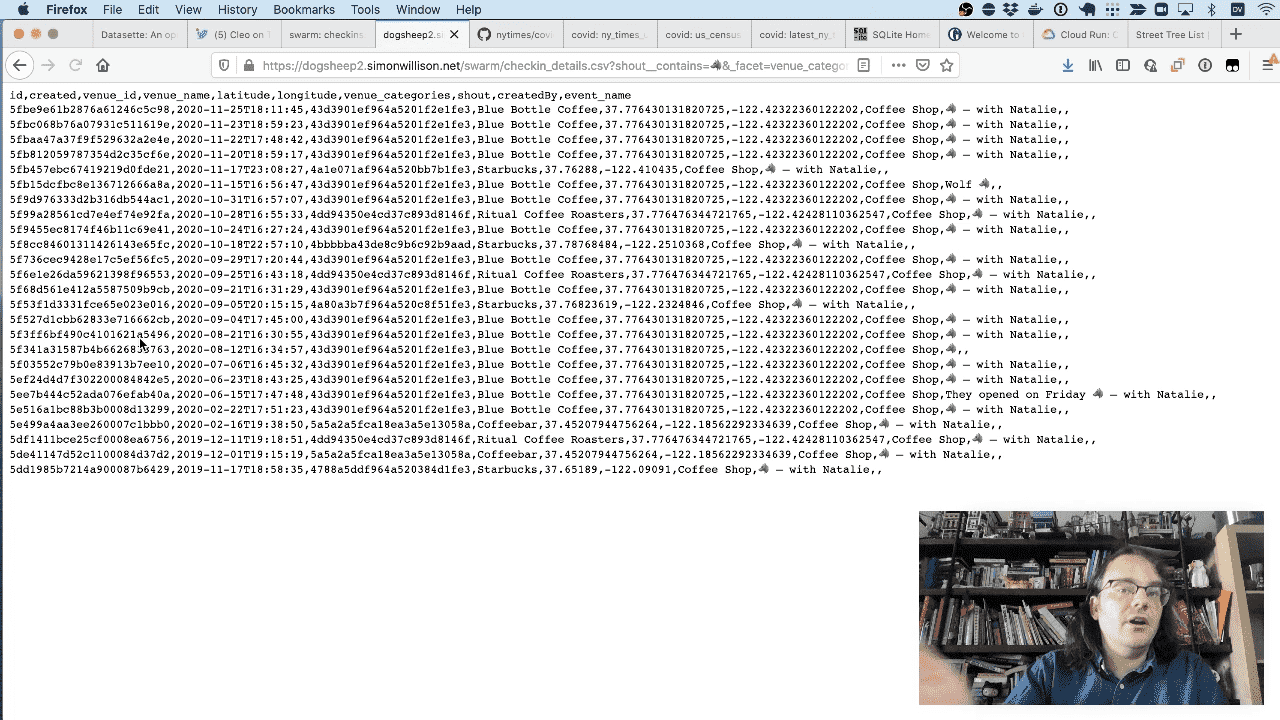
And here are those checkins as CSV.
So this is clearly super-useful software for categorizing your dog’s different coffee shop visits.
Let’s try something a bit more serious.
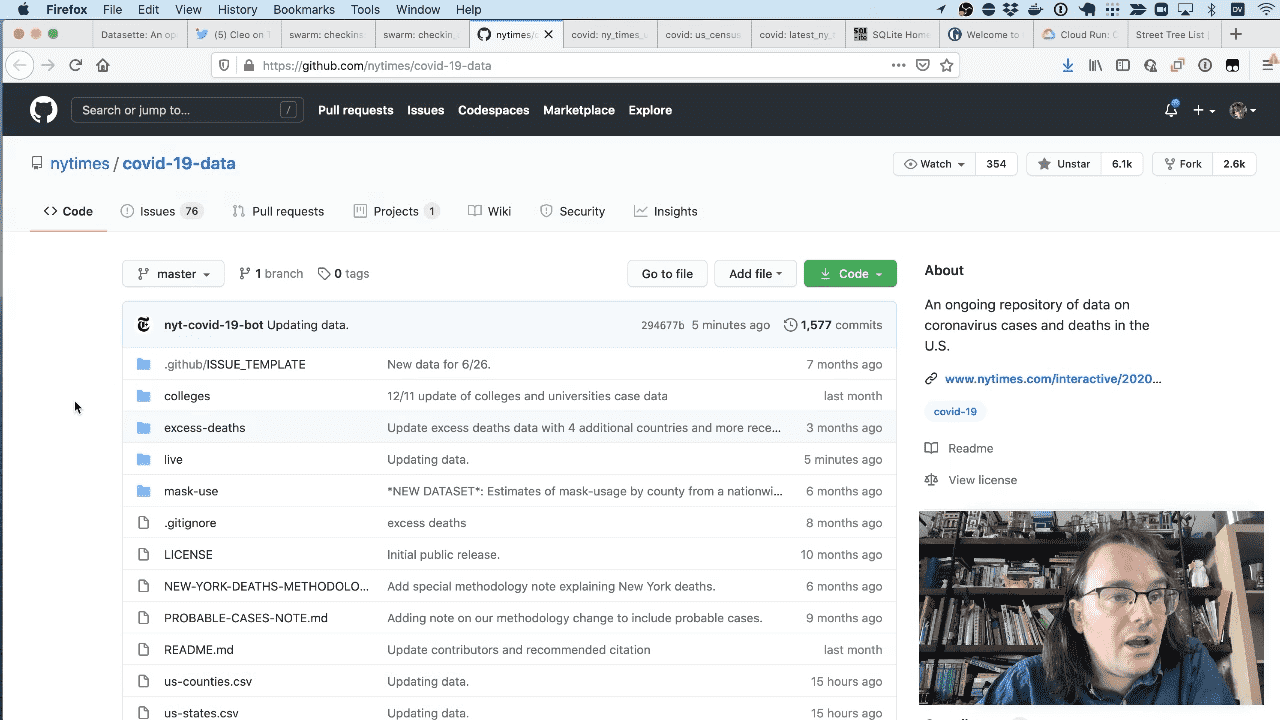
The New York Times publish their Covid-19 data to a GitHub repository as CSV files on a daily basis.
I run a Datasette instance at covid-19.datasettes.com which publishes the latest COVID data from the New York Times, the LA Times and some other sources on a daily basis.
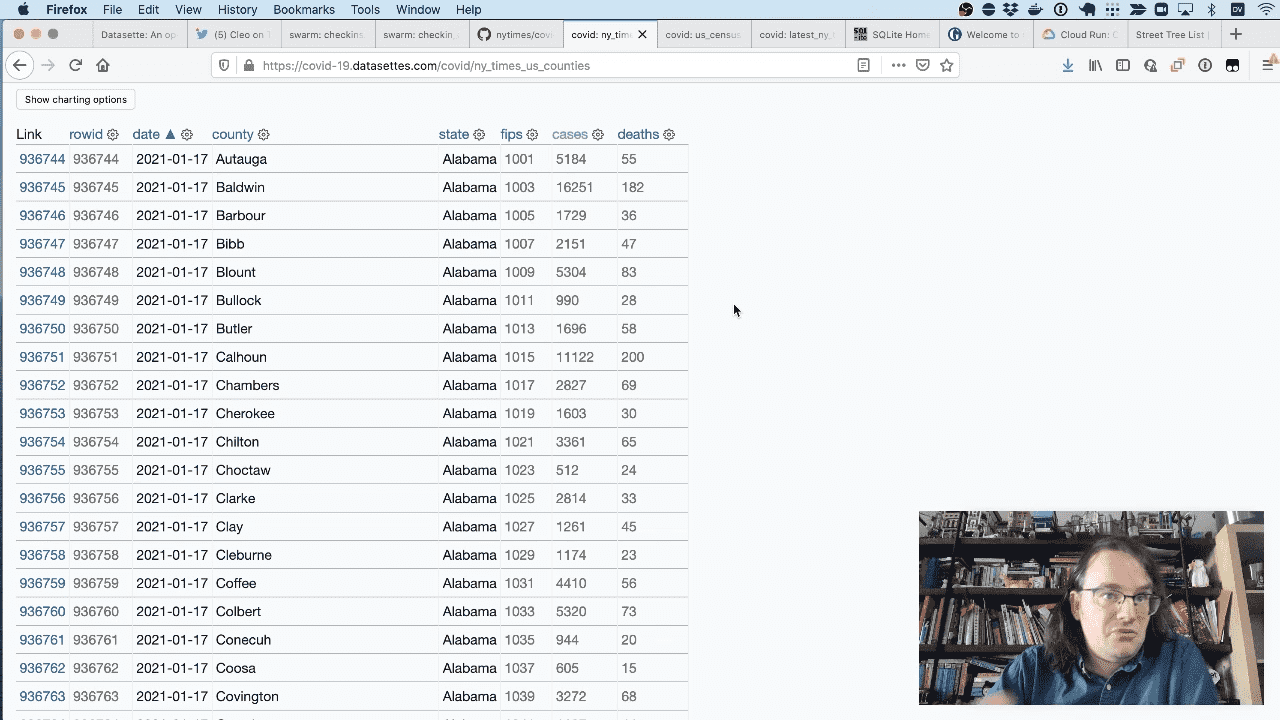
Here are the New York Times daily county numbers as a table in Datasette.
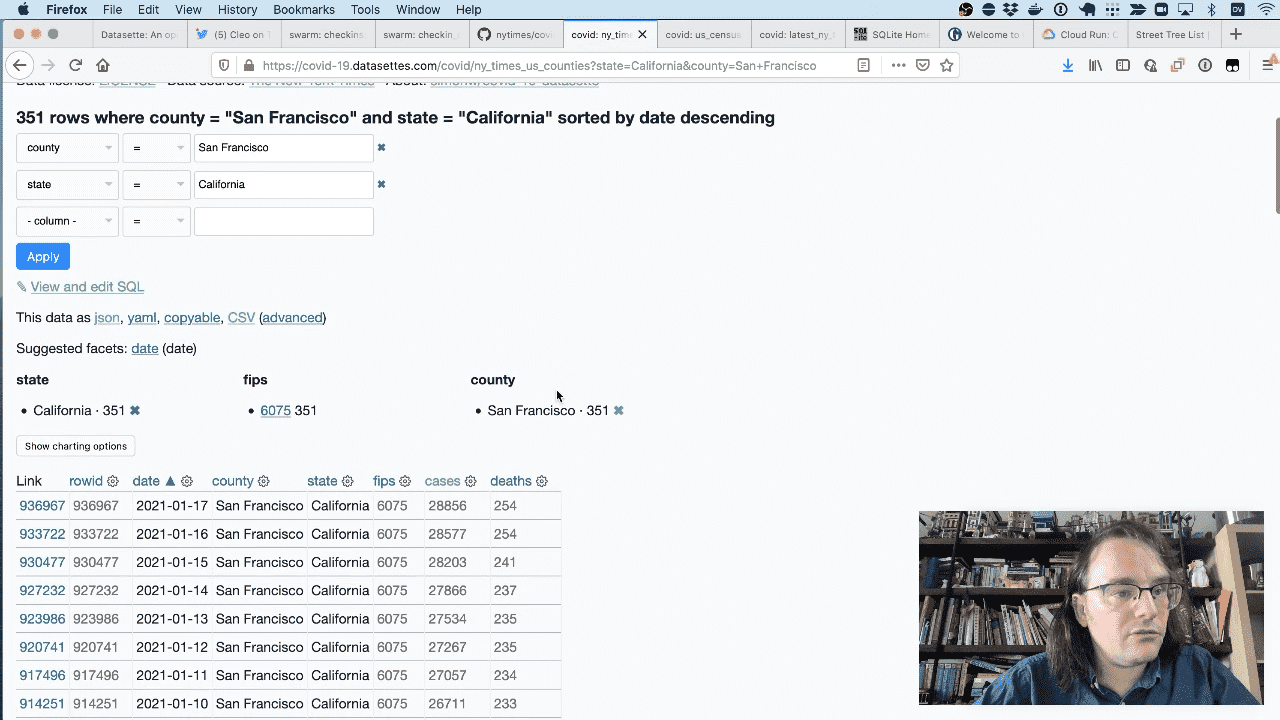
I can drill down to just the numbers for San Francisco County in California.
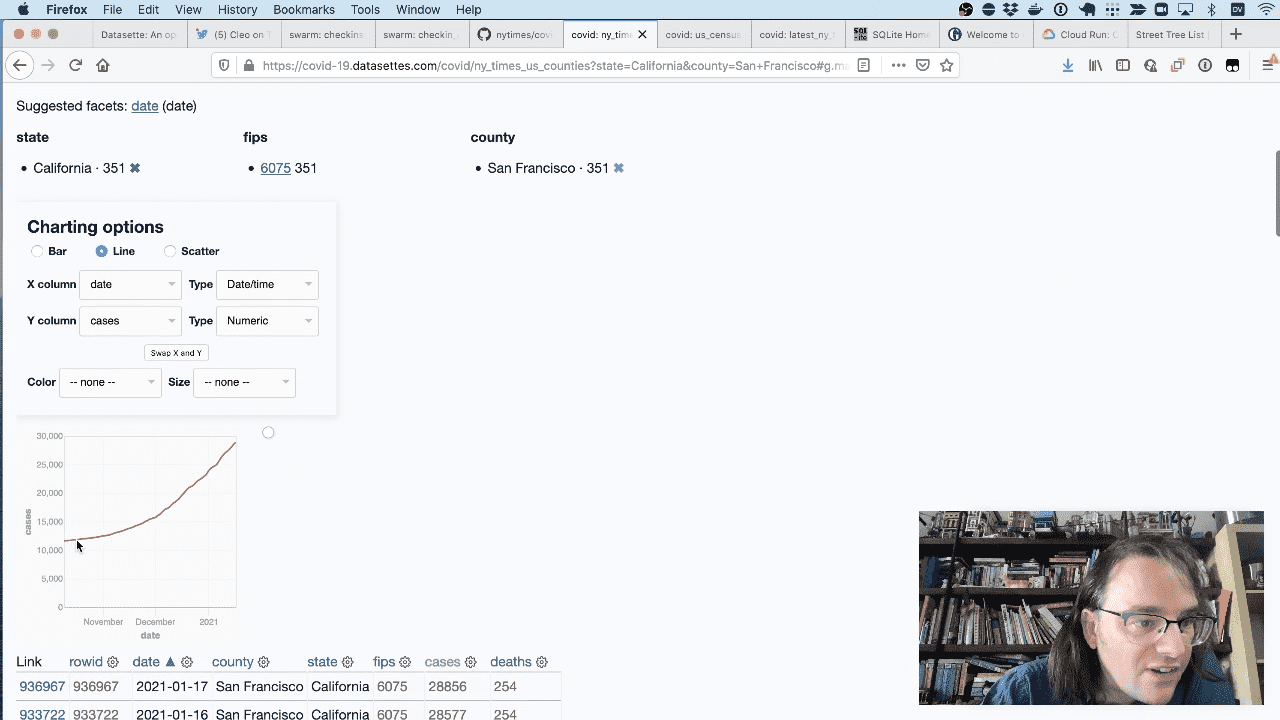
Then I can use the datasette-vega plugin to plot those numbers on a line chart.
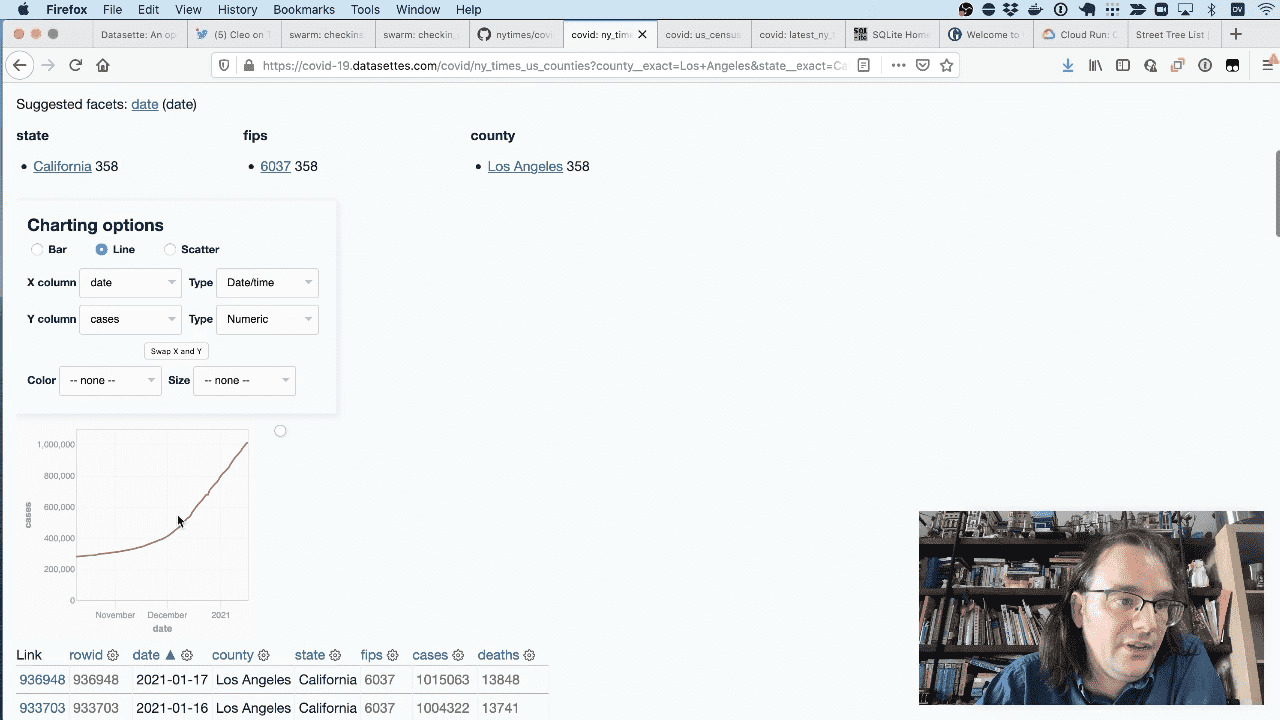
Here’s that same chart datasette-vega plugin to for Los Angeles county.
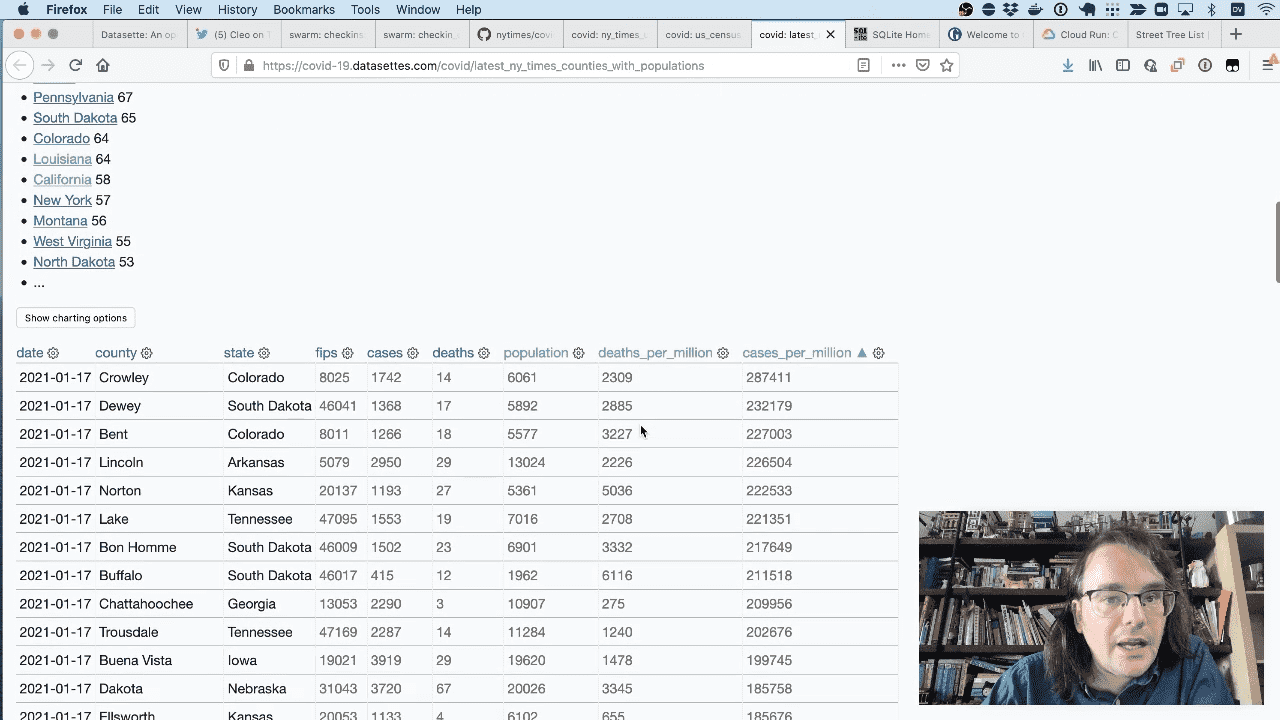
Since this is all built on top of a relational database, I can use joins. Here’s a page that joins this the New York times data aginst this table of US Census county populations by FIPS code, allowing us to see number of cases per million population.
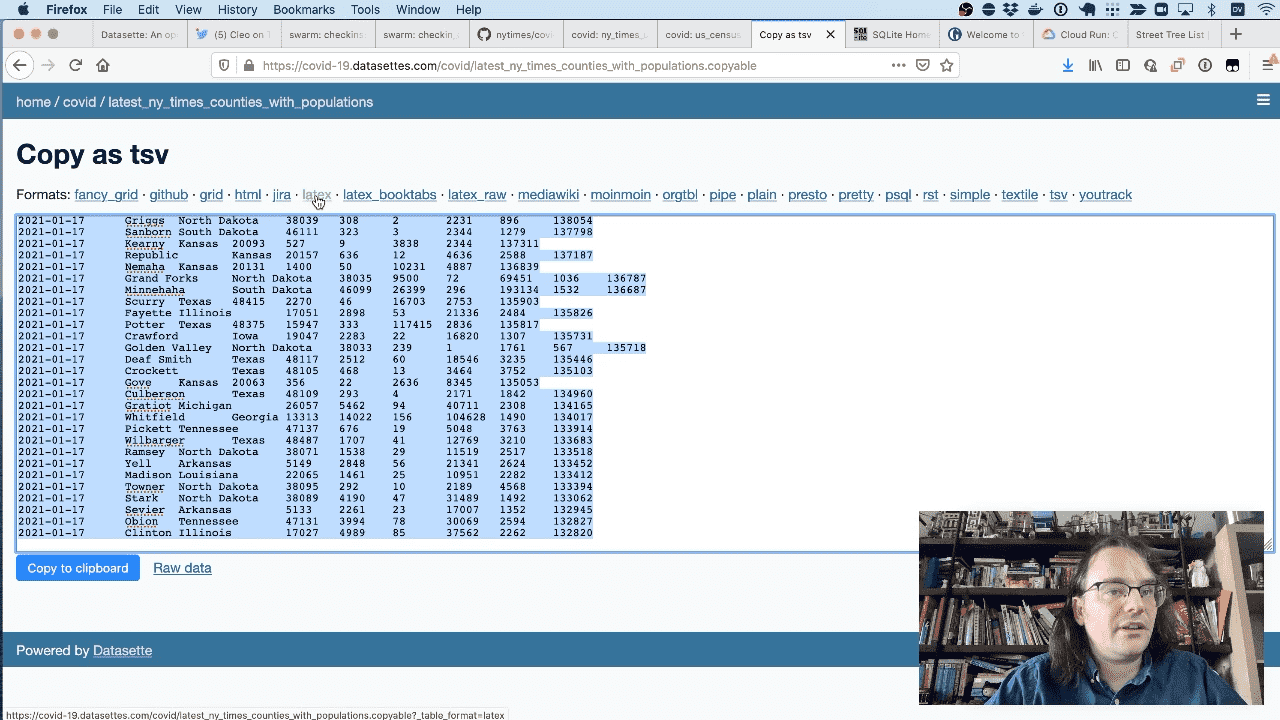
Another plugin is datasette-copyable, which gives you the ability to copy and paste data out of Datasette in different formats—here’s a LaTeX export of that COVID data for example.
Datasette is built on top of SQLite, which claims to be the world’s Most Widely Deployed and Used Database Engine.
I particularly like how SQLite databases are single .db files on disk, which makes them easy to copy, upload and share with other people.
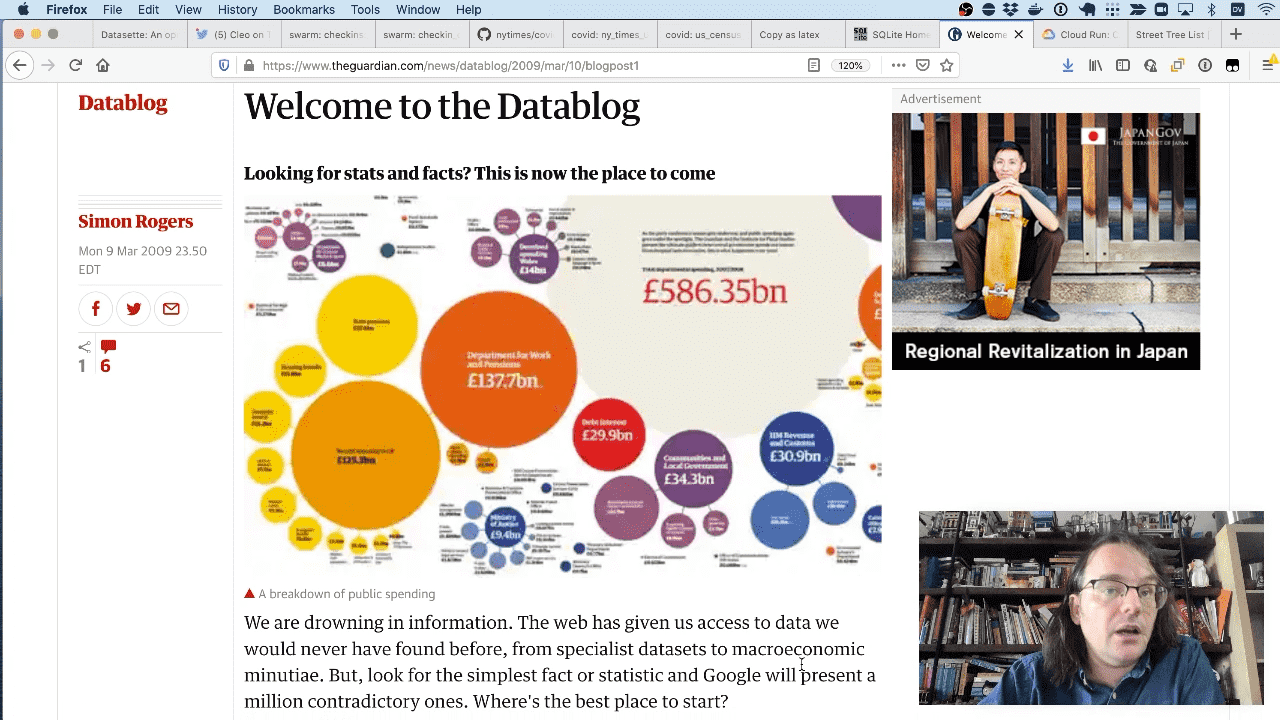
The original inspiration for Datasette was work I did at the Guardian back in 2009. We launched the Datablog to share the data underlying our stories—and we ended up using Google Sheets to share the data. I always felt like there should be a more open way of publishing data than putting it in a Google Sheet.
The other inspiration was serverless hosting providers, like Vercel and Cloud Run.
I started looking at these three years ago, and realized that while they didn’t generally provide a relational database (at least not for free) if your data was read-only you could bundle the data up in a SQLite file and deploy it as part of the application code.
I call this the Baked Data architectural pattern.
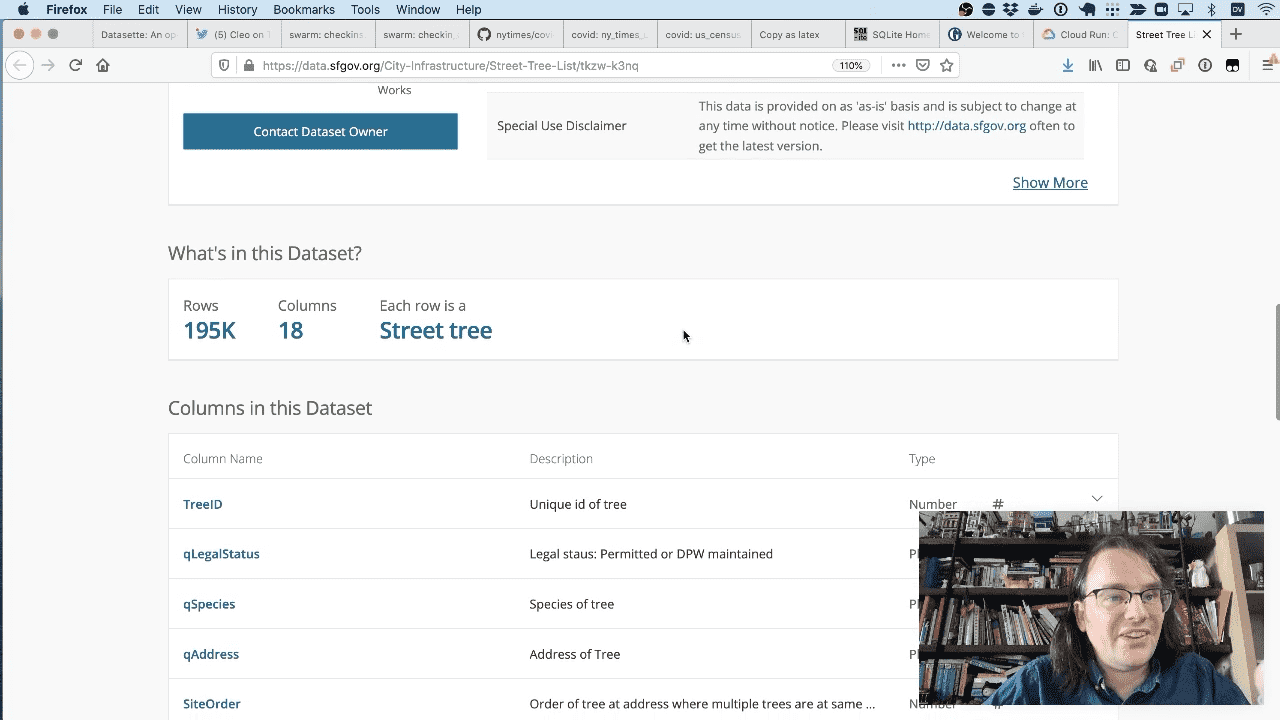
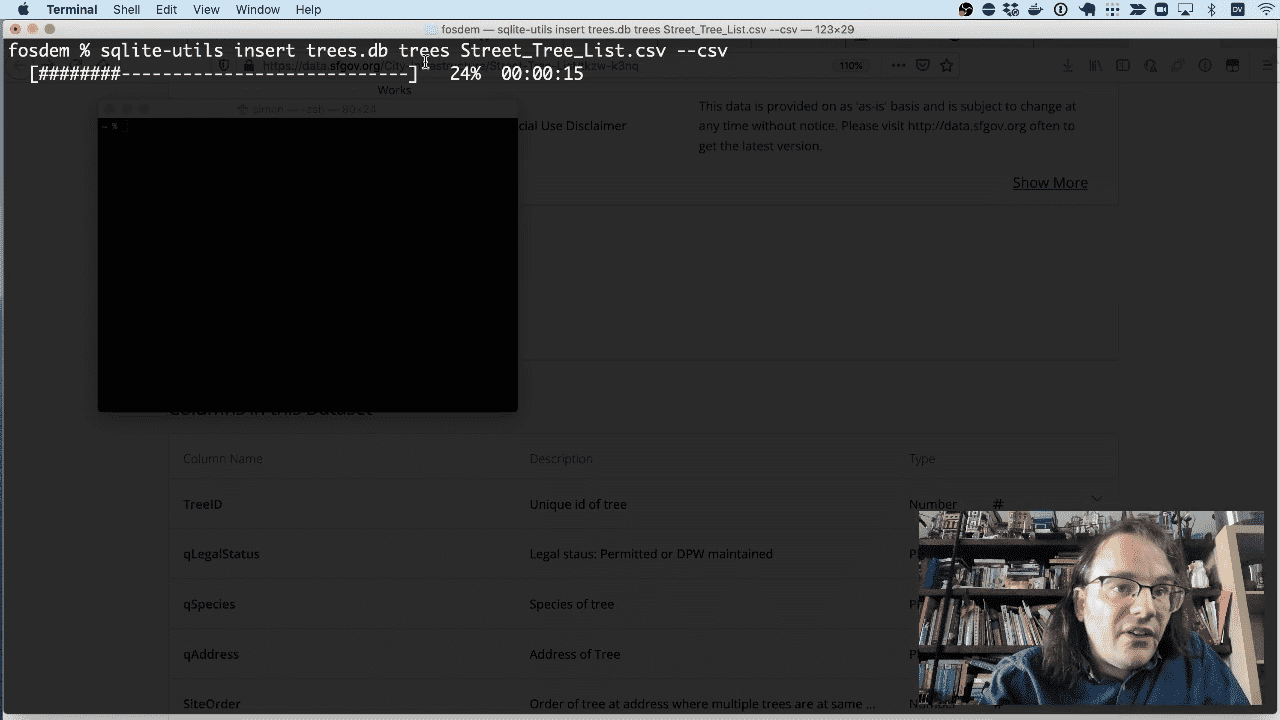
The city of San Francisco publishes a CSV file of every tree in the city—195,000 trees!
The CSV file includes latitude, longitude, species, street address and lots more.
sqlite-utils is a separate tool I’ve been building for manipulating SQLite databases.
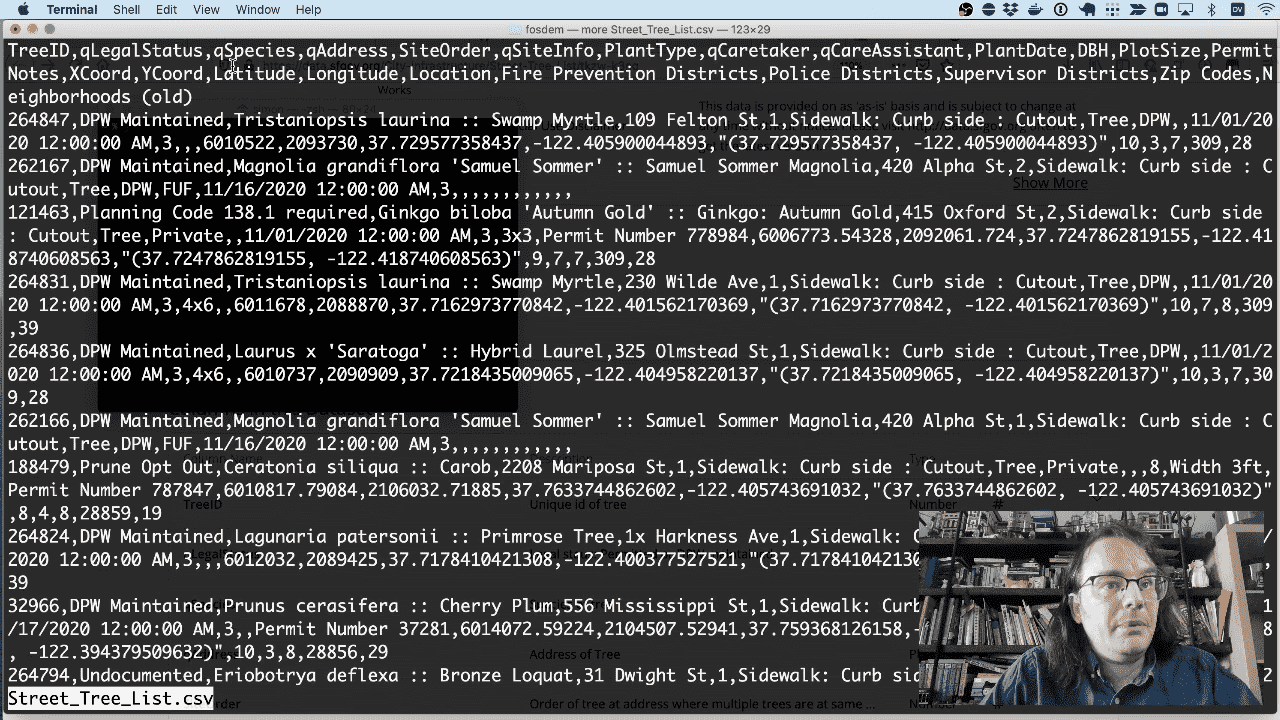
I’m going to use it to insert that tree CSV file into a SQLite database file.
sqlite-utils insert trees.db trees Street_Tree_List.csv --csv
Full documentation for the sqlite-utils insert command is available here.
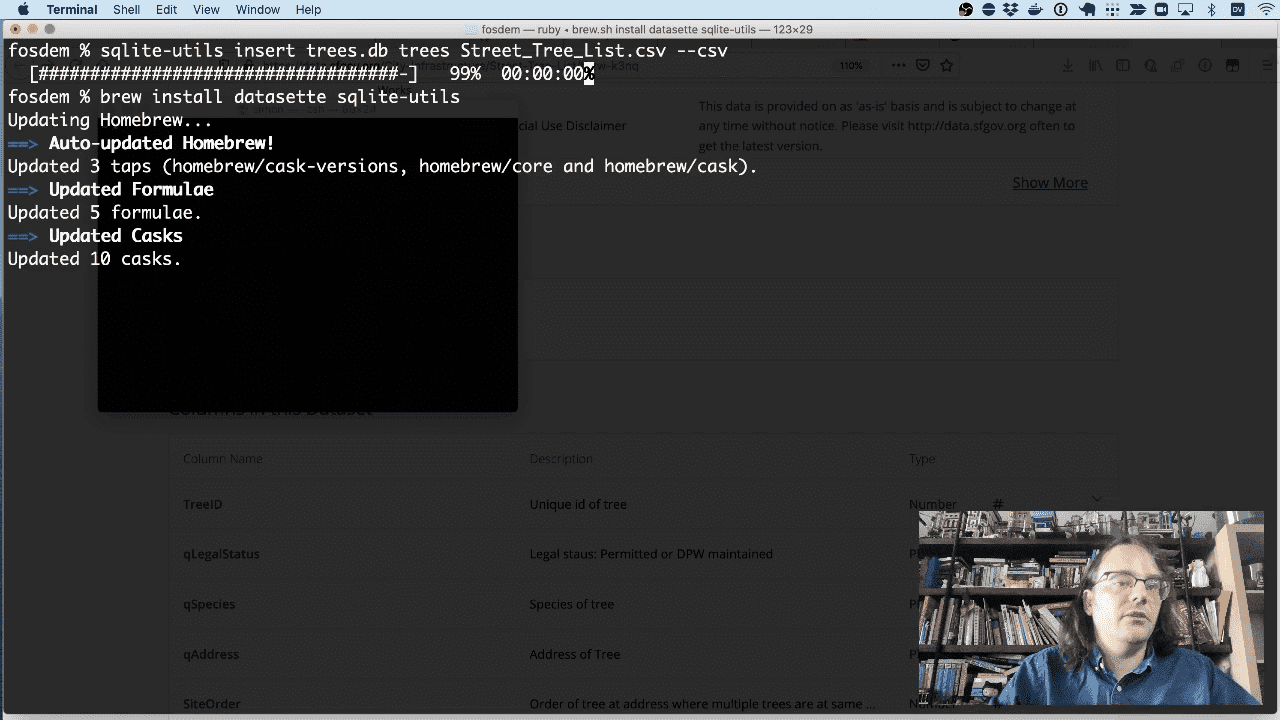
Both Datasette and sqlite-utils can be installed on macOS using Homebrew.
brew install datasette sqlite-utils
They are written in Python so they can also be installed using pip.
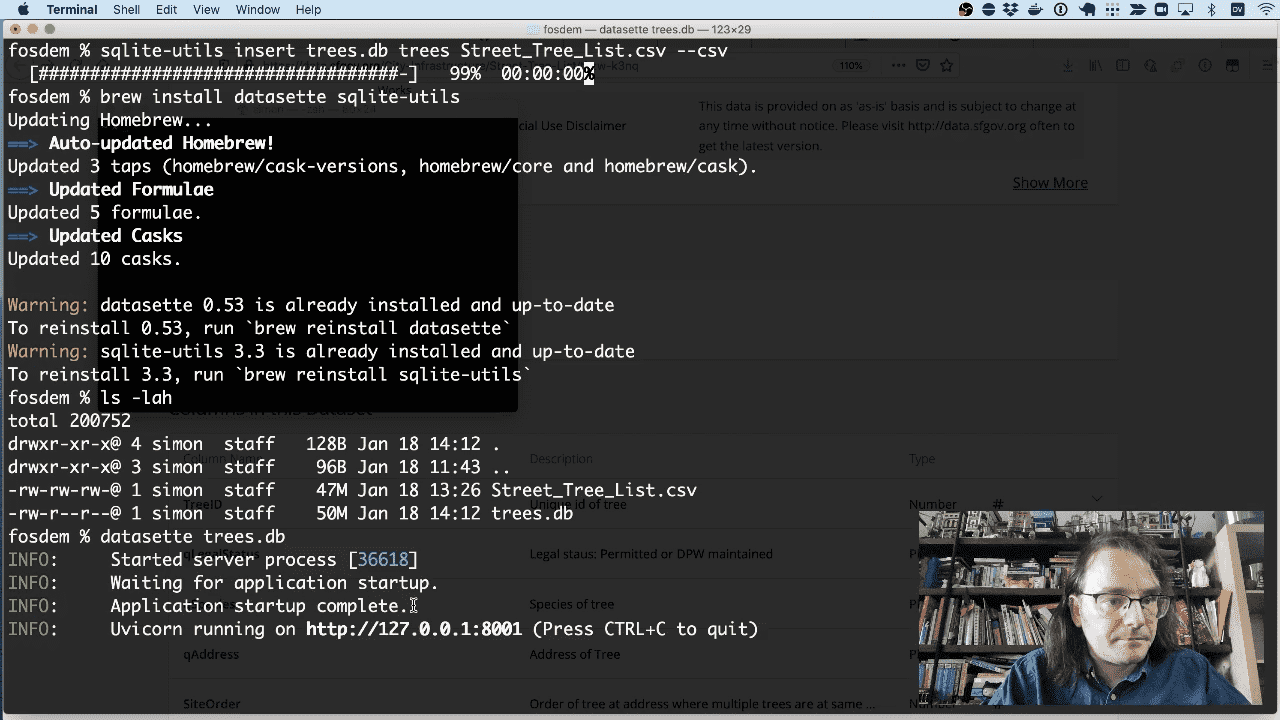
To run Datasette against the new trees.db file locally, run this:
datasette trees.db
Then visit http://127.0.0.1:8000/ in your browser.
You can also use the -o option to Datasette to open the browser for you:
datasette trees.db -o
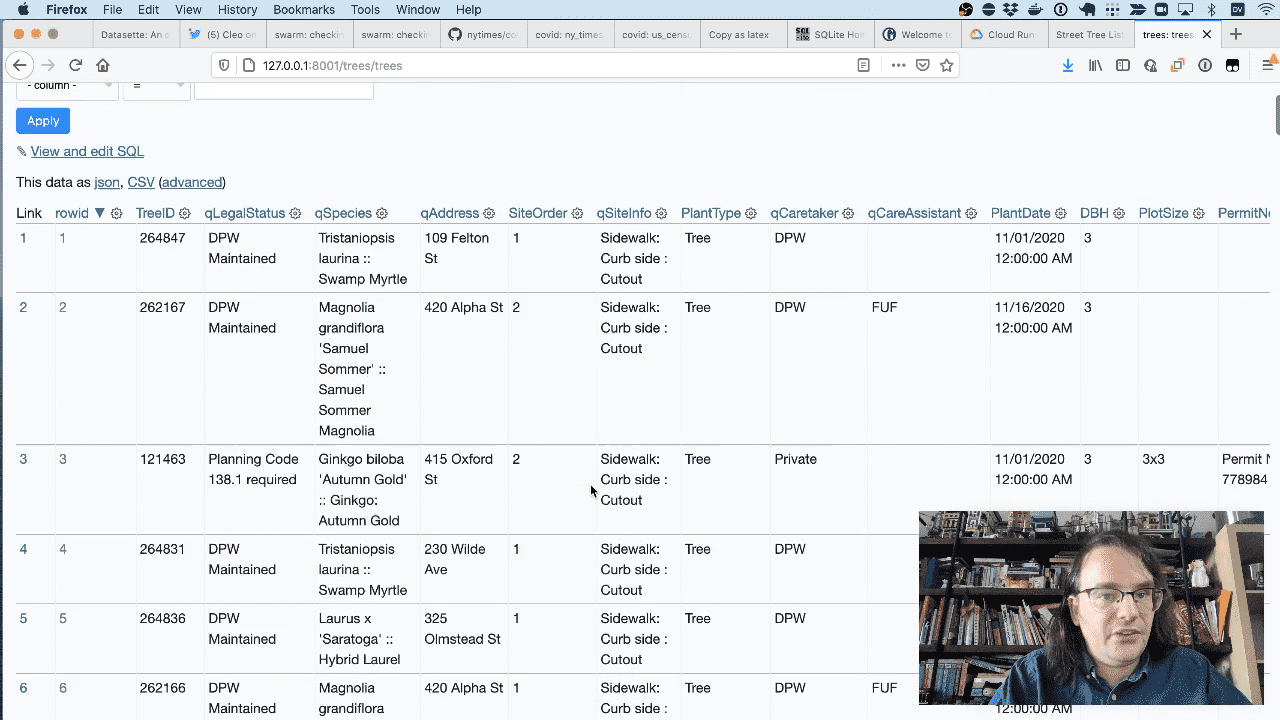
And here’s that CSV file running in Datasette in tabular format.
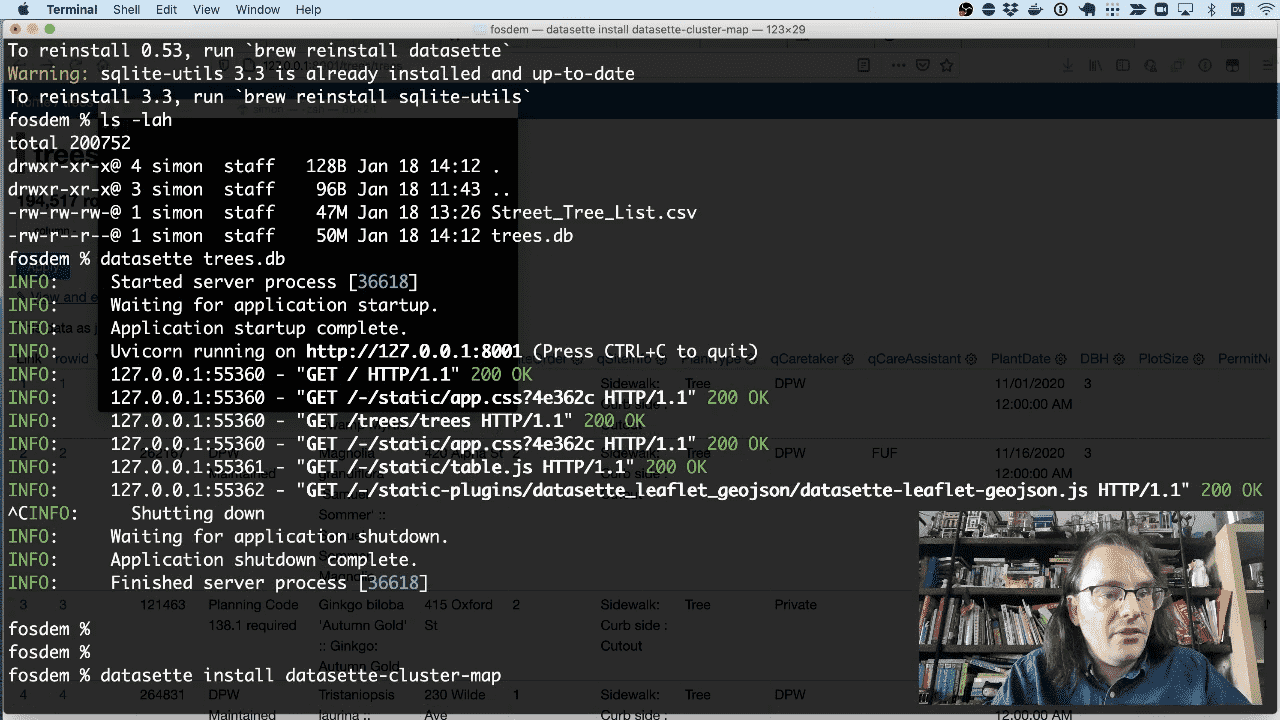
To see them on a map, we need the datasette-cluster-map plugin. We can install that like this:
datasette install datasette-cluster-map
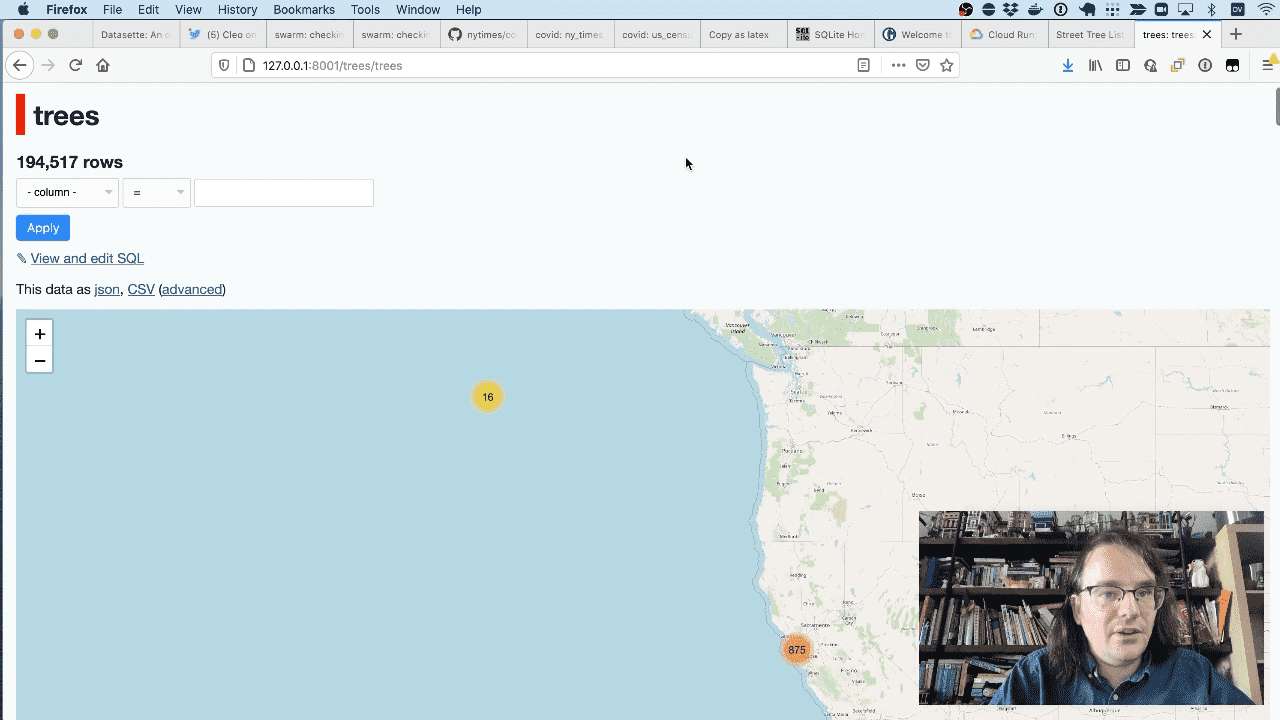
And here they are on a map. You can see straight away that sixteen of the trees have an incorrect latitude and longitude and appear in the middle of the ocean.
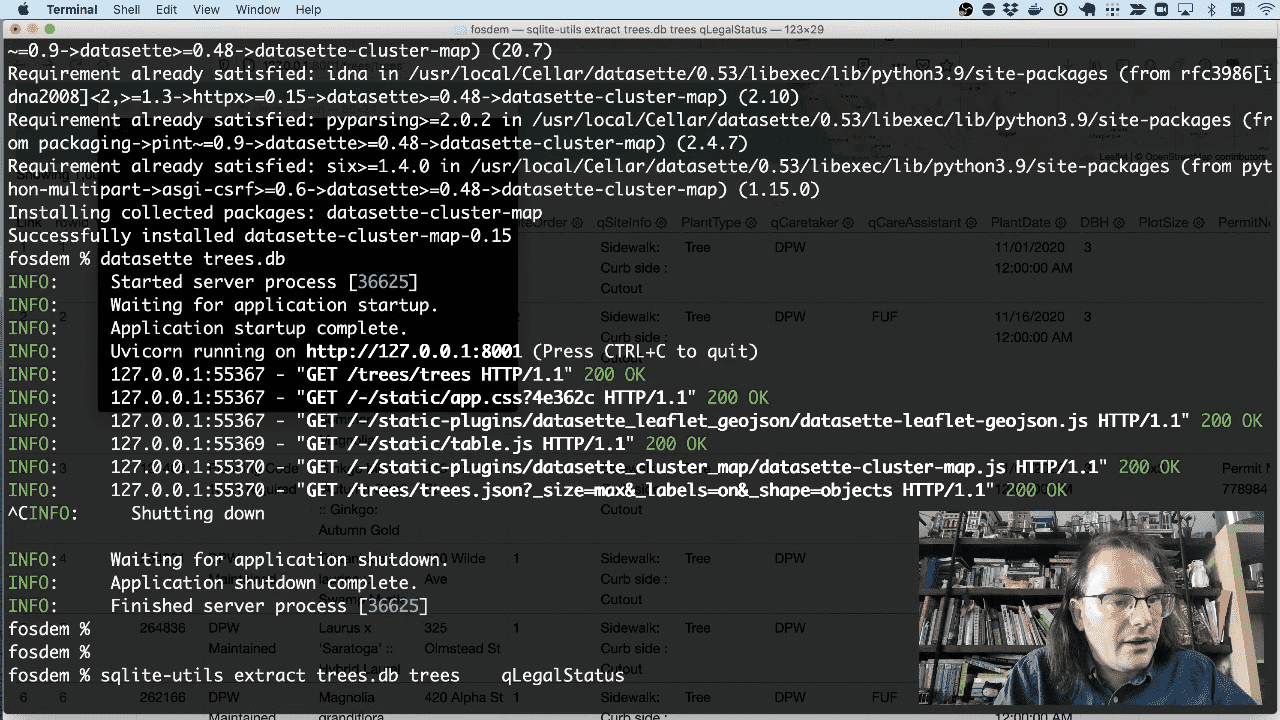
A lot of the columns have duplicate values—qLegalStatus for example. sqlite-utils has a tool for helping with that—it can extract those values out into a separate table.
I wrote about this at length in Refactoring databases with sqlite-utils extract.
We can extract that qLegalStatus column like so:
sqlite-utils extract trees.db trees qLegalStatus
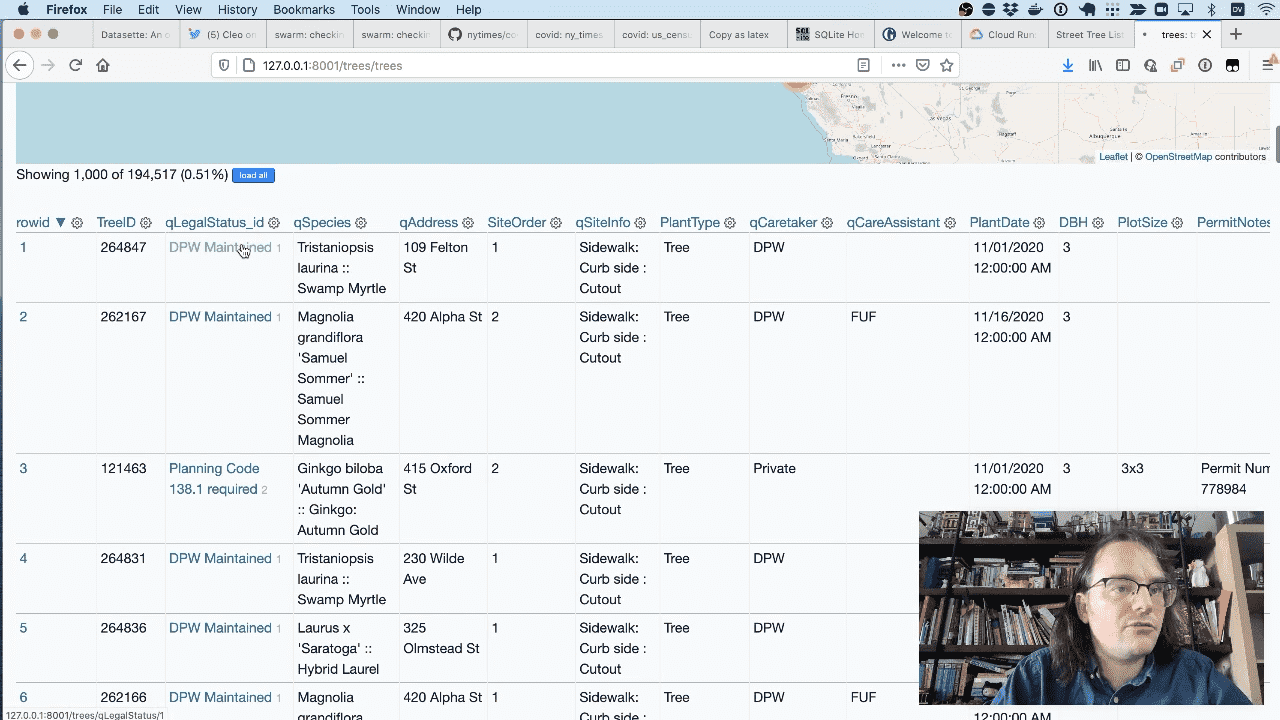
When I refresh the page you can see that those columns now contain links through to the new table.
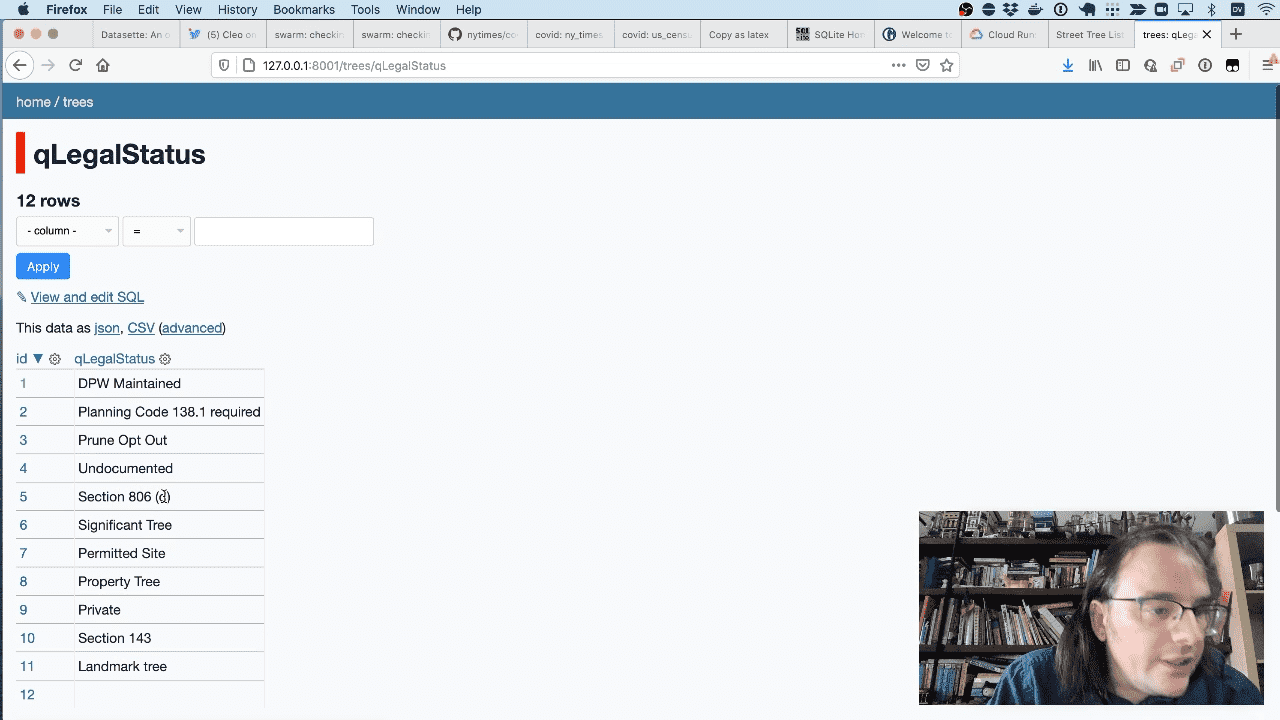
Here’s the new table.
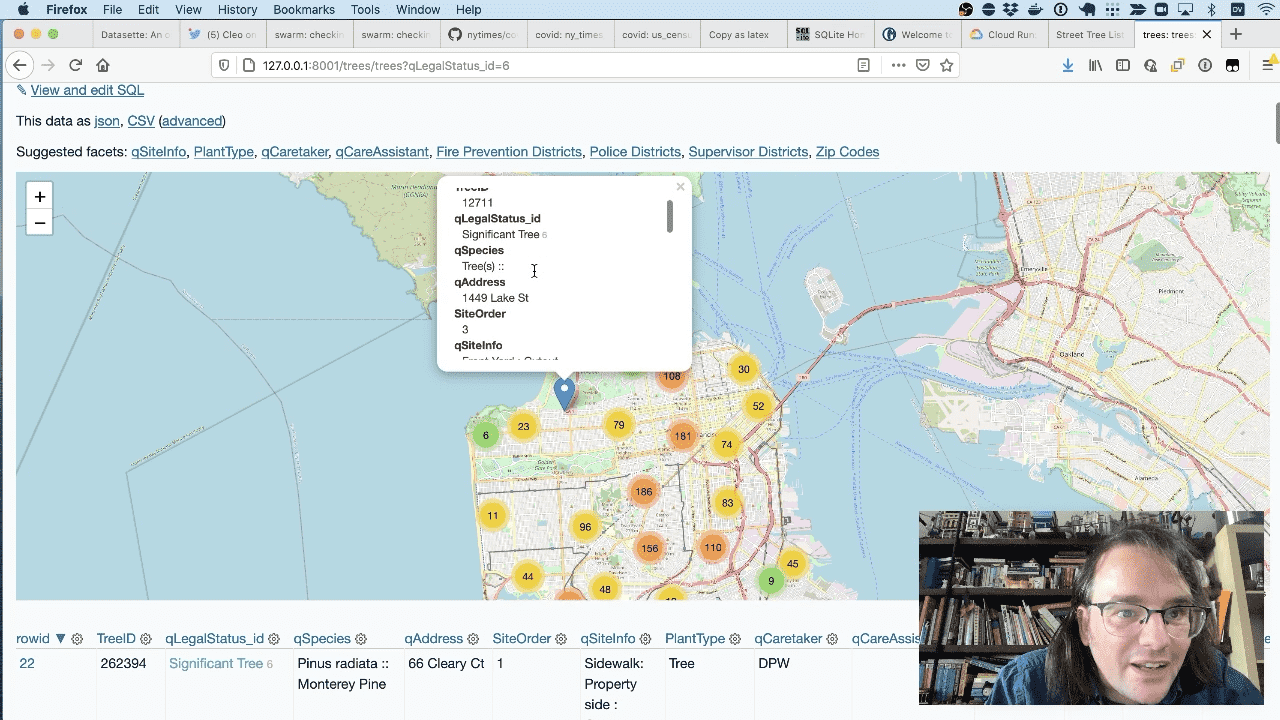
And here’s a map of every “significant tree” in San Francisco.
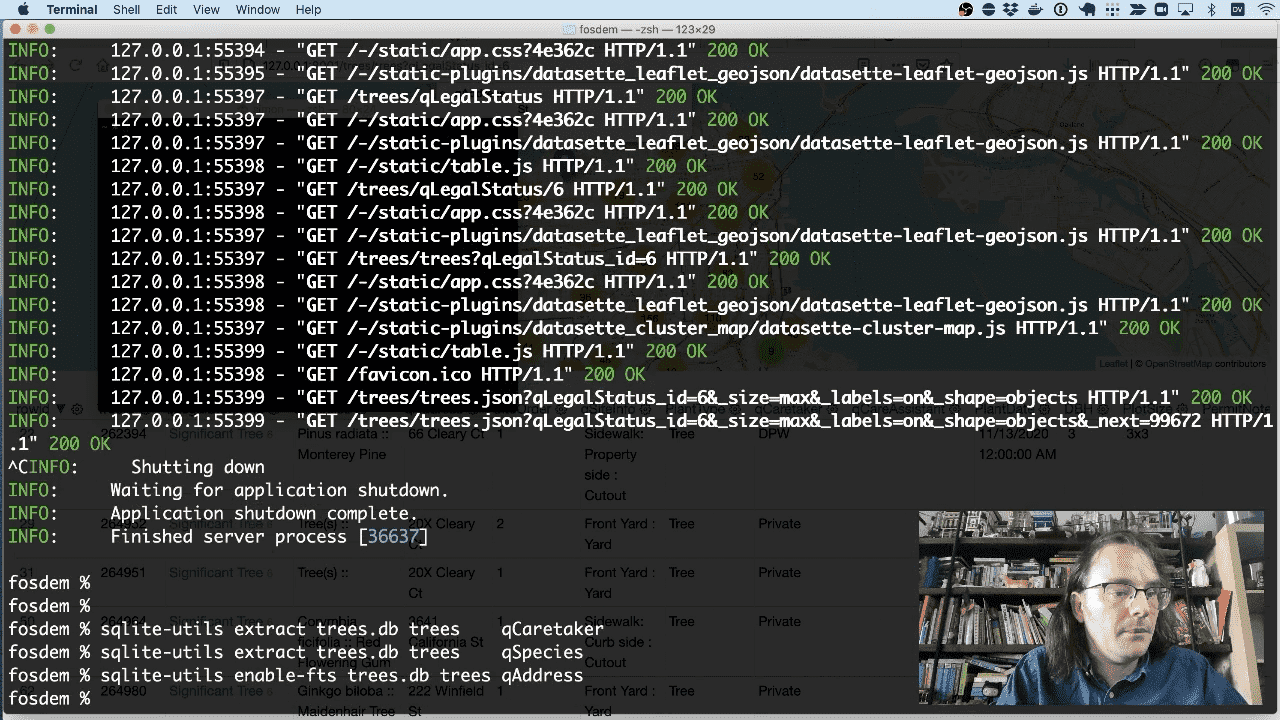
We’ll extract two more columns:
sqlite-utils extract trees.db trees qCaretaker
sqlite-utils extract trees.db trees qSpecies
Another useful thing we can do is configure full-text search. We can do that against the qAddress column using the enable-fts command:
sqlite-utils enable-fts trees.db trees qAddress
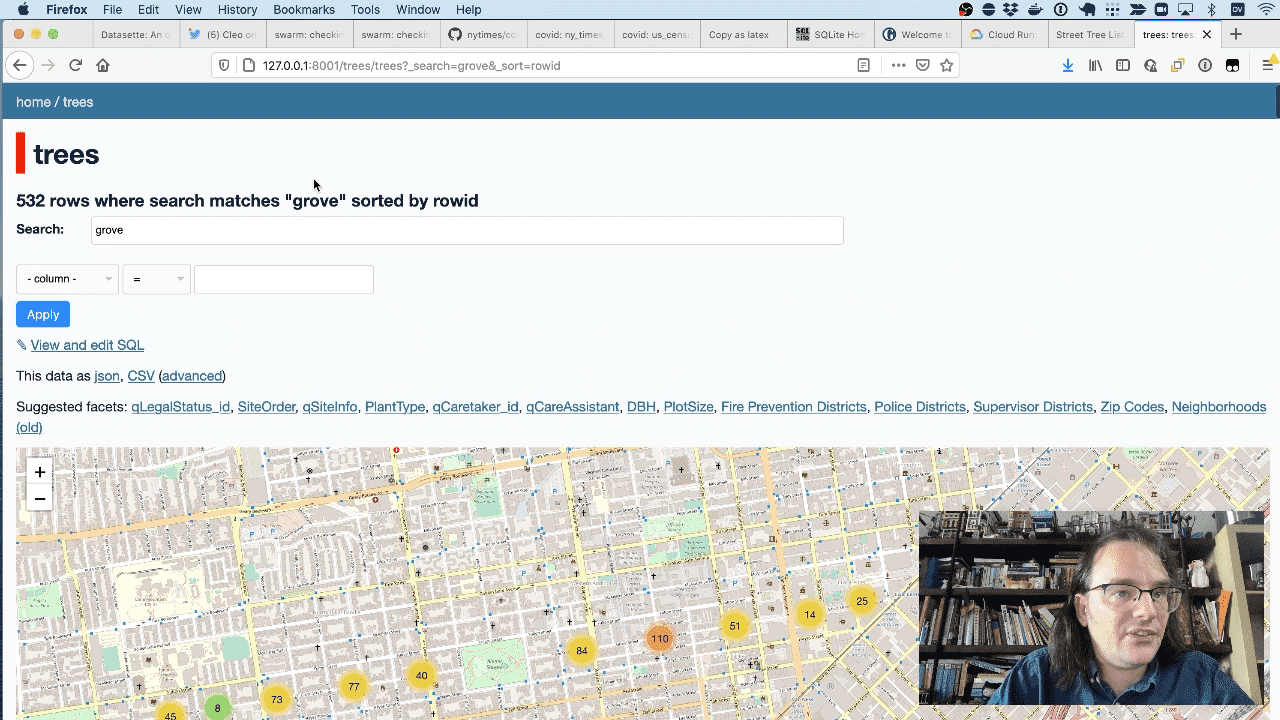
Now Datasette provides a search field, which we can use to search for “grove” to see a map of all of the trees on Grove street.
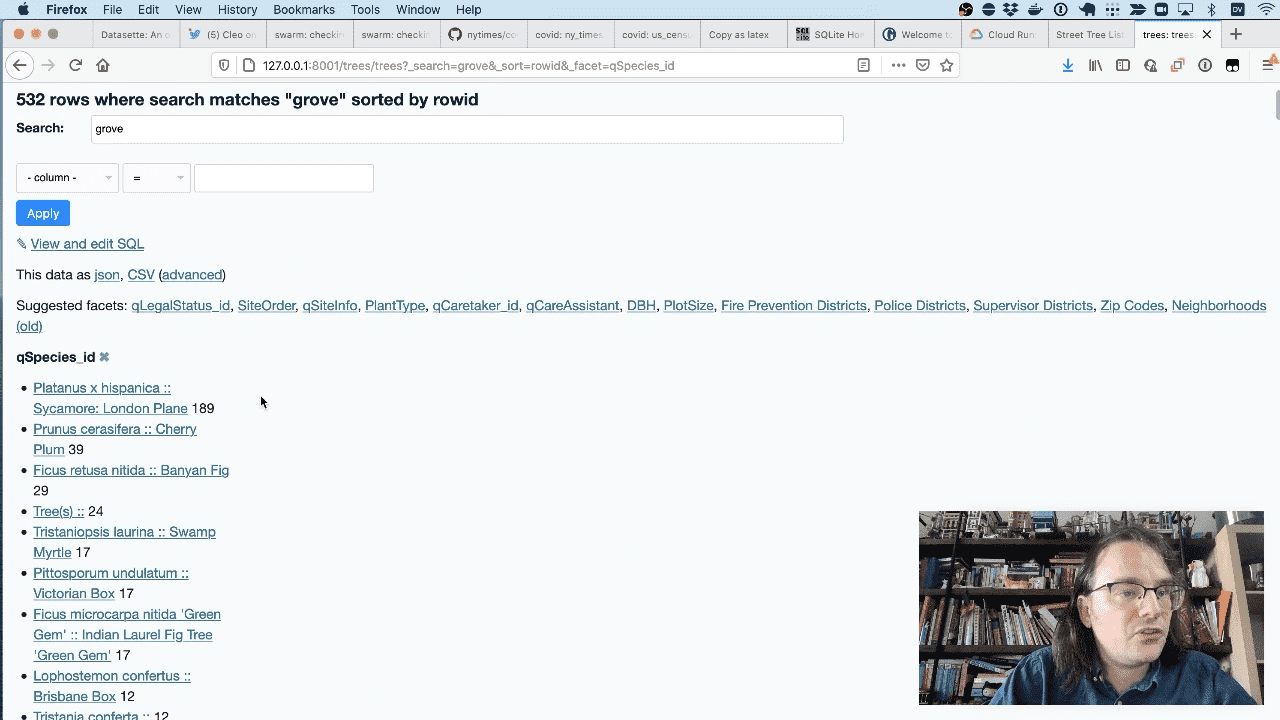
And I can facet by species to see the most common species of trees on Grove street. I can even get those back out as CSV or JSON.
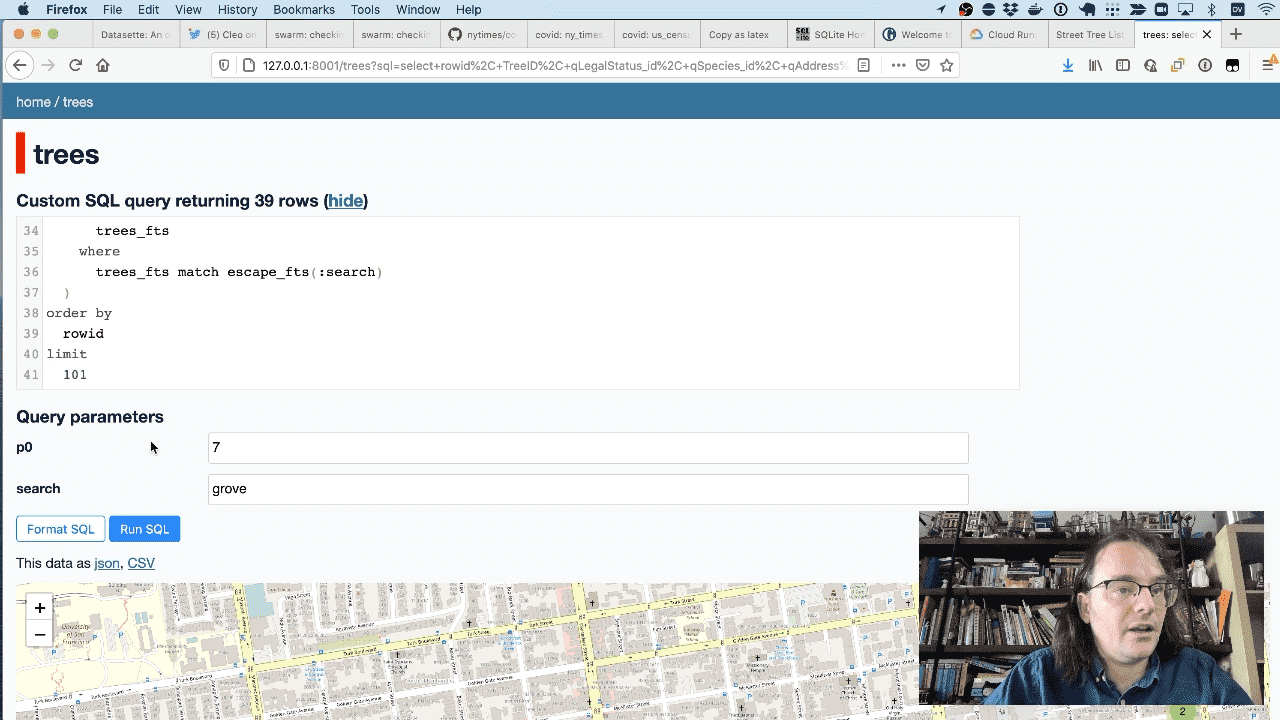
Because this is all running on a SQLite database, you can execute custom SQL queries against the database. This is safe because the database is opened in read-only mode and there’s a time limit on how long a query is allowed to execute for.
This means you can write applications in JavaScript that execute SQL against Datasette and pull back the results in JSON. I wrote more about this in a tutorial called Fast Autocomplete Search for Your Website.
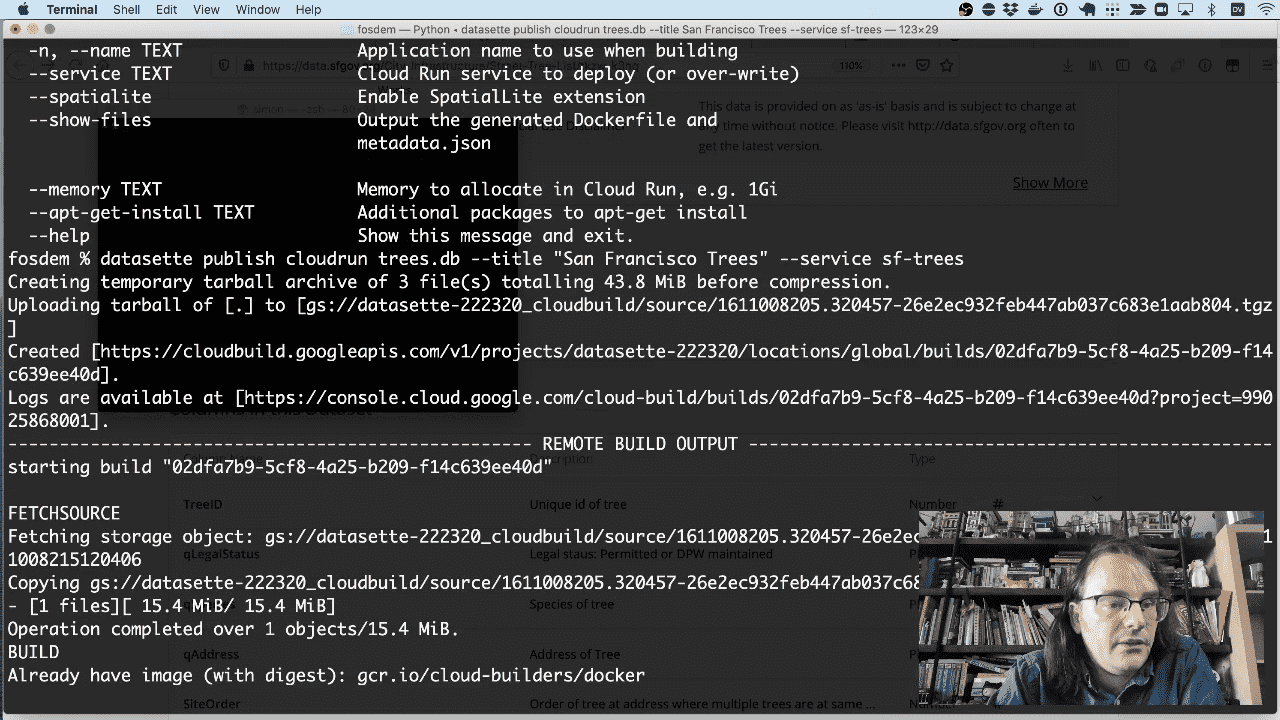
Let’s publish this to the internet, using the datasette publish command.
I’m going to publish trees.db to Google Cloud Run using the following commmand:
datasette publish cloudrun trees.db --title "San Francisco Trees" --service sf-trees
This will create a new Docker container with Datasette and the bundled trees database, push that to Google’s cloud infrastructure, and Google will then deploy it to Cloud Run and provide a URL.
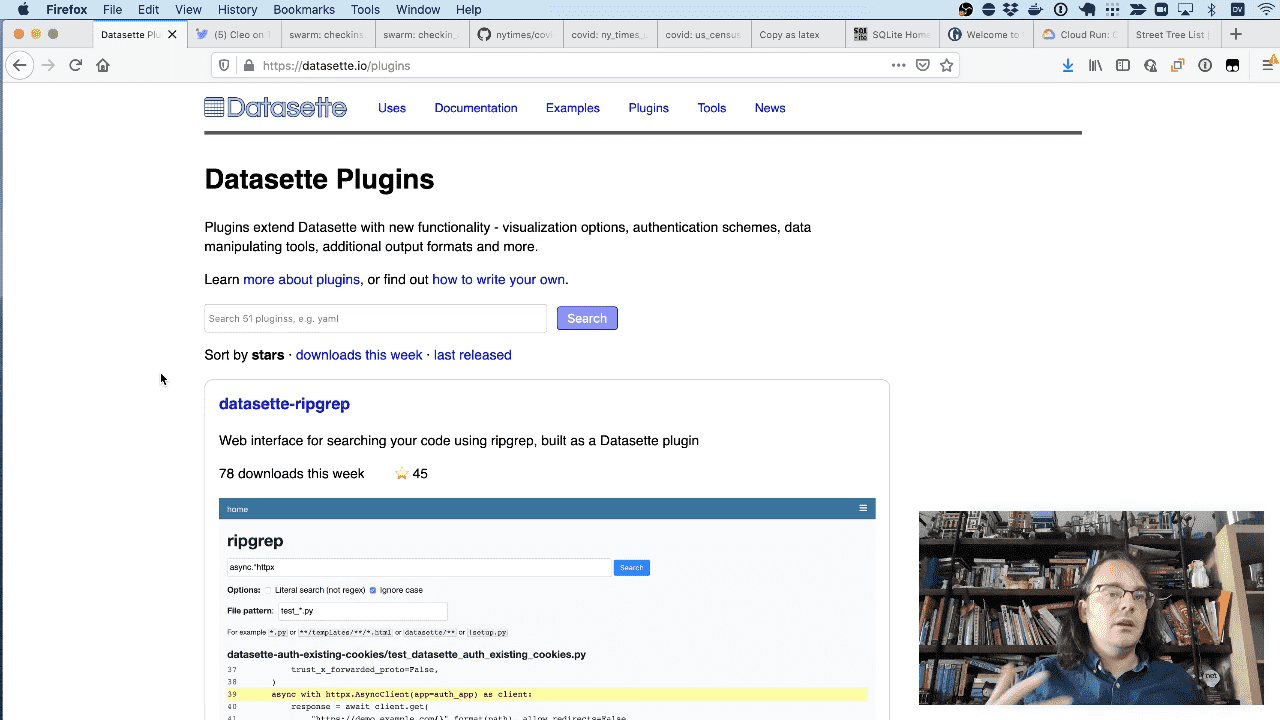
The Datasette website at datasette.io has details of both Datasette and the many other pieces that make up the overall Datasette project.
There are new 56 plugins in the plugin directory there.
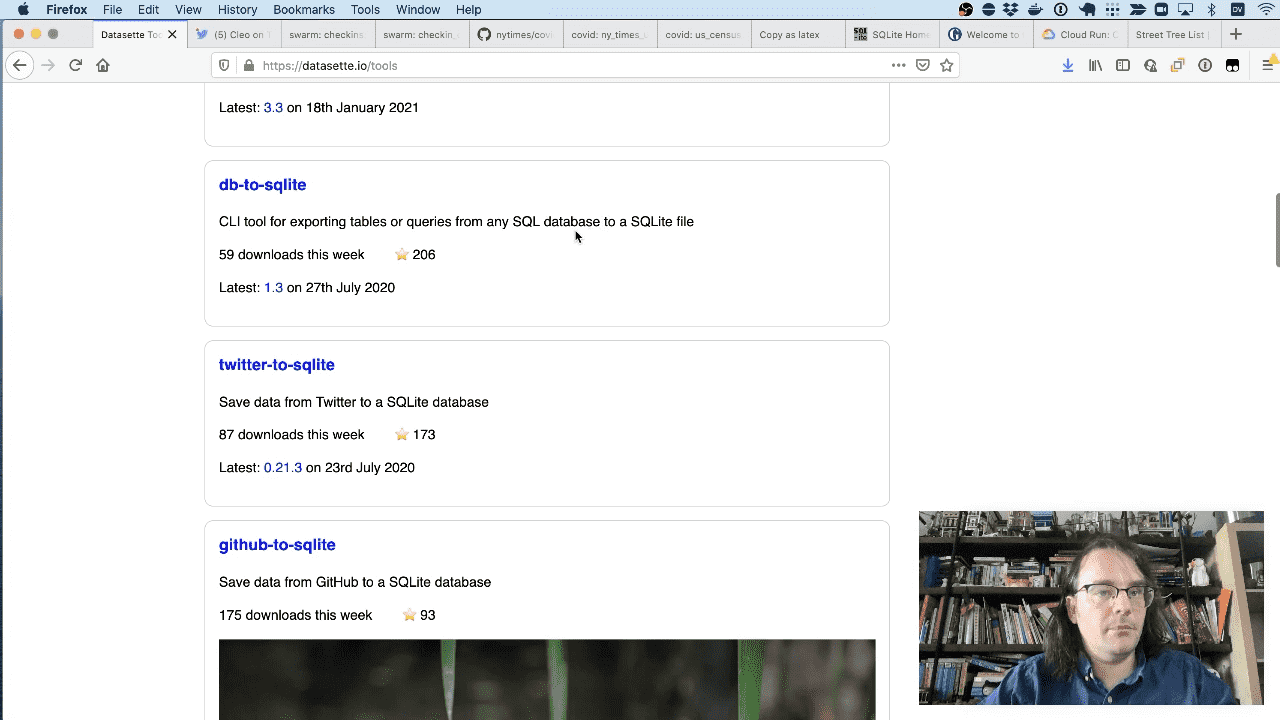
There’s also a collection of tools for working with SQLite databases—both manipulating existing databases and creating new ones with data pulled from APIs, different file formats and other relational databases.
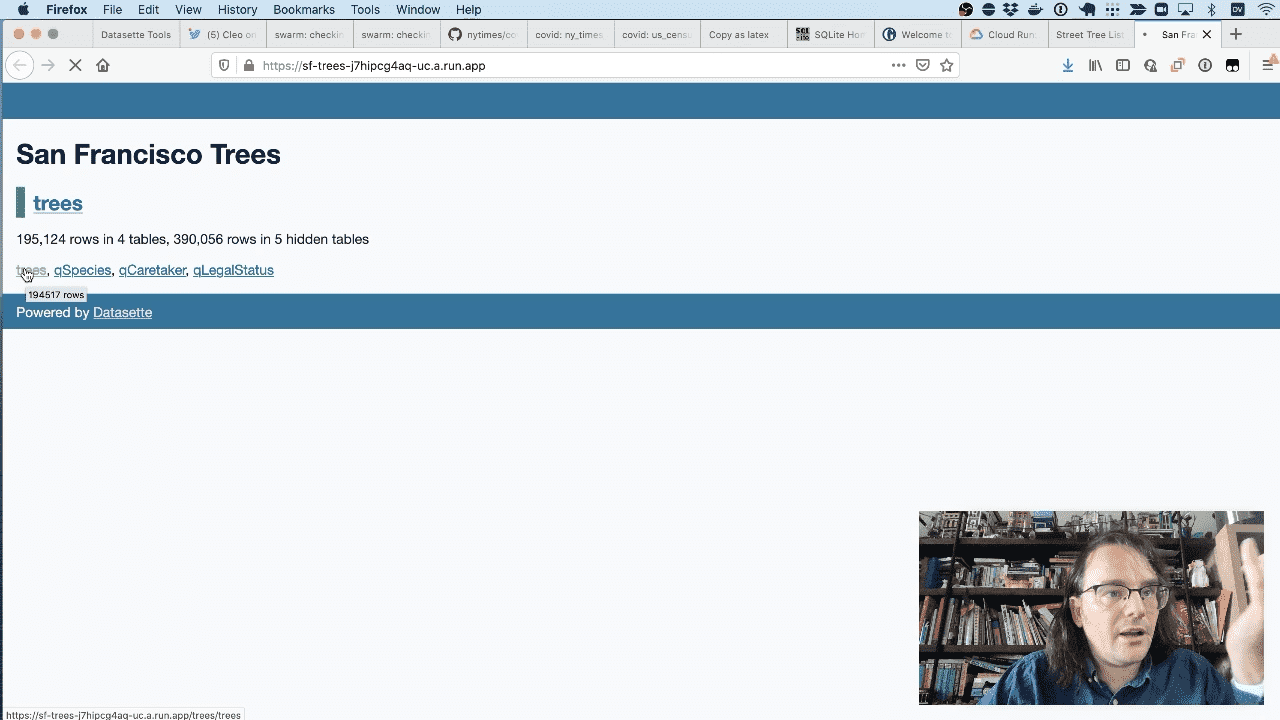
Now thet the publish flow has finished, you can interact with the trees database online at sf-trees-j7hipcg4aq-uc.a.run.app.
To deploy it using the datasette-cluster-map plugin, run this:
datasette publish cloudrun trees.db --title "San Francisco Trees" \
  --service sf-trees --install=datasette-cluster-map
The official Datasette website is itself an instance of Datasette. It uses custom templates for the homepage and other pages.
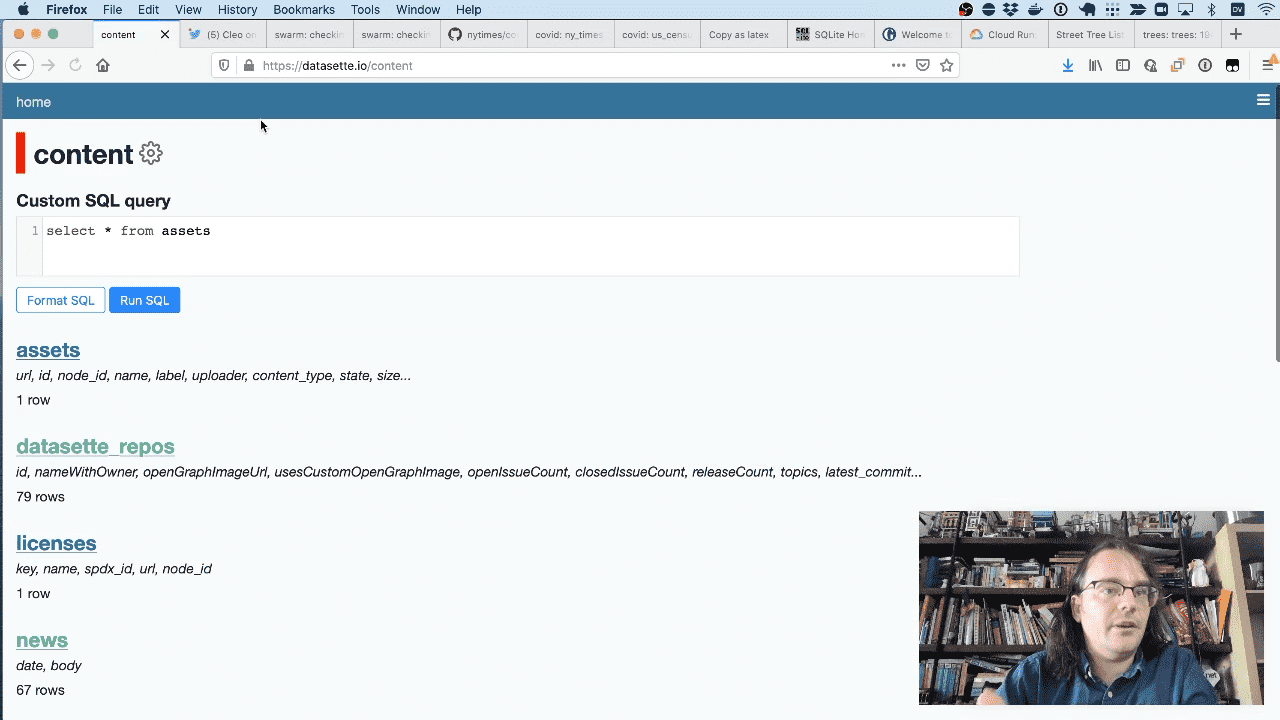
You can browse the underlying data tables at datasette.io/content.
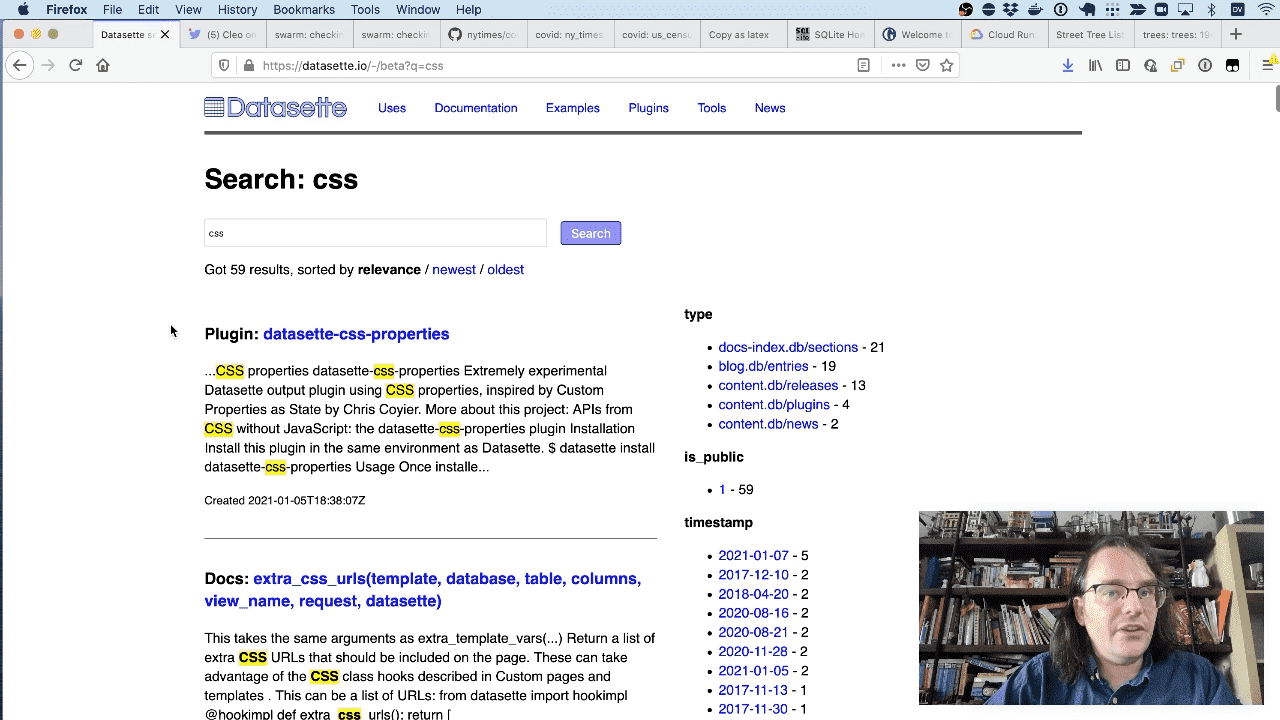
It also has a search engine (built using dogsheep-beta) which can search across plugins, releases, documentation, blog entries and more.
Here’s an example search for CSS.
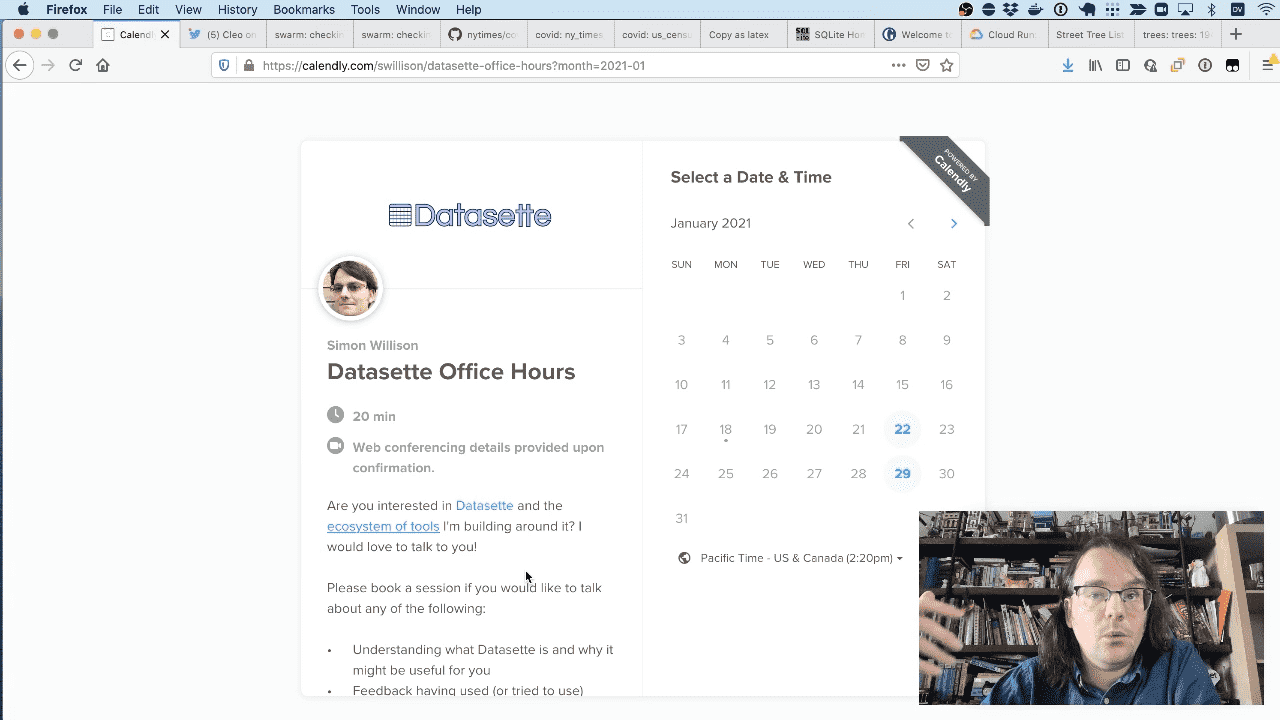
If you’d like to have a one-on-one conversation with me about Datasette you can sign up for Datasette office hours. I love talking to people about these projects!
Recent articles
- Options for accessing Llama 3 from the terminal using LLM - 22nd April 2024
- AI for Data Journalism: demonstrating what we can do with this stuff right now - 17th April 2024
- Three major LLM releases in 24 hours (plus weeknotes) - 10th April 2024
- Building files-to-prompt entirely using Claude 3 Opus - 8th April 2024
- Running OCR against PDFs and images directly in your browser - 30th March 2024
- llm cmd undo last git commit - a new plugin for LLM - 26th March 2024
- Building and testing C extensions for SQLite with ChatGPT Code Interpreter - 23rd March 2024
- Claude and ChatGPT for ad-hoc sidequests - 22nd March 2024
- Weeknotes: the aftermath of NICAR - 16th March 2024
- The GPT-4 barrier has finally been broken - 8th March 2024