datasette.io, an official project website for Datasette
13th December 2020
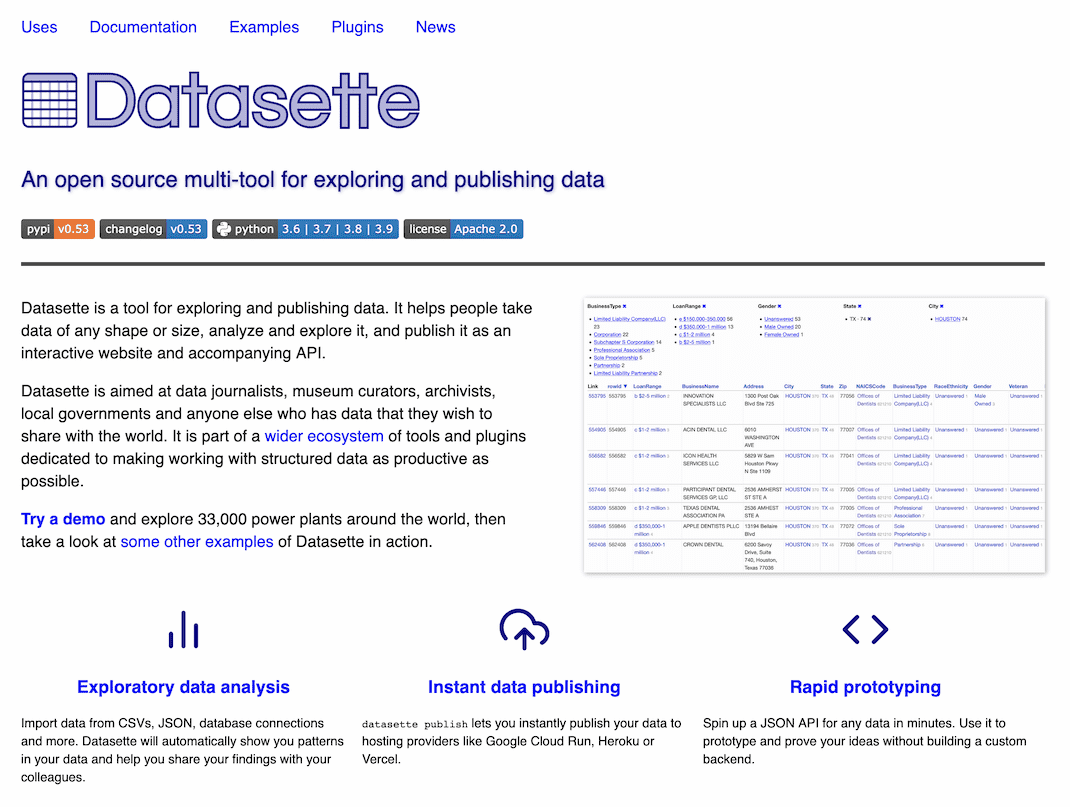
This week I launched datasette.io—the new official project website for Datasette.
Datasette’s first open source release was just over three years ago, but until now the official site duties have been split between the GitHub repository and the documentation.
The Baked Data architectural pattern
The site itself is built on Datasette (source code here). I’m using a pattern that I first started exploring with Niche Museums: most of the site content lives in a SQLite database, and I use custom Jinja templates to implement the site’s different pages.
This is effectively a variant of the static site generator pattern. The SQLite database is built by scripts as part of the deploy process, then deployed to Google Cloud Run as a binary asset bundled with the templates and Datasette itself.
I call this the Baked Data architectural pattern—with credit to Kevin Marks for helping me coin the right term. You bake the data into the application.
Update: I wrote more about this in July 2021: The Baked Data architectural pattern
It’s comparable to static site generation because everything is immutable, which greatly reduces the amount of things that can go wrong—and any content changes require a fresh deploy. It’s extremely easy to scale—just run more copies of the application with the bundled copy of the database. Cloud Run and other serverless providers handle that kind of scaling automatically.
Unlike static site generation, if a site has a thousand pages you don’t need to build a thousand HTML pages in order to deploy. A single template and a SQL query that incorporates arguments from the URL can serve as many pages as there are records in the database.
How the site is built
You can browse the site’s underlying database tables in Datasette here.
The news table powers the latest news on the homepage and /news. News lives in a news.yaml file in the site’s GitHub repository. I wrote a script to import the news that had been accumulating in the 0.52 README—now that news has moved to the site the README is a lot more slim!
At build time my yaml-to-sqlite script runs to load that news content into a database table.
The index.html template then uses the following Jinja code to output the latest news stories, using the sql() function from the datasette-template-sql Datasette plugin:
{% set ns = namespace(current_date="") %}
{% for row in sql("select date, body from news order by date desc limit 15", database="content") %}
    {% if prettydate(row["date"]) != (ns.current_date and prettydate(ns.current_date)) %}
    <h3>{{ prettydate(row["date"]) }} <a href="/news/{{ row["date"] }}" style="font-size: 0.8em; opacity: 0.4">#</a></h3>
    {% set ns.current_date = prettydate(row["date"]) %}
    {% endif %}
    {{ render_markdown(row["body"]) }}
{% endfor %}
prettydate() is a custom function I wrote in a one-off plugin for the site. The namespace() stuff is a Jinja trick that lets me keep track of the current date heading in the loop, so I can output a new date heading only if the news item occurs on a different day from the previous one.
render_markdown() is provided by the datasette-render-markdown plugin.
I wanted permalinks for news stories, but since they don’t have identifiers or titles I decided to provide a page for each day instead—for example https://datasette.io/news/2020-12-10
These pages are implemented using Path parameters for custom page templates, introduced in Datasette 0.49. The implementation is a single template file at templates/pages/news/{yyyy}-{mm}-{dd}.html, the full contents of which is:
{% extends "page_base.html" %}

{% block title %}Datasette News: {{ prettydate(yyyy + "-" + mm + "-" + dd) }}{% endblock %}

{% block content %}

{% set stories = sql("select date, body from news where date = ? order by date desc", [yyyy + "-" + mm + "-" + dd], database="content") %}
{% if not stories %}
    {{ raise_404("News not found") }}
{% endif %}
<h1><a href="/news">News</a>: {{ prettydate(yyyy + "-" + mm + "-" + dd) }}</h1>

{% for row in stories %}
    {{ render_markdown(row["body"]) }}
{% endfor %}

{% endblock %}
The crucial trick here is that, because the filename is news/{yyyy}-{mm}-{dd}.html, a request to /news/2020-12-10 will render that template with the yyyy, mm and dd template variables set to those values from the URL.
It can then execute a SQL query that incorporates those values. It assigns the results to a stories variable, then checks that at least one story was returned—if not, it raises a 404 error.
See Datasette’s custom pages documentation for more details on how this all works.
The site also offers an Atom feed of recent news. This is powered by the datasette-atom using the output of this canned SQL query, with a render_markdown() SQL function provided by this site plugin.
The plugin directory
One of the features I’m most excited about on the site is the new Datasette plugin directory. Datasette has over 50 plugins now and I’ve been wanting a definitive directory of them for a while.
It’s pretty basic at the moment, offering a list of plugins plus simple LIKE based search, but I plan to expand it a great deal in the future.
The fun part is where the data comes from. For a couple of years now I’ve been using GitHub topics to tag my plugins—I tag them with datasette-plugin, and the ones that I planned to feature on the site when I finally launched it were also tagged with datasette-io.
The datasette.io deployment process runs a script called build_plugin_directory.py, which uses a GraphQL query against the GitHub search API to find all repositories belonging to me that have been tagged with those tags.
That GraphQL query looks like this:
query {
  search(query:"topic:datasette-io topic:datasette-plugin user:simonw" type:REPOSITORY, first:100) {
    repositoryCount
    nodes {
      ... on Repository {
        id
        nameWithOwner
        openGraphImageUrl
        usesCustomOpenGraphImage
        repositoryTopics(first:100) {
          totalCount
          nodes {
            topic {
              name
            }
          }
        }
        openIssueCount: issues(states:[OPEN]) {
          totalCount
        }
        closedIssueCount: issues(states:[CLOSED]) {
          totalCount
        }
        releases(last: 1) {
          totalCount
          nodes {
            tagName
          }
        }
      }
    }
  }
}
It fetches the name of each repository, the openGraphImageUrl (which doesn’t appear to be included in the regular GitHub REST API), the number of open and closed issues and details of the most recent release.
The script has access to a copy of the current site database, which is downloaded on each deploy by the build script. It uses this to check if any of the repositories have new releases that haven’t previously been seen by the script.
Then it runs the github-to-sqlite releases command (part of github-to-sqlite) to fetch details of those new releases.
The end result is a database of repositories and releases for all of my tagged plugins. The plugin directory is then built against a custom SQL view.
Other site content
The rest of the site content is mainly static template files. I use the render_markdown() function inline in some of them so I can author in Markdown rather than HTML—here’s the template for the /examples page. The various Use cases for Datasette pages are likewise built as static templates.
Also this week: sqlite-utils analyze-tables
My other big project this week has involved building out a Datasette instance for a client. I’m working with over 5,000,000 rows of CSV data for this, which has been a great opportunity to push the limits of some of my tools.
Any time I’m working with new data I like to get a feel for its general shape. Having imported 5,000,000 rows with dozens of columns into a database, what can I learn about the columns beyond just browsing them in Datasette?
sqlite-utils analyze-tables (documented here) is my new tool for doing just that. It loops through every table and every column in the database, and for each column it calculates statistics that include:
- The total number of distinct values
- The total number of null or blank values
- For non-distinct columns, the 10 most common and 10 least common values
It can output those to the terminal, or if you add the --save option it will also save them to a SQLite table called _analyze_tables_—here’s that table for my github-to-sqlite demo instance.
I can then use the output of the tool to figure out which columns might be a primary key, or which ones warrant being extracted out into a separate lookup table using sqlite-utils extract.
I expect I’ll be expanding this feature a lot in the future, but I’m already finding it to be really helpful.
Datasette 0.53
I pushed out a small feature release of Datasette to accompany the new project website. Quoting the release notes:
- New
?column__arraynotcontains=table filter. (#1132)datasette servehas a new--createoption, which will create blank database files if they do not already exist rather than exiting with an error. (#1135)- New
?_header=offoption for CSV export which omits the CSV header row, documented here. (#1133)- “Powered by Datasette” link in the footer now links to https://datasette.io/. (#1138)
- Project news no longer lives in the README—it can now be found at https://datasette.io/news. (#1137)
Office hours
I had my first round of Datasette office hours on Friday—20 minute video chats with anyone who wants to talk to me about the project. I had five great conversations—it’s hard to overstate how thrilling it is to talk to people who are using Datasette to solve problems. If you’re an open source maintainer I can thoroughly recommend giving this format a try.
Releases this week
-
datasette-publish-fly: 1.0.1—2020-12-12
Datasette plugin for publishing data using Fly -
datasette-auth-passwords: 0.3.3—2020-12-11
Datasette plugin for authentication using passwords -
datasette: 0.53——2020-12-11
An open source multi-tool for exploring and publishing data -
datasette-column-inspect: 0.2a—2020-12-09
Experimental plugin that adds a column inspector -
datasette-pretty-json: 0.2.1—2020-12-09
Datasette plugin that pretty-prints any column values that are valid JSON objects or arrays -
yaml-to-sqlite: 0.3.1—2020-12-07
Utility for converting YAML files to SQLite -
datasette-seaborn: 0.2a0—2020-12-07
Statistical visualizations for Datasette using Seaborn
TIL this week
More recent articles
- AI for Data Journalism: demonstrating what we can do with this stuff right now - 17th April 2024
- Three major LLM releases in 24 hours (plus weeknotes) - 10th April 2024
- Building files-to-prompt entirely using Claude 3 Opus - 8th April 2024
- Running OCR against PDFs and images directly in your browser - 30th March 2024
- llm cmd undo last git commit - a new plugin for LLM - 26th March 2024
- Building and testing C extensions for SQLite with ChatGPT Code Interpreter - 23rd March 2024
- Claude and ChatGPT for ad-hoc sidequests - 22nd March 2024
- Weeknotes: the aftermath of NICAR - 16th March 2024
- The GPT-4 barrier has finally been broken - 8th March 2024
- Prompt injection and jailbreaking are not the same thing - 5th March 2024